| Param | Original file | Final file |
|---|---|---|
| Filename | modeM0/AS1A11_049T03_9000005228_36638cztM0_level2.evt | modeM0/AS1A11_049T03_9000005228_36638cztM0_level2_quad_clean.evt |
| Size (bytes) | 494,821,440 | 78,042,240 |
| Size | 471.9 MB | 74.4 MB |
| Events in quadrant A | 2,758,563 | 520,367 |
| Events in quadrant B | 4,405,771 | 506,710 |
| Events in quadrant C | 3,235,767 | 511,503 |
| Events in quadrant D | 4,249,806 | 476,917 |
| Mode SS | |||
|---|---|---|---|
| Quadrant | BADHDUFLAG | Total packets | Discarded packets |
| A | 0 | 100 | 0 |
| B | 0 | 100 | 0 |
| C | 0 | 100 | 0 |
| D | 0 | 100 | 0 |
| Mode M9 | |||
|---|---|---|---|
| Quadrant | BADHDUFLAG | Total packets | Discarded packets |
| A | 0 | 31 | 0 |
| B | 0 | 31 | 0 |
| C | 0 | 31 | 0 |
| D | 0 | 32 | 0 |
| Mode M0 | |||
|---|---|---|---|
| Quadrant | BADHDUFLAG | Total packets | Discarded packets |
| A | 0 | 11042 | 3 |
| B | 0 | 16317 | 2 |
| C | 0 | 12559 | 2 |
| D | 0 | 16036 | 2 |
| Quadrant | Total seconds | Saturated seconds | Saturation percentage |
|---|---|---|---|
| A | 4960 | 12 | 0.241935% |
| B | 4960 | 538 | 10.846774% |
| C | 4960 | 182 | 3.669355% |
| D | 4960 | 260 | 5.241935% |
Noise dominated data is calculated using 1-second bins in cleaned event files. If a bin has >2000 counts, and if more than 50% of those come from <1% of pixels, then it is considered to be noise-dominated and hence unusable.
| Quadrant | # 1 sec bins | Bins with >0 counts | Bins with >2000 counts | High rate bins dominated by noise | Noise dominated (total time) | Noise dominated (detector-on time) | Marked lightcurve |
|---|---|---|---|---|---|---|---|
| A | 7083 | 4961 | 0 | 0 | 0.00% | 0.00% | 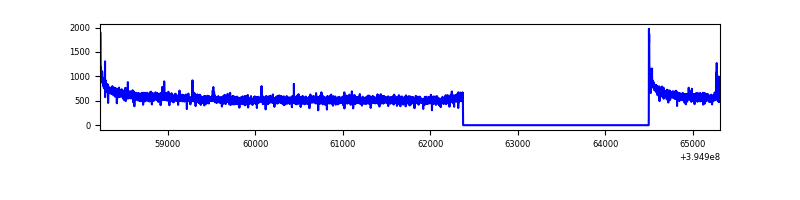 |
| B | 7083 | 4961 | 303 | 303 | 4.28% | 6.11% | 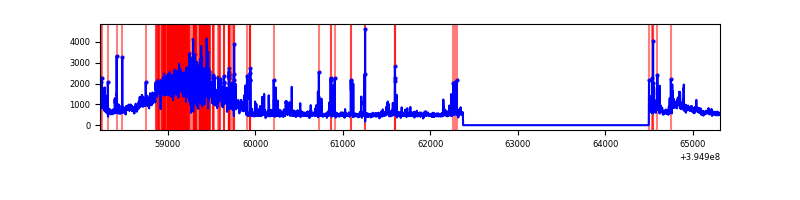 |
| C | 7083 | 4961 | 133 | 133 | 1.88% | 2.68% | 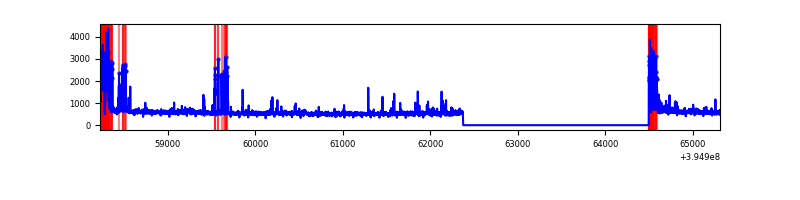 |
| D | 7083 | 4961 | 250 | 250 | 3.53% | 5.04% | 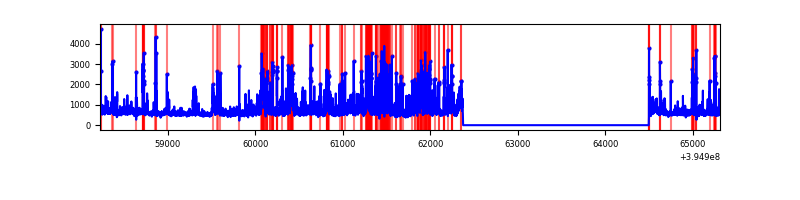 |
Top three noisy pixels from each quadrant. If the there are fewer than three noisy pixels in the level2.evt file, extra rows are filled as -1
| Pixel properties | Quadrant properties | ||||||
|---|---|---|---|---|---|---|---|
| Quadrant | DetID | PixID | Counts | Sigma | Mean | Median | Sigma |
| A | 10 | 83 | 195775 | 1496.68 | 654 | 644 | 130.4 |
| A | 7 | 192 | 15439 | 113.48 | 654 | 644 | 130.4 |
| A | 13 | 6 | 12819 | 93.38 | 654 | 644 | 130.4 |
| B | 5 | 200 | 1705807 | 14515.77 | 625 | 611 | 117.5 |
| B | 5 | 255 | 153569 | 1302.08 | 625 | 611 | 117.5 |
| B | 0 | 219 | 20114 | 166.02 | 625 | 611 | 117.5 |
| C | 0 | 10 | 509909 | 3598.51 | 618 | 624 | 141.5 |
| C | 15 | 214 | 210957 | 1486.17 | 618 | 624 | 141.5 |
| C | 14 | 254 | 79874 | 559.97 | 618 | 624 | 141.5 |
| D | 12 | 235 | 1433772 | 9434.06 | 626 | 612 | 151.9 |
| D | 2 | 153 | 99589 | 651.54 | 626 | 612 | 151.9 |
| D | 2 | 249 | 96447 | 630.85 | 626 | 612 | 151.9 |
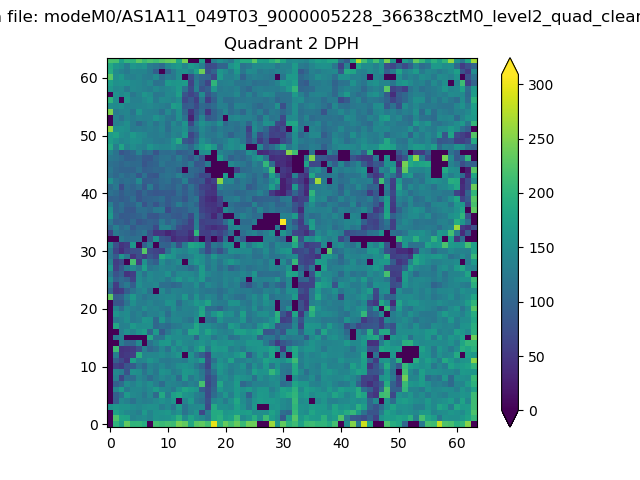
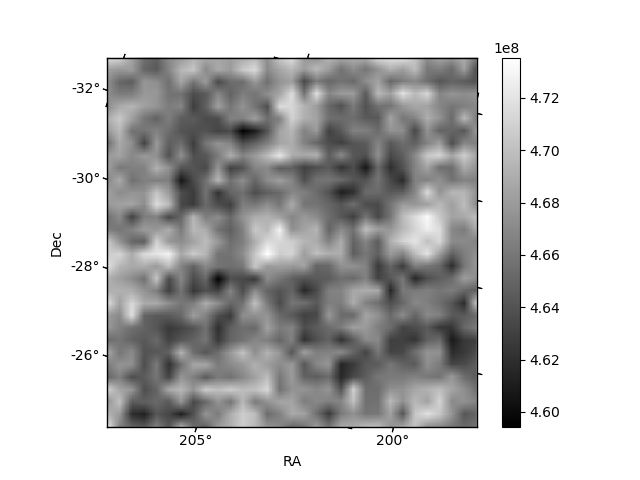
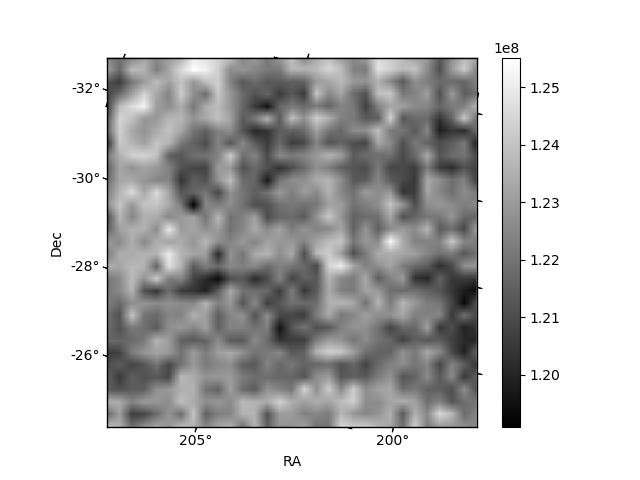
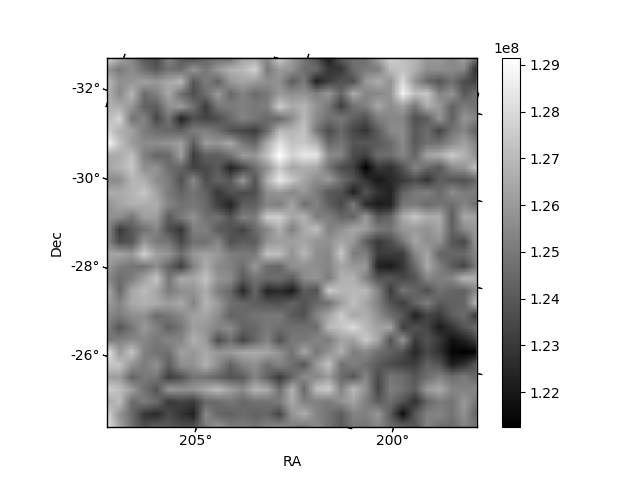
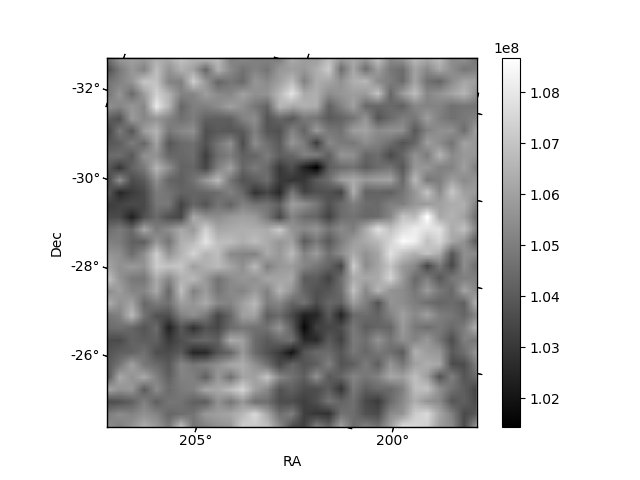
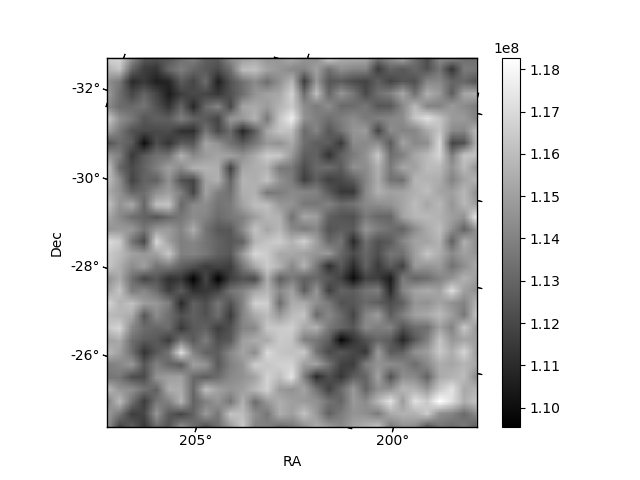
Histogram calculated using DETX and DETY for each event in the final _common_clean file
| Quadrant A | 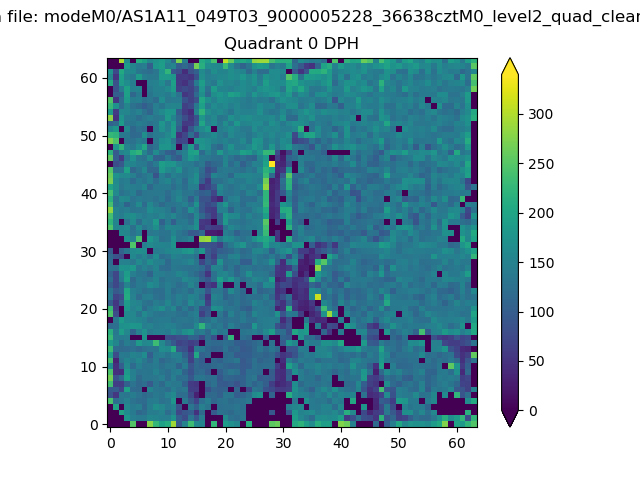 |
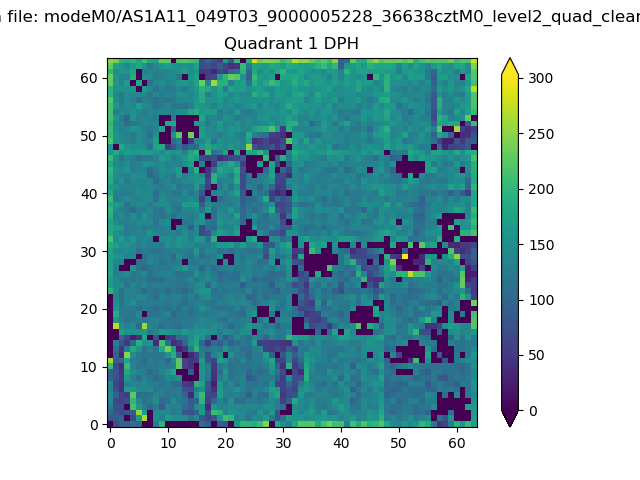 |
Quadrant B |
|---|---|---|---|
| Quadrant D | 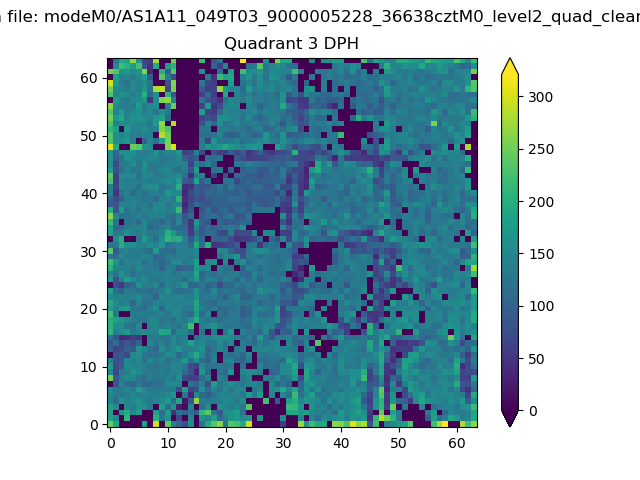 |
 |
Quadrant C |
| Plot type | Count rate plots | Images |
|---|---|---|
| Comparison with Poisson distribution Blue bars denote a histogram of data divided into 1 sec bins. Red curve is a Poisson curve with rate = median count rate of data. |
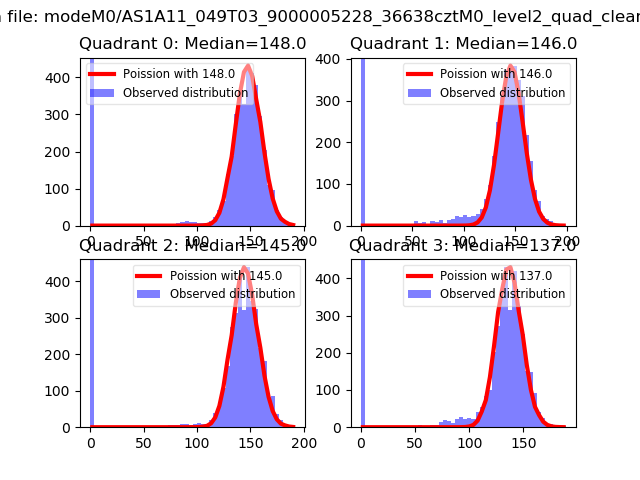 |
 |
| Quadrant-wise count rates Data is divided into 100 sec bins |
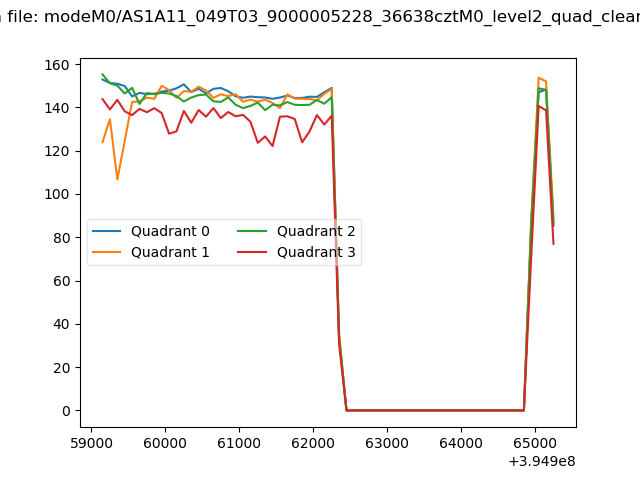 |
|
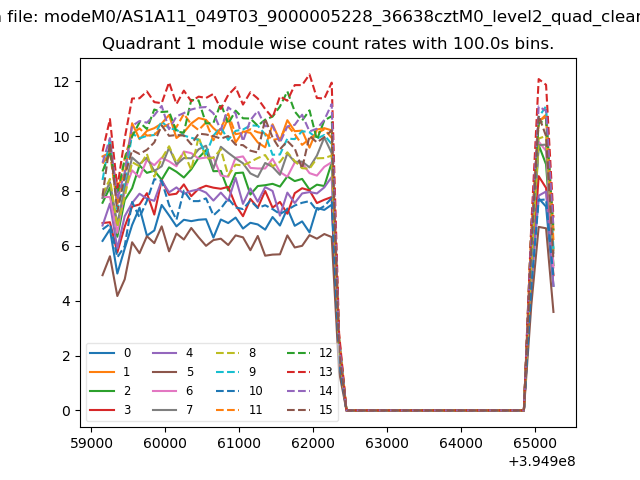
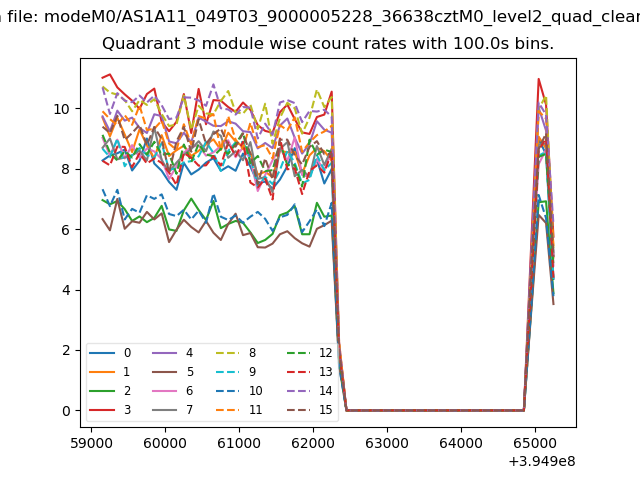
| Module-wise count rates for Quadrant A Data is divided into 100 sec bins |
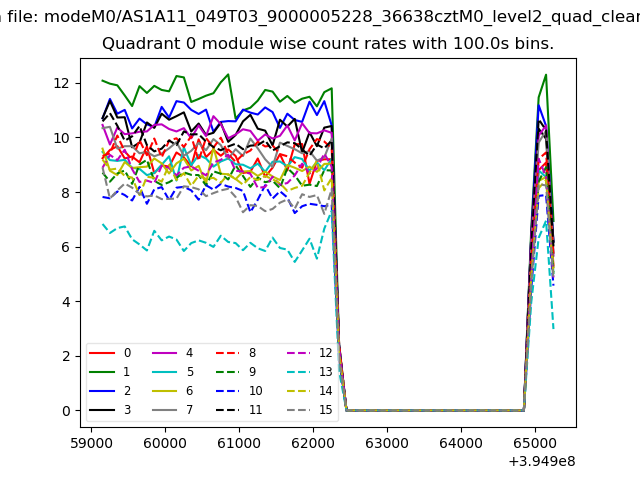 |
 |
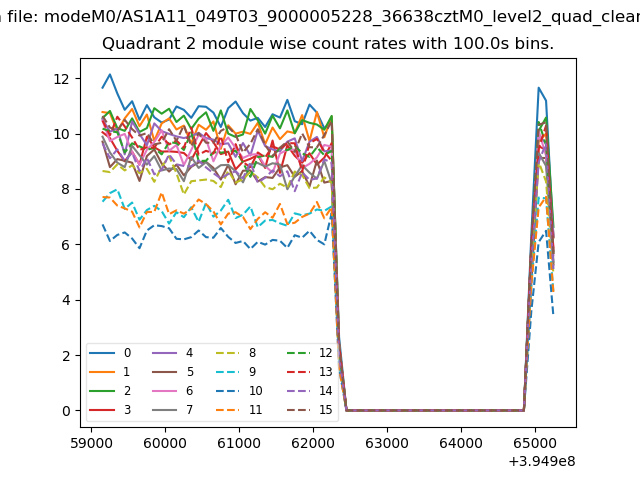
| Module-wise count rates for Quadrant B Data is divided into 100 sec bins |
 |
 |
| Module-wise count rates for Quadrant C Data is divided into 100 sec bins |
 |
 |
| Module-wise count rates for Quadrant D Data is divided into 100 sec bins |
 |
 |
| Parameter | Plot |
|---|---|
| CZT HV Monitor | 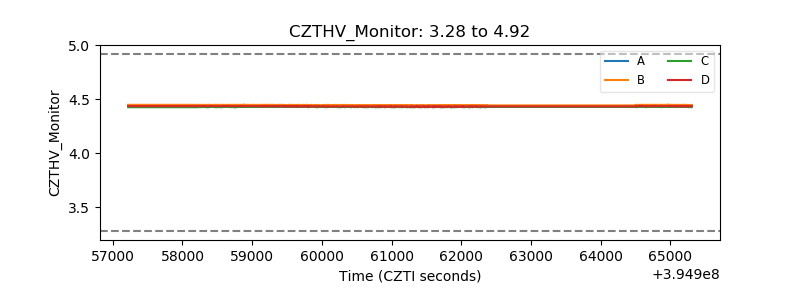 |
| D_VDD | 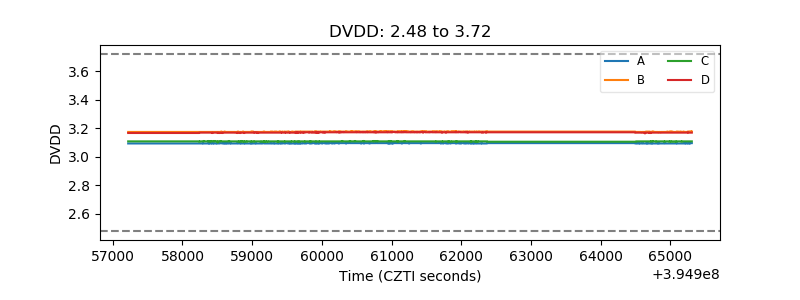 |
| Temperature 1 | 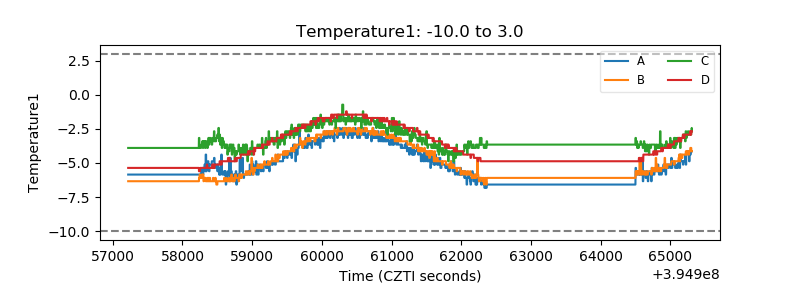 |
| Veto HV Monitor | 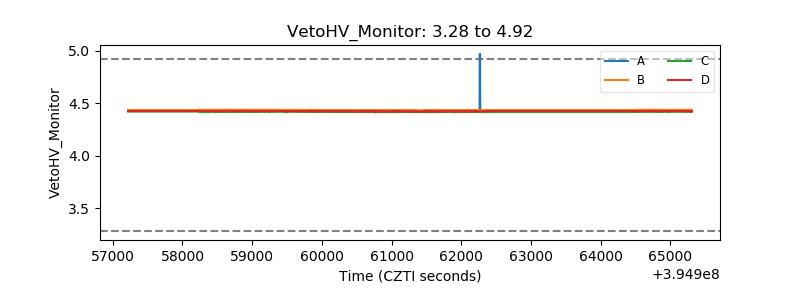 |
| Veto LLD | 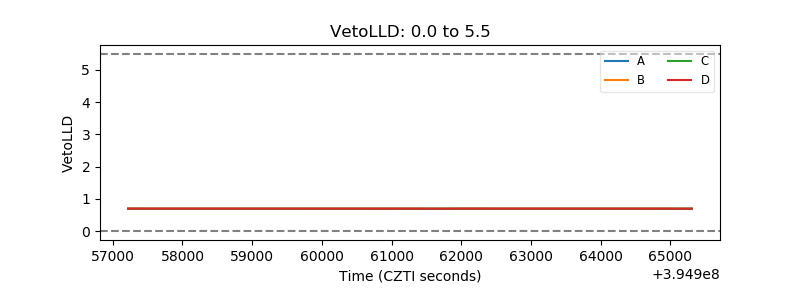 |
| Alpha Counter | 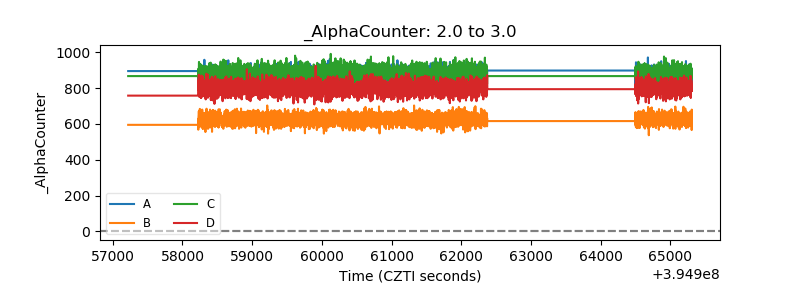 |
| _CPM_Rate | 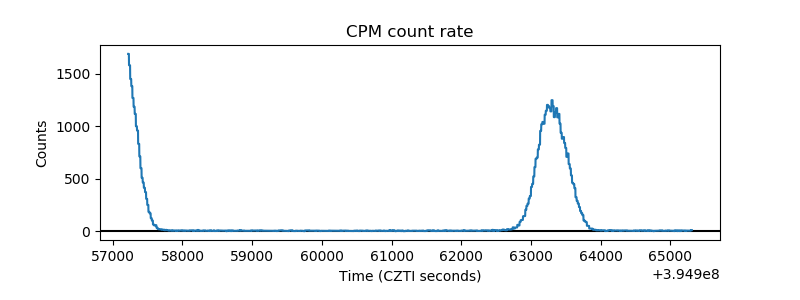 |
| CZT Counter | 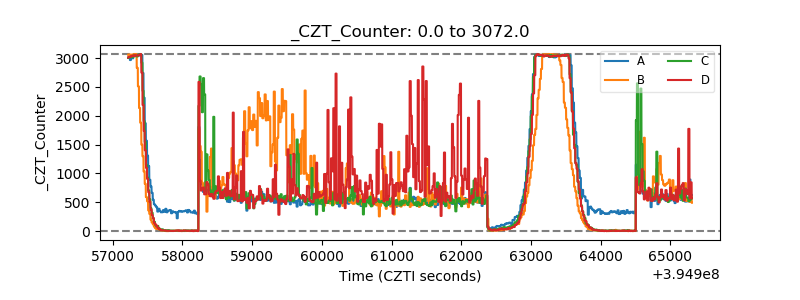 |
| +2.5 Volts monitor |  |
| +5 Volts monitor |  |
| _ROLL_ROT | 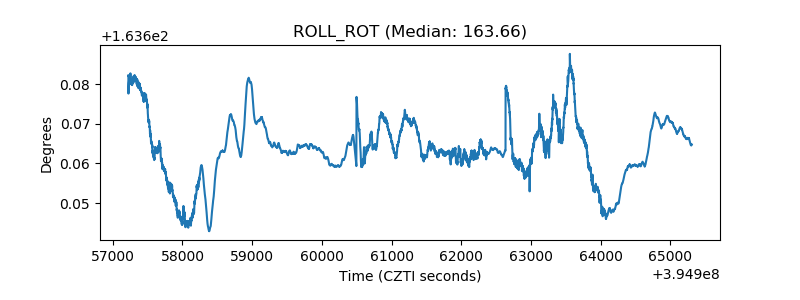 |
| _Roll_DEC | 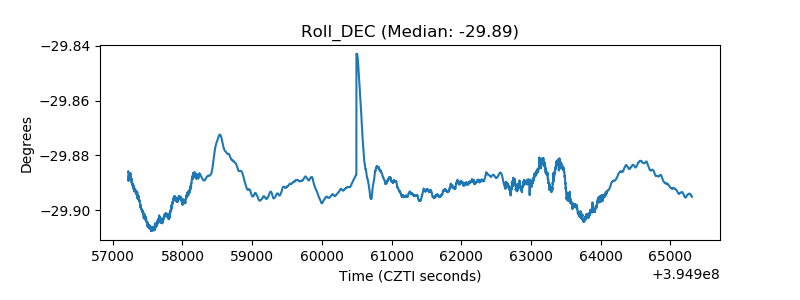 |
| _Roll_RA | 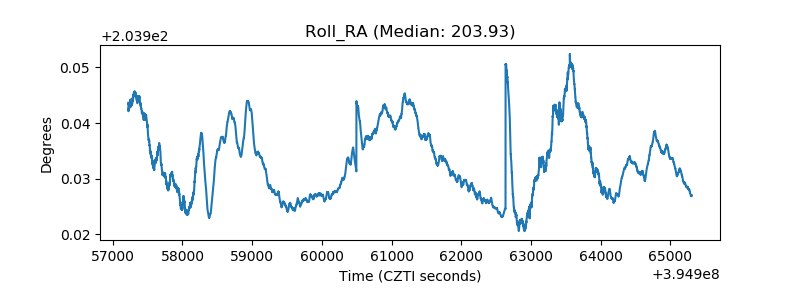 |
| Veto Counter | 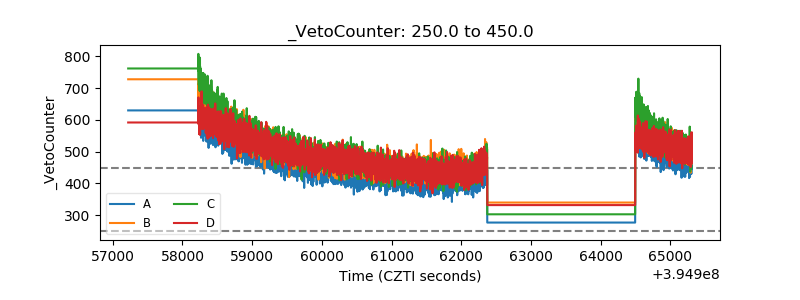 |