| Param | Original file | Final file |
|---|---|---|
| Filename | modeM0/AS1A11_049T03_9000005228_36639cztM0_level2.evt | modeM0/AS1A11_049T03_9000005228_36639cztM0_level2_quad_clean.evt |
| Size (bytes) | 337,708,800 | 68,140,800 |
| Size | 322.1 MB | 65.0 MB |
| Events in quadrant A | 1,988,807 | 464,045 |
| Events in quadrant B | 2,388,722 | 460,310 |
| Events in quadrant C | 2,254,543 | 452,600 |
| Events in quadrant D | 3,339,609 | 420,698 |
| Mode SS | |||
|---|---|---|---|
| Quadrant | BADHDUFLAG | Total packets | Discarded packets |
| A | 0 | 76 | 0 |
| B | 0 | 76 | 0 |
| C | 0 | 76 | 0 |
| D | 0 | 76 | 0 |
| Mode M9 | |||
|---|---|---|---|
| Quadrant | BADHDUFLAG | Total packets | Discarded packets |
| A | 0 | 14 | 0 |
| B | 0 | 14 | 0 |
| C | 0 | 14 | 0 |
| D | 0 | 15 | 0 |
| Mode M0 | |||
|---|---|---|---|
| Quadrant | BADHDUFLAG | Total packets | Discarded packets |
| A | 0 | 8063 | 1 |
| B | 0 | 9460 | 1 |
| C | 0 | 8921 | 1 |
| D | 0 | 12542 | 1 |
| Quadrant | Total seconds | Saturated seconds | Saturation percentage |
|---|---|---|---|
| A | 3754 | 8 | 0.213106% |
| B | 3754 | 89 | 2.370804% |
| C | 3754 | 78 | 2.077784% |
| D | 3754 | 214 | 5.700586% |
Noise dominated data is calculated using 1-second bins in cleaned event files. If a bin has >2000 counts, and if more than 50% of those come from <1% of pixels, then it is considered to be noise-dominated and hence unusable.
| Quadrant | # 1 sec bins | Bins with >0 counts | Bins with >2000 counts | High rate bins dominated by noise | Noise dominated (total time) | Noise dominated (detector-on time) | Marked lightcurve |
|---|---|---|---|---|---|---|---|
| A | 3754 | 3754 | 0 | 0 | 0.00% | 0.00% | 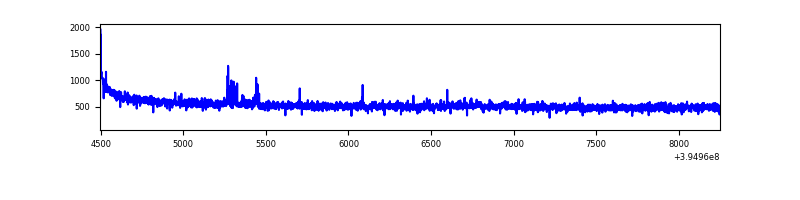 |
| B | 3754 | 3754 | 53 | 53 | 1.41% | 1.41% | 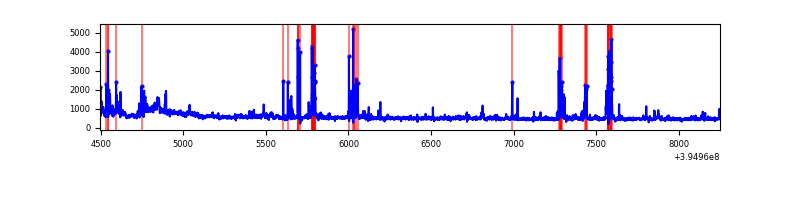 |
| C | 3754 | 3754 | 52 | 52 | 1.39% | 1.39% | 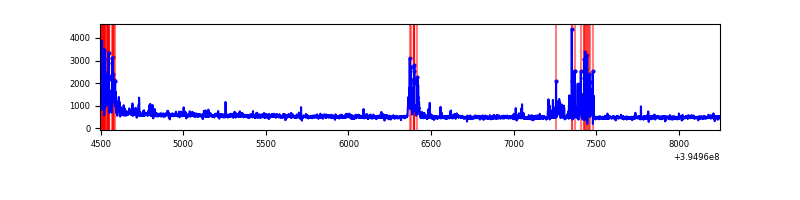 |
| D | 3754 | 3754 | 197 | 197 | 5.25% | 5.25% |  |
Top three noisy pixels from each quadrant. If the there are fewer than three noisy pixels in the level2.evt file, extra rows are filled as -1
| Pixel properties | Quadrant properties | ||||||
|---|---|---|---|---|---|---|---|
| Quadrant | DetID | PixID | Counts | Sigma | Mean | Median | Sigma |
| A | 10 | 83 | 125153 | 1327.14 | 470 | 462 | 94.0 |
| A | 7 | 192 | 26848 | 280.84 | 470 | 462 | 94.0 |
| A | 9 | 143 | 17116 | 177.26 | 470 | 462 | 94.0 |
| B | 5 | 200 | 223119 | 2550.06 | 456 | 447 | 87.3 |
| B | 5 | 255 | 218726 | 2499.75 | 456 | 447 | 87.3 |
| B | 0 | 229 | 55632 | 631.98 | 456 | 447 | 87.3 |
| C | 0 | 10 | 176241 | 1702.48 | 446 | 449 | 103.3 |
| C | 14 | 254 | 159358 | 1538.97 | 446 | 449 | 103.3 |
| C | 15 | 214 | 157682 | 1522.74 | 446 | 449 | 103.3 |
| D | 12 | 235 | 1140046 | 10340.49 | 447 | 435 | 110.2 |
| D | 2 | 153 | 132648 | 1199.66 | 447 | 435 | 110.2 |
| D | 13 | 171 | 64744 | 583.52 | 447 | 435 | 110.2 |
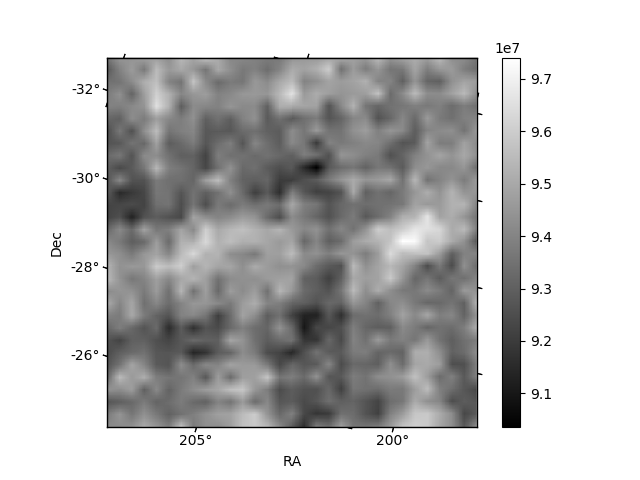
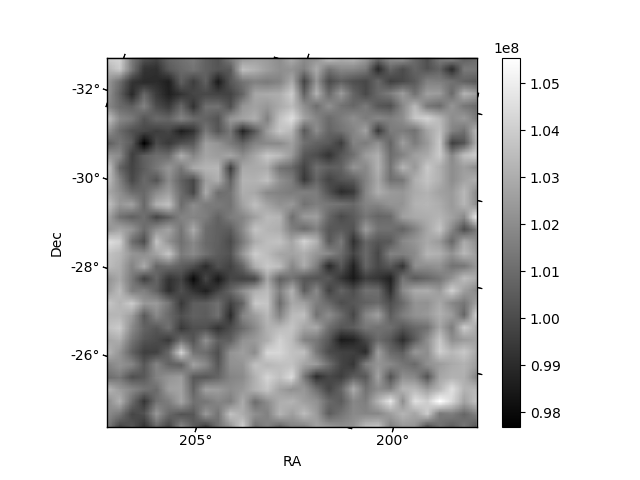
Histogram calculated using DETX and DETY for each event in the final _common_clean file
| Quadrant A | 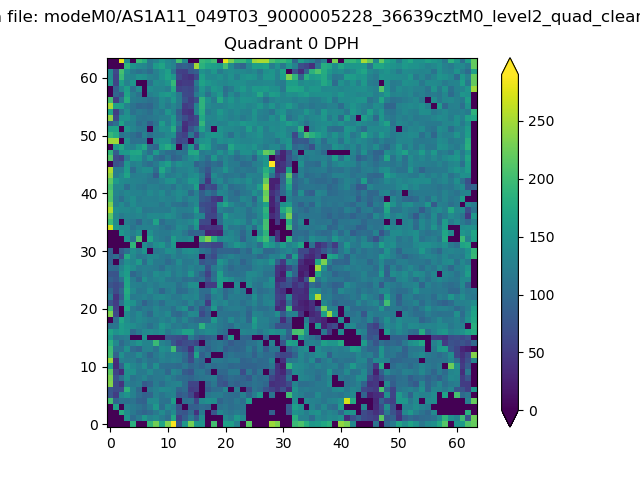 |
 |
Quadrant B |
|---|---|---|---|
| Quadrant D | 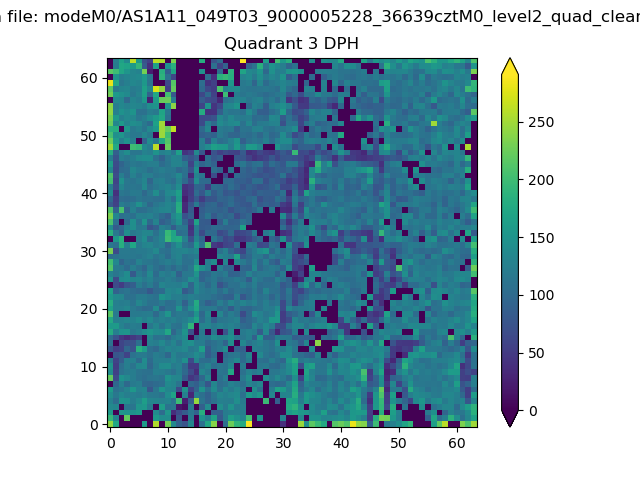 |
 |
Quadrant C |
| Plot type | Count rate plots | Images |
|---|---|---|
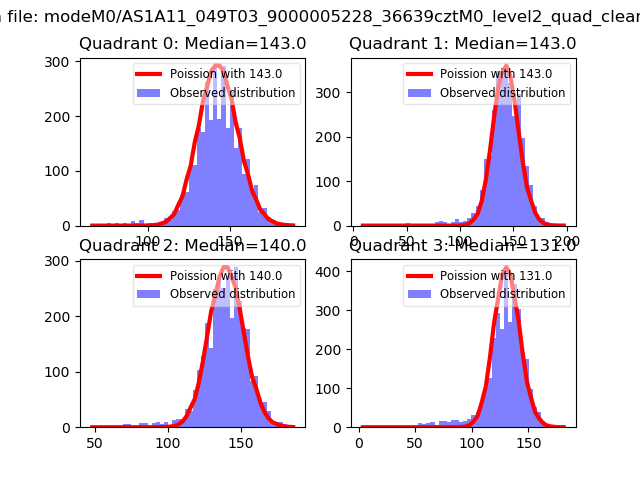
| Comparison with Poisson distribution Blue bars denote a histogram of data divided into 1 sec bins. Red curve is a Poisson curve with rate = median count rate of data. |
 |
 |
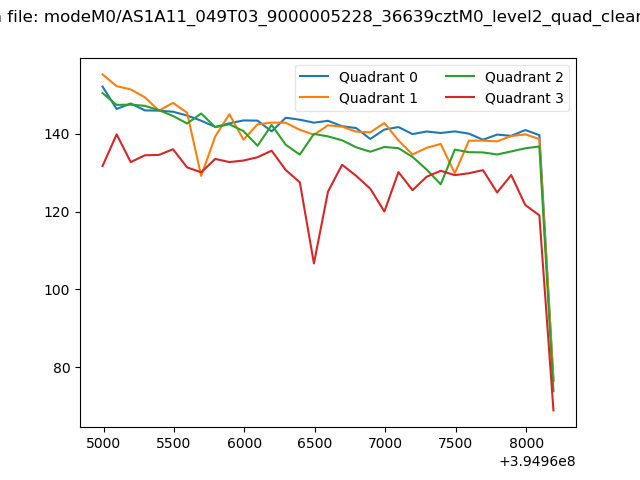
| Quadrant-wise count rates Data is divided into 100 sec bins |
 |
|
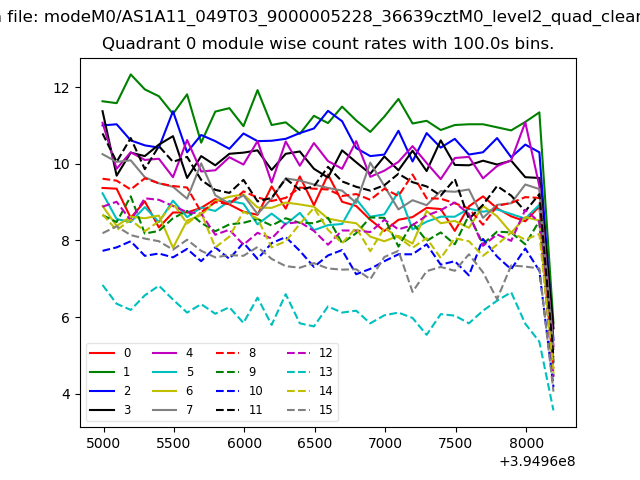
| Module-wise count rates for Quadrant A Data is divided into 100 sec bins |
 |
 |
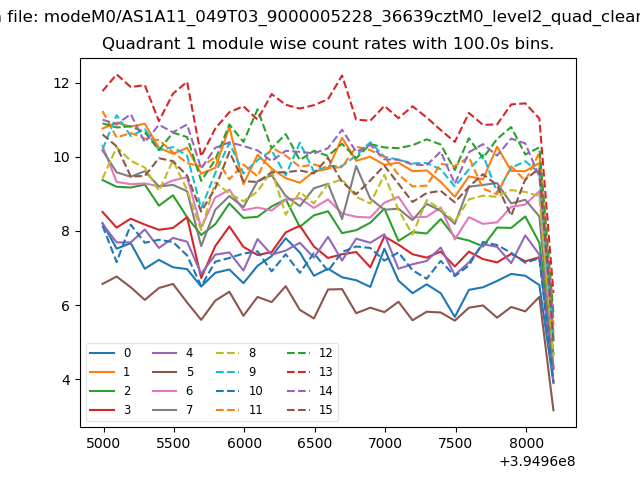
| Module-wise count rates for Quadrant B Data is divided into 100 sec bins |
 |
 |
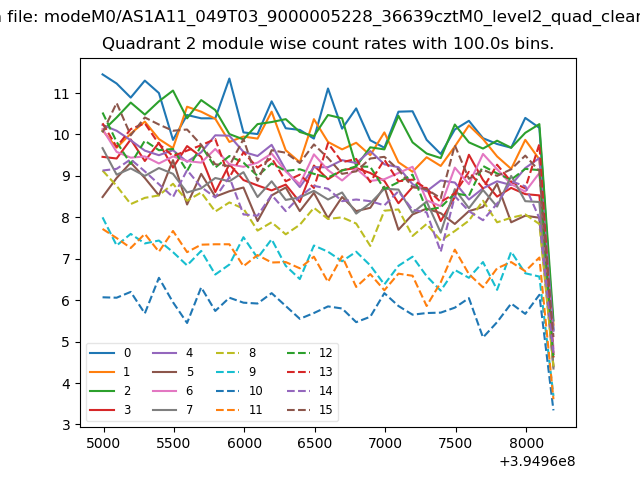
| Module-wise count rates for Quadrant C Data is divided into 100 sec bins |
 |
 |
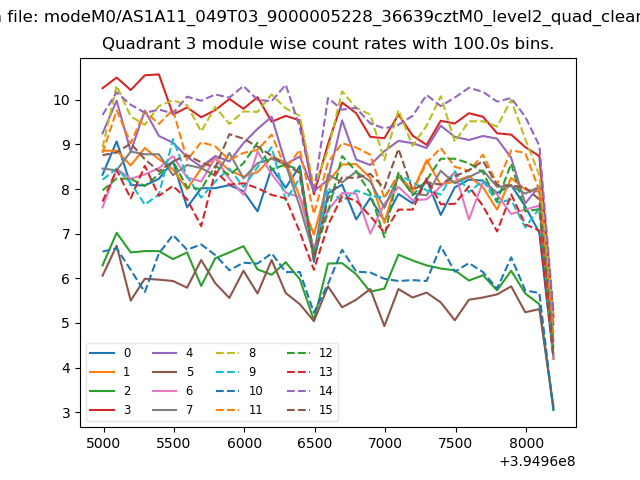
| Module-wise count rates for Quadrant D Data is divided into 100 sec bins |
 |
 |
| Parameter | Plot |
|---|---|
| CZT HV Monitor | 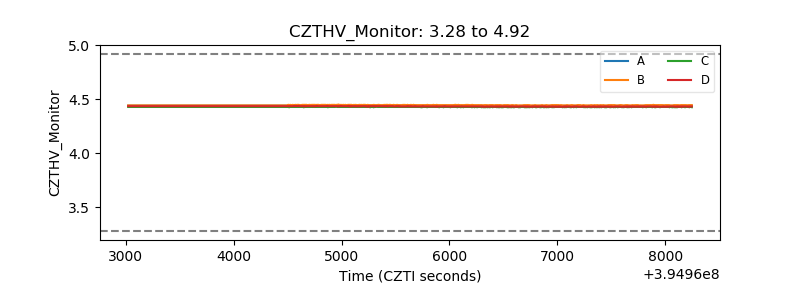 |
| D_VDD | 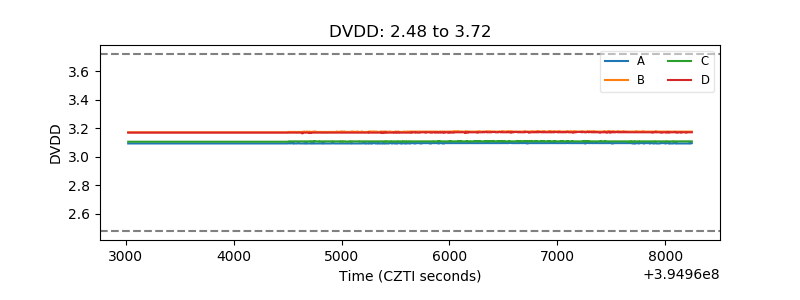 |
| Temperature 1 | 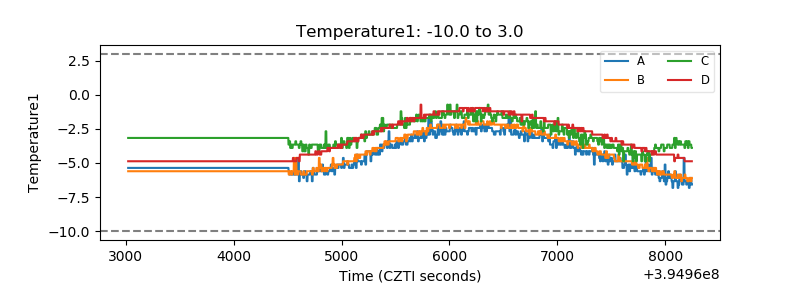 |
| Veto HV Monitor | 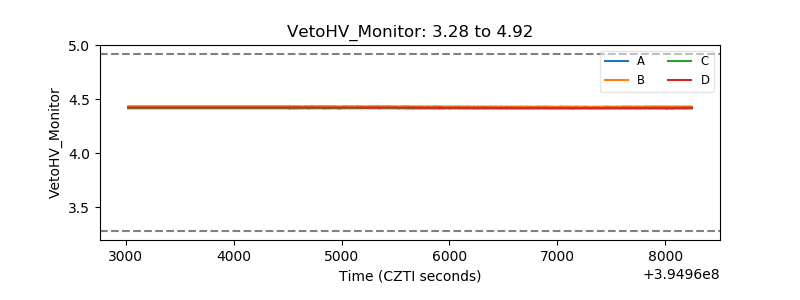 |
| Veto LLD | 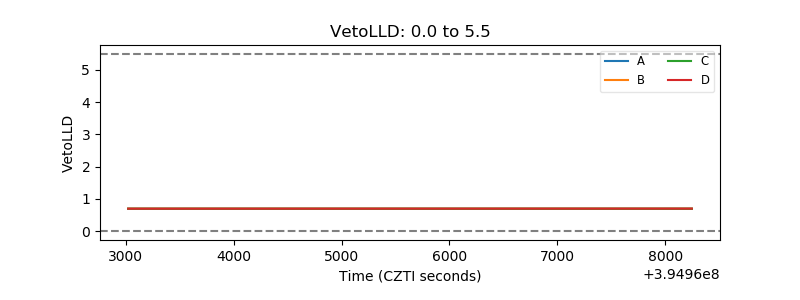 |
| Alpha Counter | 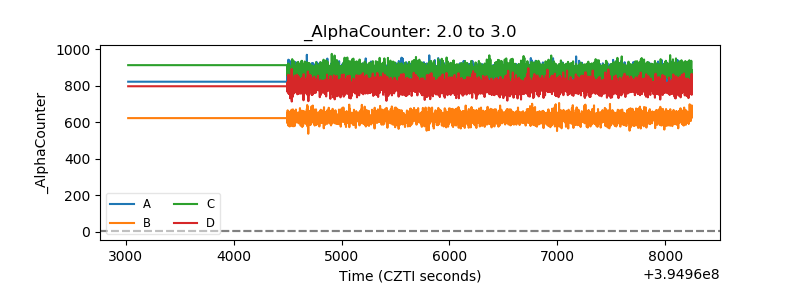 |
| _CPM_Rate | 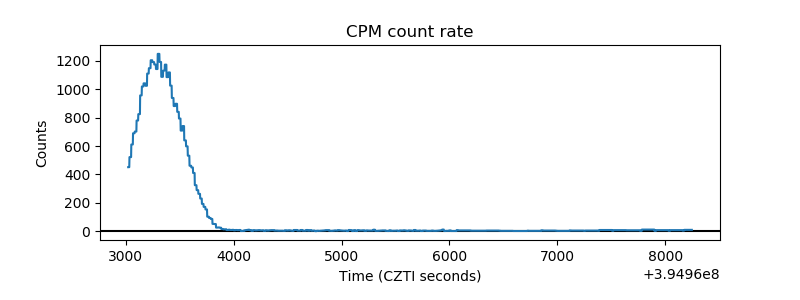 |
| CZT Counter | 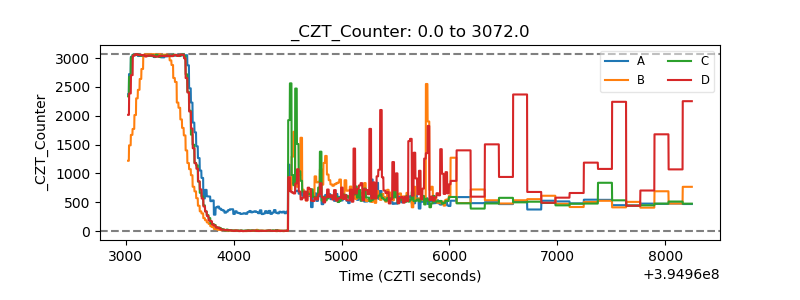 |
| +2.5 Volts monitor |  |
| +5 Volts monitor | 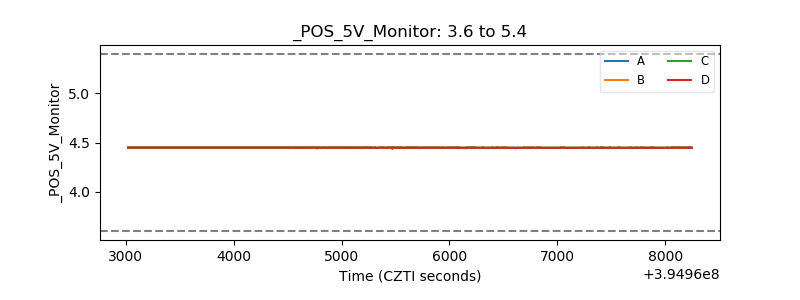 |
| _ROLL_ROT | 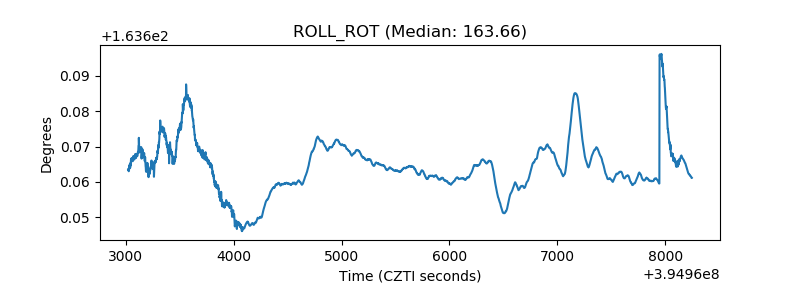 |
| _Roll_DEC | 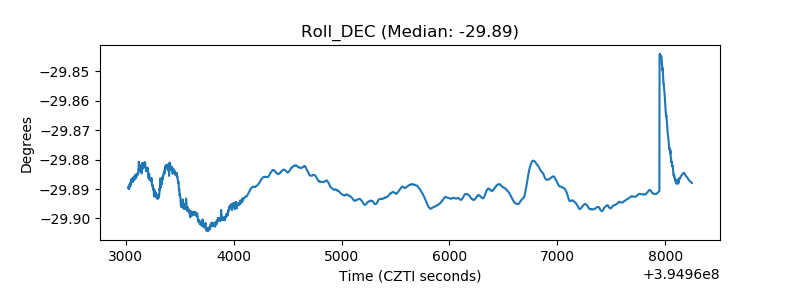 |
| _Roll_RA | 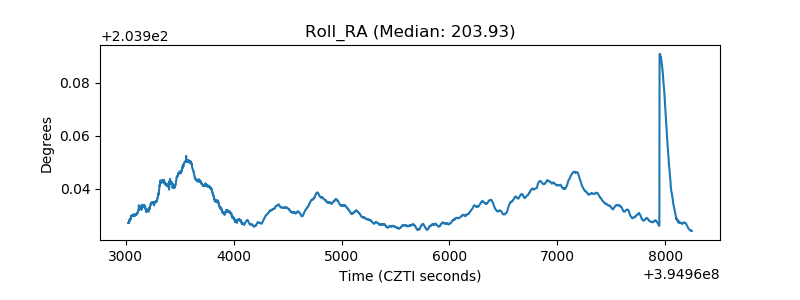 |
| Veto Counter | 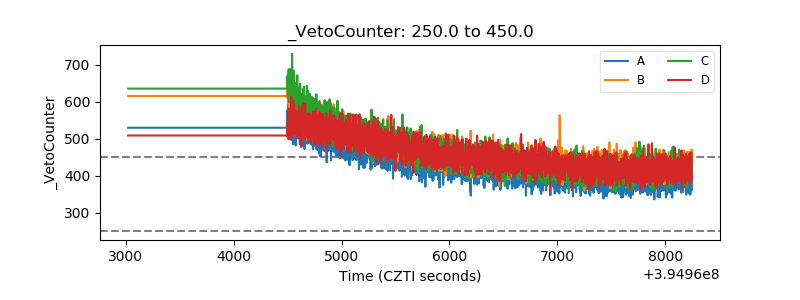 |