| Param | Original file | Final file |
|---|---|---|
| Filename | modeM0/AS1A11_049T04_9000005230_36639cztM0_level2.evt | modeM0/AS1A11_049T04_9000005230_36639cztM0_level2_quad_clean.evt |
| Size (bytes) | 82,296,000 | 17,372,160 |
| Size | 78.5 MB | 16.6 MB |
| Events in quadrant A | 535,121 | 114,921 |
| Events in quadrant B | 508,976 | 117,486 |
| Events in quadrant C | 689,633 | 114,764 |
| Events in quadrant D | 693,326 | 107,116 |
| Mode M0 | |||
|---|---|---|---|
| Quadrant | BADHDUFLAG | Total packets | Discarded packets |
| A | 0 | 2143 | 2 |
| B | 0 | 2002 | 1 |
| C | 0 | 2560 | 1 |
| D | 0 | 2682 | 1 |
| Mode M9 | |||
|---|---|---|---|
| Quadrant | BADHDUFLAG | Total packets | Discarded packets |
| A | 0 | 21 | 0 |
| B | 0 | 21 | 0 |
| C | 0 | 21 | 0 |
| D | 0 | 21 | 0 |
| Mode SS | |||
|---|---|---|---|
| Quadrant | BADHDUFLAG | Total packets | Discarded packets |
| A | 0 | 20 | 0 |
| B | 0 | 20 | 0 |
| C | 0 | 20 | 0 |
| D | 0 | 20 | 0 |
| Quadrant | Total seconds | Saturated seconds | Saturation percentage |
|---|---|---|---|
| A | 915 | 6 | 0.655738% |
| B | 915 | 8 | 0.874317% |
| C | 915 | 85 | 9.289617% |
| D | 915 | 33 | 3.606557% |
Noise dominated data is calculated using 1-second bins in cleaned event files. If a bin has >2000 counts, and if more than 50% of those come from <1% of pixels, then it is considered to be noise-dominated and hence unusable.
| Quadrant | # 1 sec bins | Bins with >0 counts | Bins with >2000 counts | High rate bins dominated by noise | Noise dominated (total time) | Noise dominated (detector-on time) | Marked lightcurve |
|---|---|---|---|---|---|---|---|
| A | 3008 | 916 | 0 | 0 | 0.00% | 0.00% | 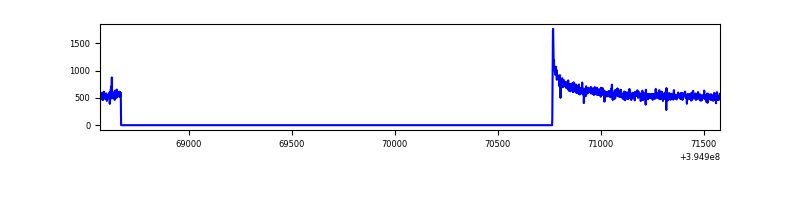 |
| B | 3008 | 916 | 2 | 2 | 0.07% | 0.22% | 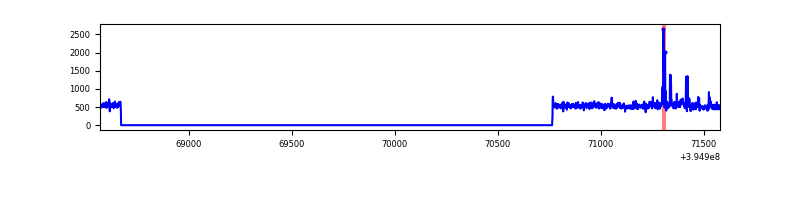 |
| C | 3008 | 916 | 58 | 58 | 1.93% | 6.33% | 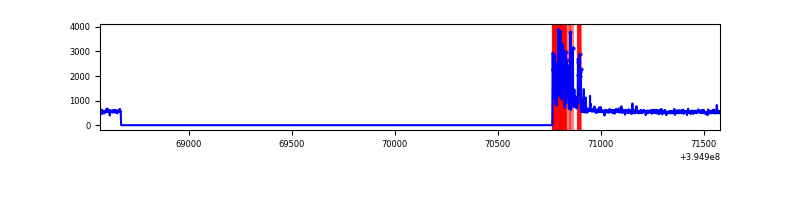 |
| D | 3008 | 916 | 27 | 27 | 0.90% | 2.95% | 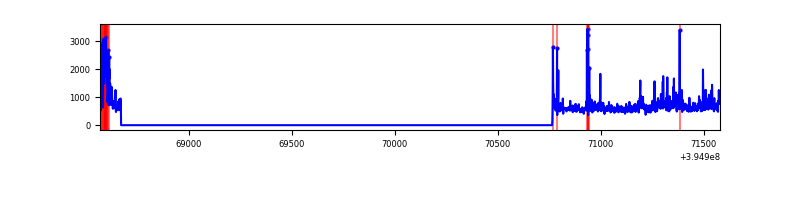 |
Top three noisy pixels from each quadrant. If the there are fewer than three noisy pixels in the level2.evt file, extra rows are filled as -1
| Pixel properties | Quadrant properties | ||||||
|---|---|---|---|---|---|---|---|
| Quadrant | DetID | PixID | Counts | Sigma | Mean | Median | Sigma |
| A | 10 | 83 | 65927 | 2526.97 | 120 | 117 | 26.0 |
| A | 13 | 6 | 2987 | 110.2 | 120 | 117 | 26.0 |
| A | 10 | 67 | 1694 | 60.55 | 120 | 117 | 26.0 |
| B | 5 | 255 | 26968 | 1093.24 | 117 | 114 | 24.6 |
| B | 0 | 213 | 9124 | 366.8 | 117 | 114 | 24.6 |
| B | 12 | 111 | 2775 | 108.33 | 117 | 114 | 24.6 |
| C | 0 | 10 | 206357 | 7581.11 | 112 | 113 | 27.2 |
| C | 15 | 214 | 42722 | 1566.22 | 112 | 113 | 27.2 |
| C | 0 | 207 | 1979 | 68.59 | 112 | 113 | 27.2 |
| D | 12 | 235 | 169798 | 5709.15 | 116 | 112 | 29.7 |
| D | 2 | 153 | 26407 | 884.7 | 116 | 112 | 29.7 |
| D | 2 | 249 | 26214 | 878.21 | 116 | 112 | 29.7 |
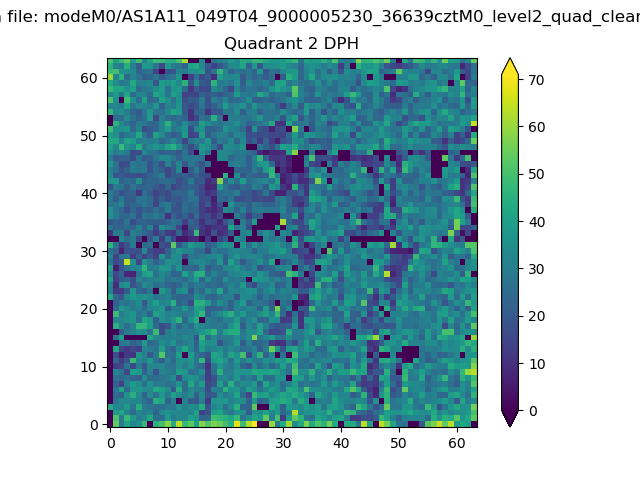
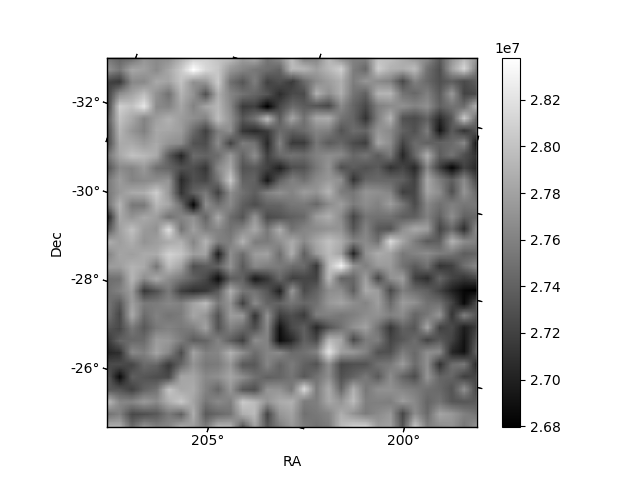
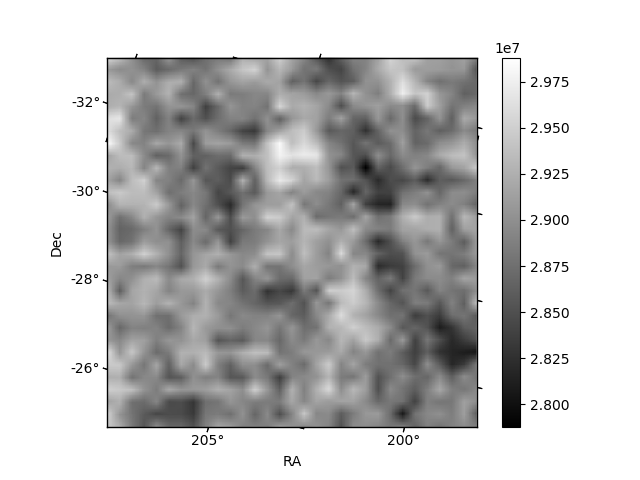
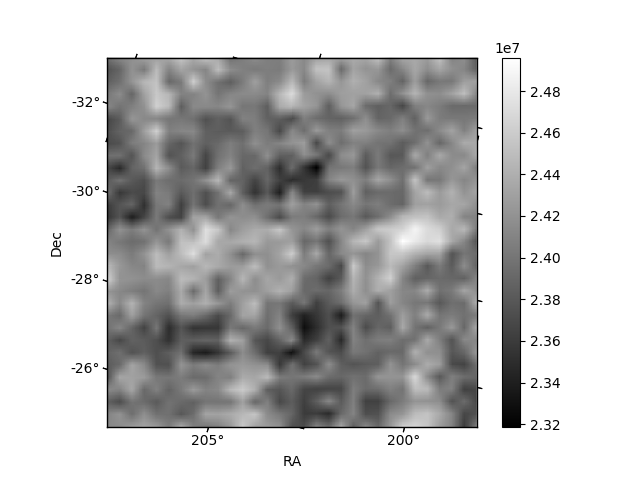
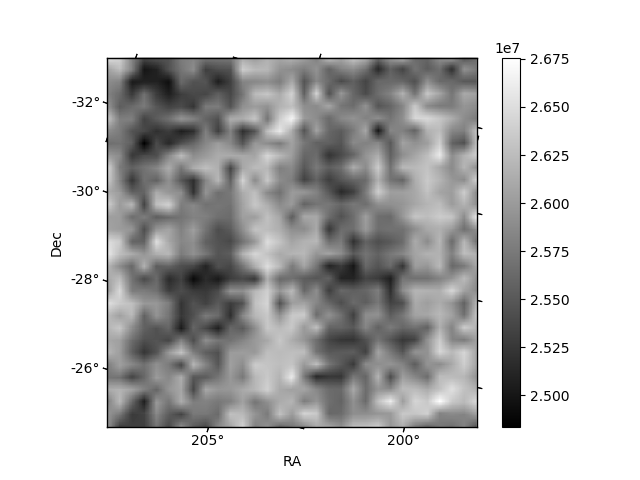
Histogram calculated using DETX and DETY for each event in the final _common_clean file
| Quadrant A |  |
 |
Quadrant B |
|---|---|---|---|
| Quadrant D |  |
 |
Quadrant C |
| Plot type | Count rate plots | Images |
|---|---|---|
| Comparison with Poisson distribution Blue bars denote a histogram of data divided into 1 sec bins. Red curve is a Poisson curve with rate = median count rate of data. |
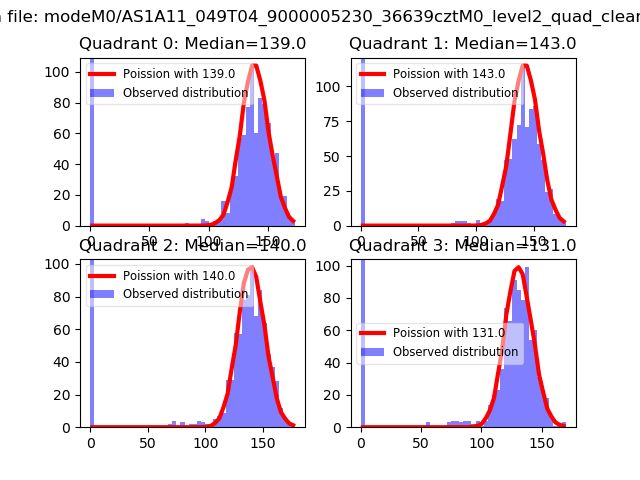 |
 |
| Quadrant-wise count rates Data is divided into 100 sec bins |
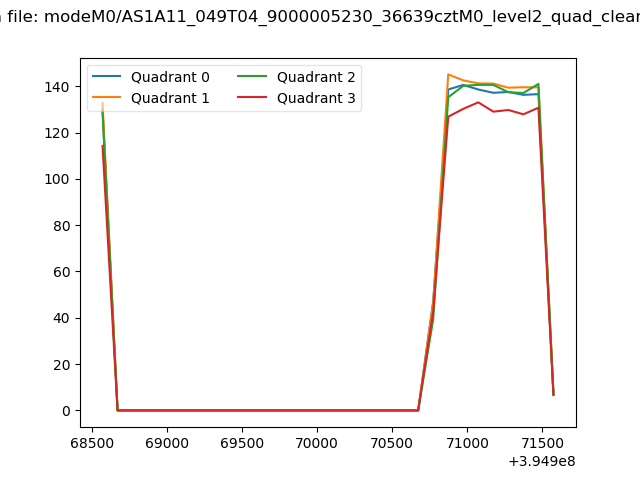 |
|
| Module-wise count rates for Quadrant A Data is divided into 100 sec bins |
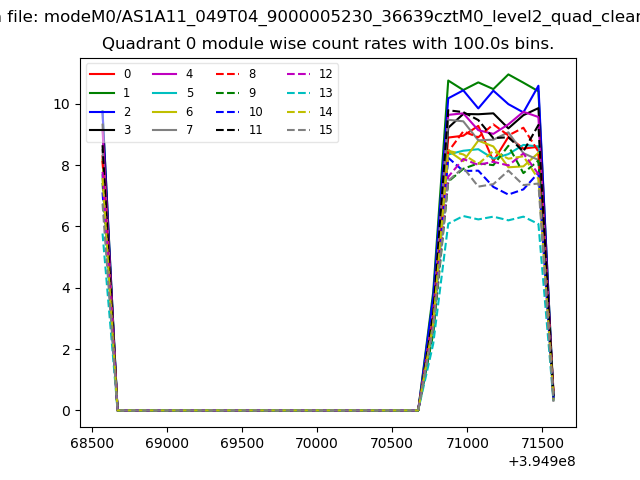 |
 |
| Module-wise count rates for Quadrant B Data is divided into 100 sec bins |
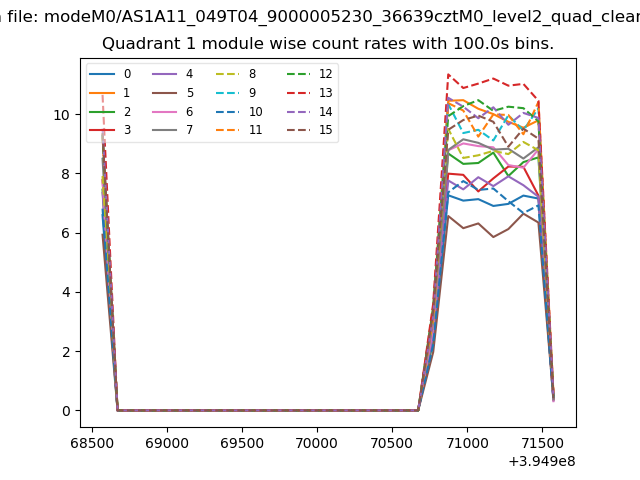 |
 |
| Module-wise count rates for Quadrant C Data is divided into 100 sec bins |
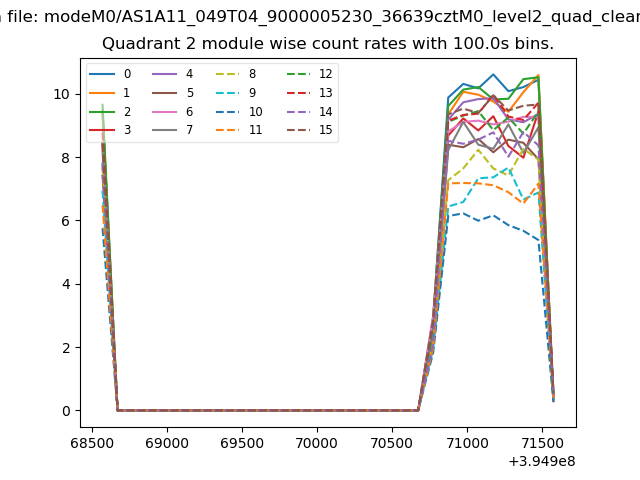 |
 |
| Module-wise count rates for Quadrant D Data is divided into 100 sec bins |
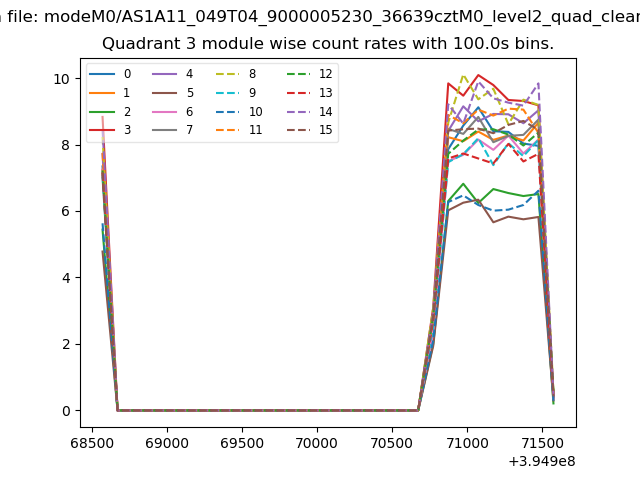 |
 |
| Parameter | Plot |
|---|---|
| CZT HV Monitor | 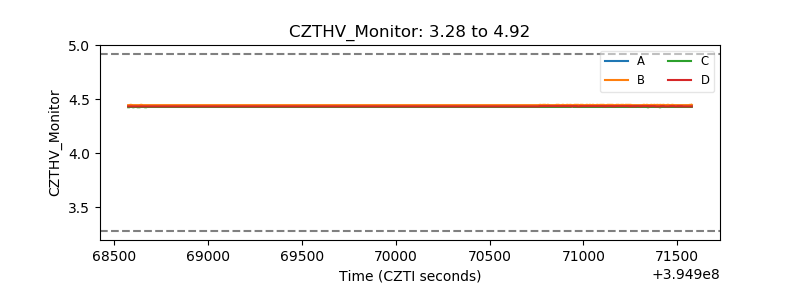 |
| D_VDD |  |
| Temperature 1 | 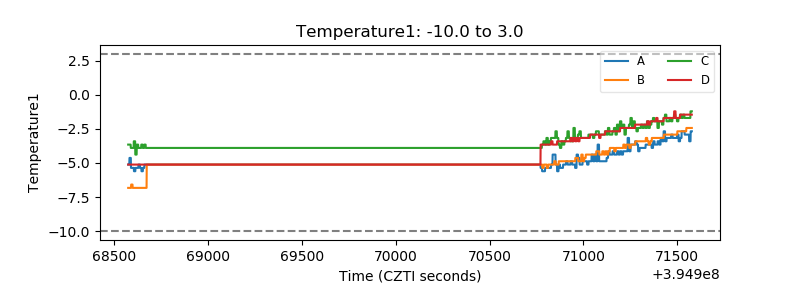 |
| Veto HV Monitor | 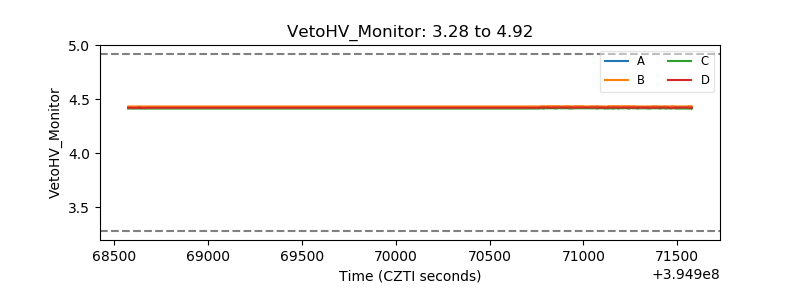 |
| Veto LLD | 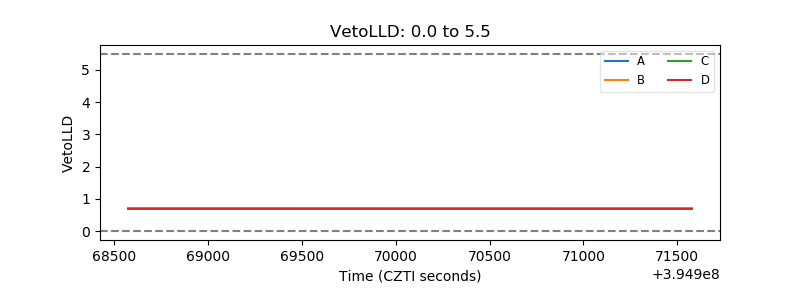 |
| Alpha Counter | 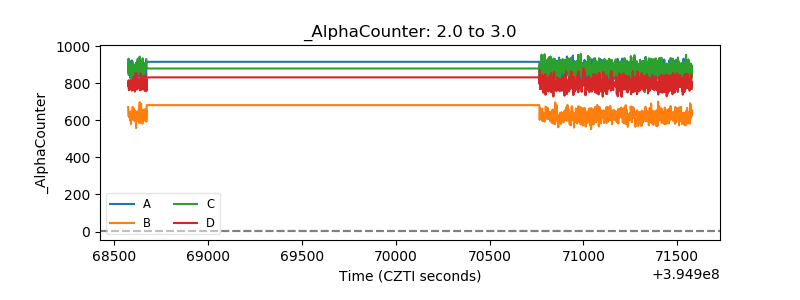 |
| _CPM_Rate | 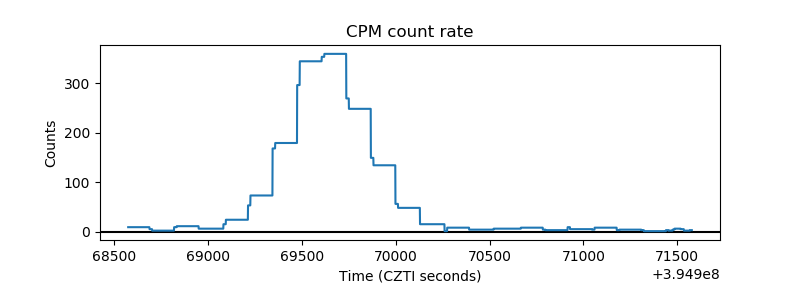 |
| CZT Counter | 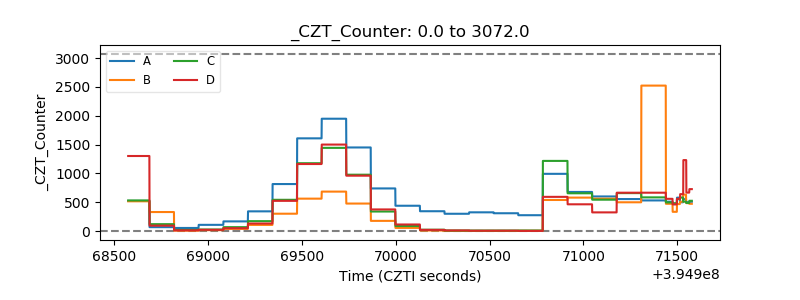 |
| +2.5 Volts monitor |  |
| +5 Volts monitor | 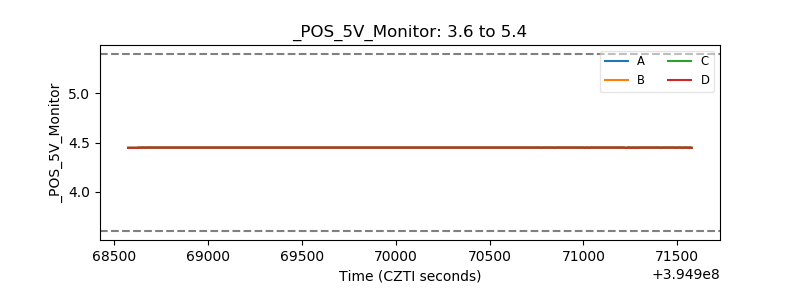 |
| _ROLL_ROT | 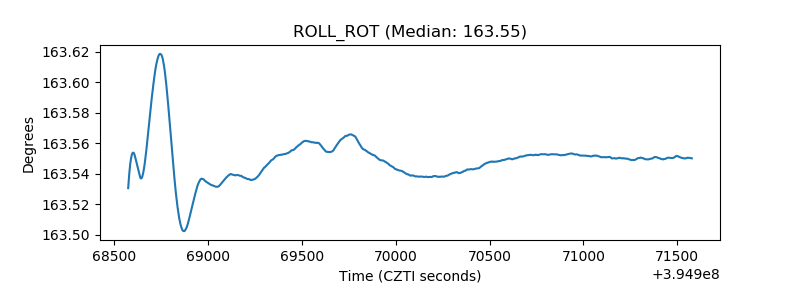 |
| _Roll_DEC | 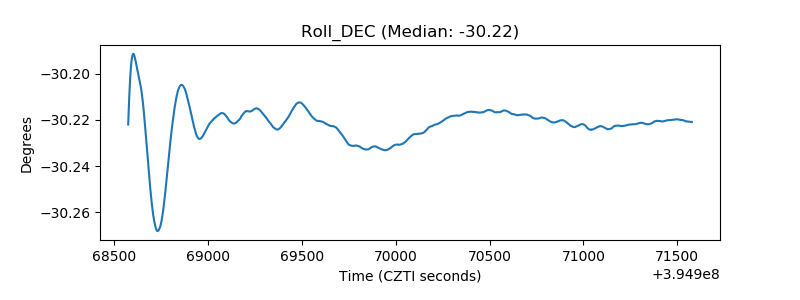 |
| _Roll_RA | 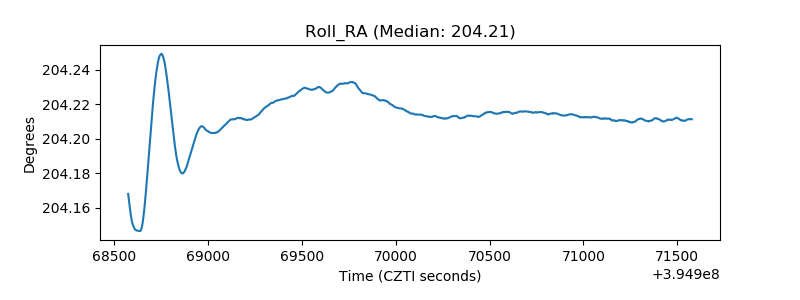 |
| Veto Counter | 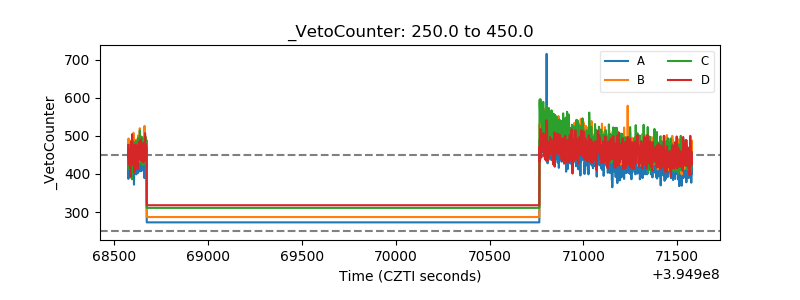 |