| Param | Original file | Final file |
|---|---|---|
| Filename | modeM0/AS1A11_049T04_9000005230_36640cztM0_level2.evt | modeM0/AS1A11_049T04_9000005230_36640cztM0_level2_quad_clean.evt |
| Size (bytes) | 490,458,240 | 88,079,040 |
| Size | 467.7 MB | 84.0 MB |
| Events in quadrant A | 2,573,003 | 598,234 |
| Events in quadrant B | 2,843,450 | 597,510 |
| Events in quadrant C | 2,933,159 | 583,118 |
| Events in quadrant D | 6,160,793 | 533,259 |
| Mode M0 | |||
|---|---|---|---|
| Quadrant | BADHDUFLAG | Total packets | Discarded packets |
| A | 0 | 10710 | 2 |
| B | 0 | 11497 | 1 |
| C | 0 | 11697 | 1 |
| D | 0 | 21858 | 1 |
| Mode M9 | |||
|---|---|---|---|
| Quadrant | BADHDUFLAG | Total packets | Discarded packets |
| A | 0 | 20 | 0 |
| B | 0 | 20 | 0 |
| C | 0 | 20 | 0 |
| D | 0 | 20 | 0 |
| Mode SS | |||
|---|---|---|---|
| Quadrant | BADHDUFLAG | Total packets | Discarded packets |
| A | 0 | 102 | 0 |
| B | 0 | 102 | 0 |
| C | 0 | 102 | 0 |
| D | 0 | 102 | 0 |
| Quadrant | Total seconds | Saturated seconds | Saturation percentage |
|---|---|---|---|
| A | 5071 | 5 | 0.098600% |
| B | 5071 | 46 | 0.907119% |
| C | 5071 | 86 | 1.695918% |
| D | 5071 | 540 | 10.648787% |
Noise dominated data is calculated using 1-second bins in cleaned event files. If a bin has >2000 counts, and if more than 50% of those come from <1% of pixels, then it is considered to be noise-dominated and hence unusable.
| Quadrant | # 1 sec bins | Bins with >0 counts | Bins with >2000 counts | High rate bins dominated by noise | Noise dominated (total time) | Noise dominated (detector-on time) | Marked lightcurve |
|---|---|---|---|---|---|---|---|
| A | 7014 | 5072 | 0 | 0 | 0.00% | 0.00% | 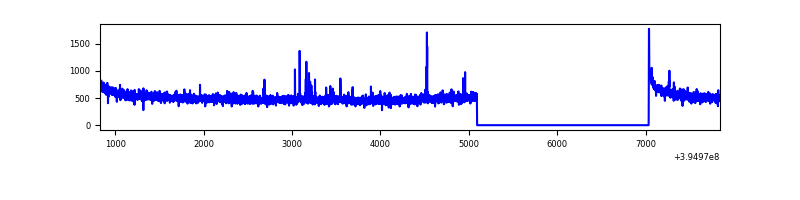 |
| B | 7014 | 5072 | 18 | 18 | 0.26% | 0.35% | 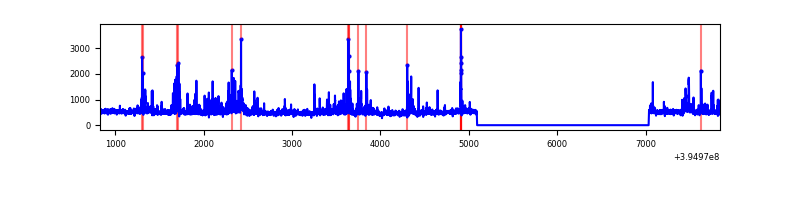 |
| C | 7014 | 5072 | 67 | 67 | 0.96% | 1.32% | 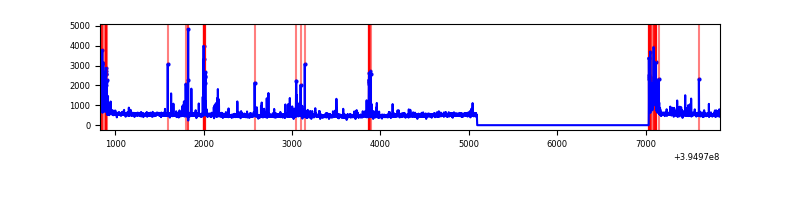 |
| D | 7014 | 5072 | 560 | 560 | 7.98% | 11.04% | 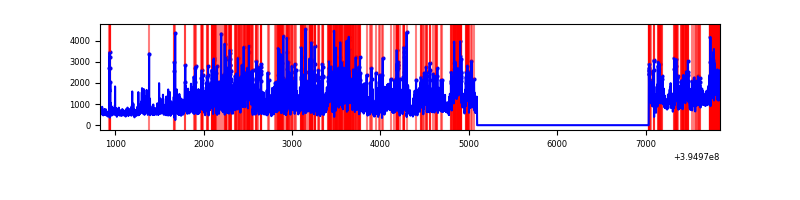 |
Top three noisy pixels from each quadrant. If the there are fewer than three noisy pixels in the level2.evt file, extra rows are filled as -1
| Pixel properties | Quadrant properties | ||||||
|---|---|---|---|---|---|---|---|
| Quadrant | DetID | PixID | Counts | Sigma | Mean | Median | Sigma |
| A | 10 | 83 | 179485 | 1464.54 | 610 | 599 | 122.1 |
| A | 9 | 143 | 14478 | 113.63 | 610 | 599 | 122.1 |
| A | 15 | 223 | 13277 | 103.8 | 610 | 599 | 122.1 |
| B | 5 | 255 | 238838 | 2084.14 | 597 | 583 | 114.3 |
| B | 0 | 190 | 72271 | 627.09 | 597 | 583 | 114.3 |
| B | 5 | 172 | 36265 | 312.13 | 597 | 583 | 114.3 |
| C | 0 | 10 | 315076 | 2353.95 | 580 | 585 | 133.6 |
| C | 15 | 214 | 218743 | 1632.91 | 580 | 585 | 133.6 |
| C | 14 | 254 | 112475 | 837.49 | 580 | 585 | 133.6 |
| D | 12 | 235 | 3213196 | 23061.79 | 571 | 557 | 139.3 |
| D | 2 | 250 | 195453 | 1399.05 | 571 | 557 | 139.3 |
| D | 13 | 171 | 99487 | 710.16 | 571 | 557 | 139.3 |
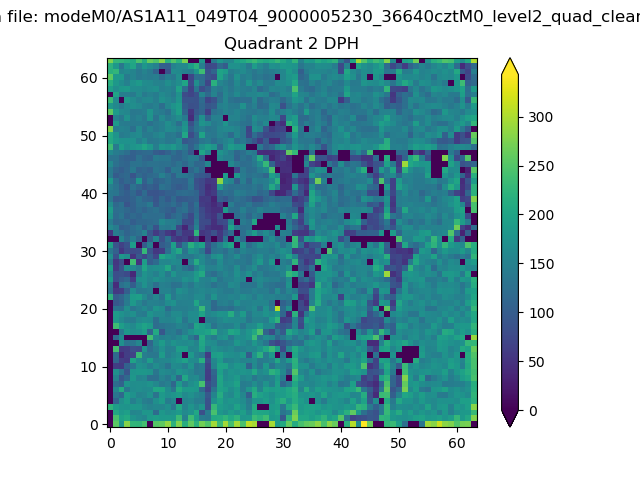
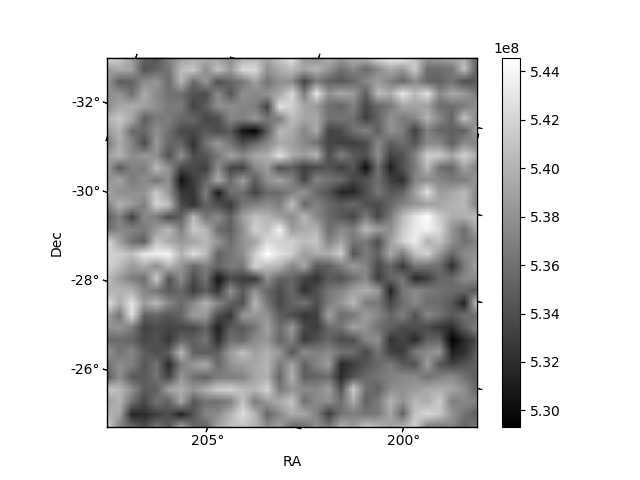
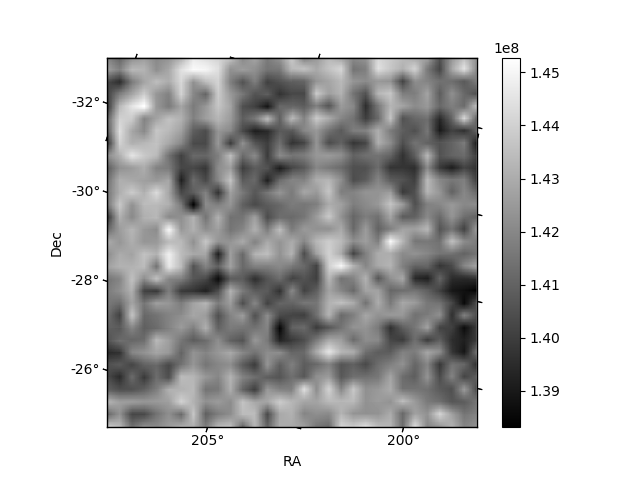
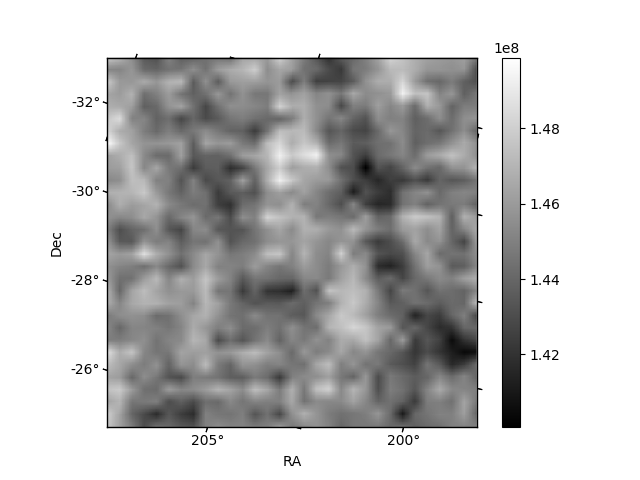
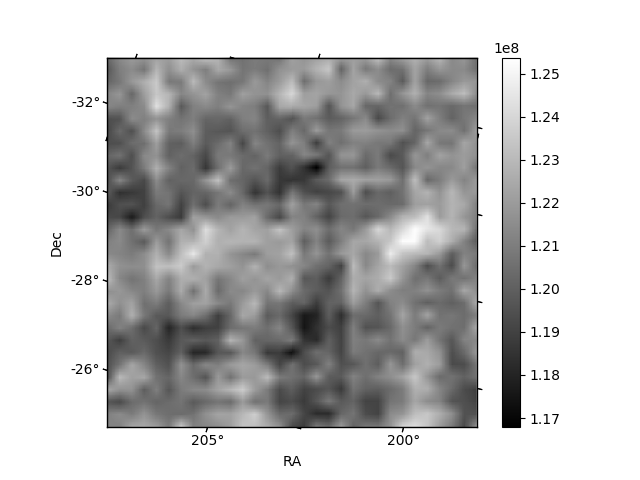
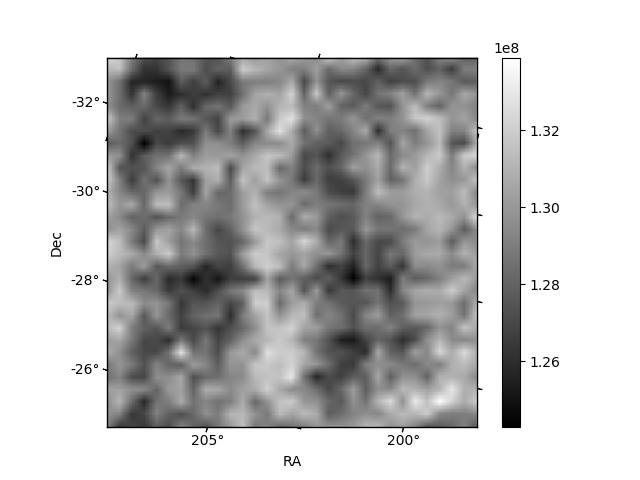
Histogram calculated using DETX and DETY for each event in the final _common_clean file
| Quadrant A | 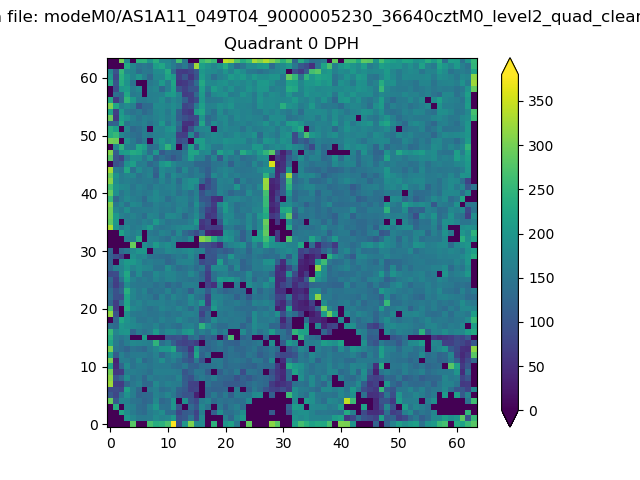 |
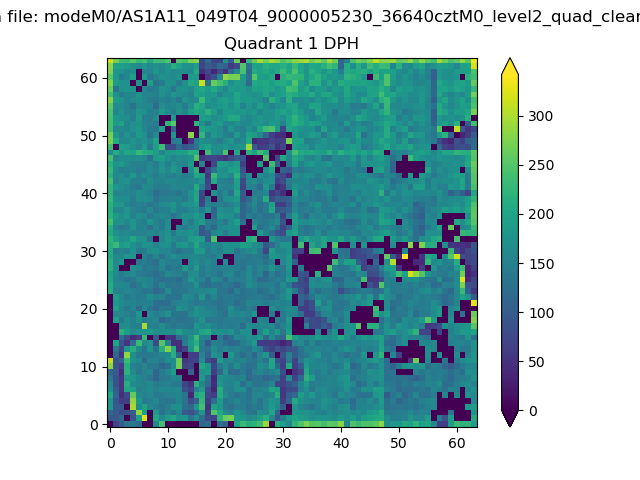 |
Quadrant B |
|---|---|---|---|
| Quadrant D | 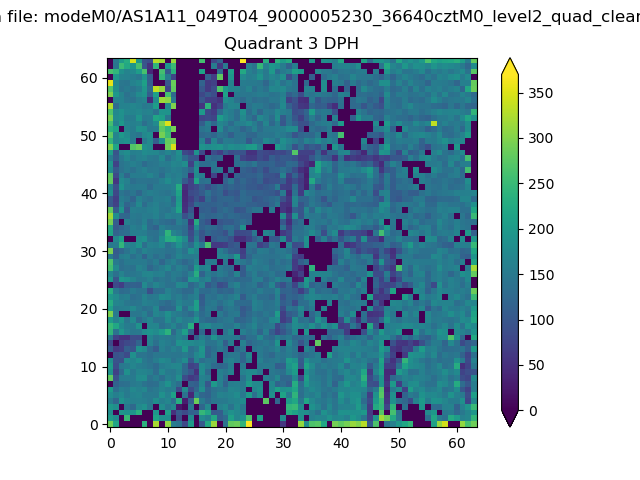 |
 |
Quadrant C |
| Plot type | Count rate plots | Images |
|---|---|---|
| Comparison with Poisson distribution Blue bars denote a histogram of data divided into 1 sec bins. Red curve is a Poisson curve with rate = median count rate of data. |
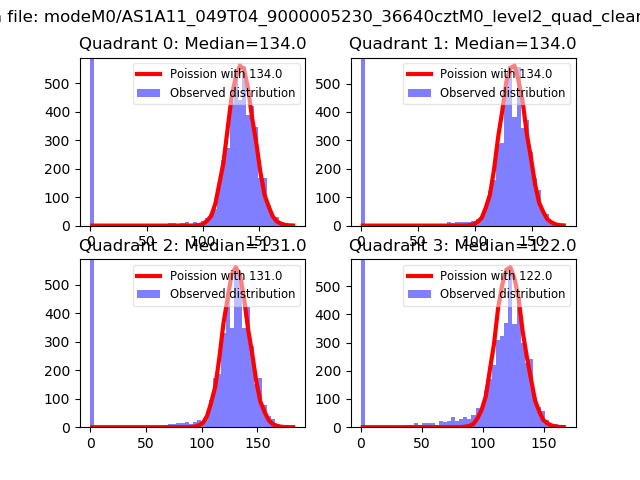 |
 |
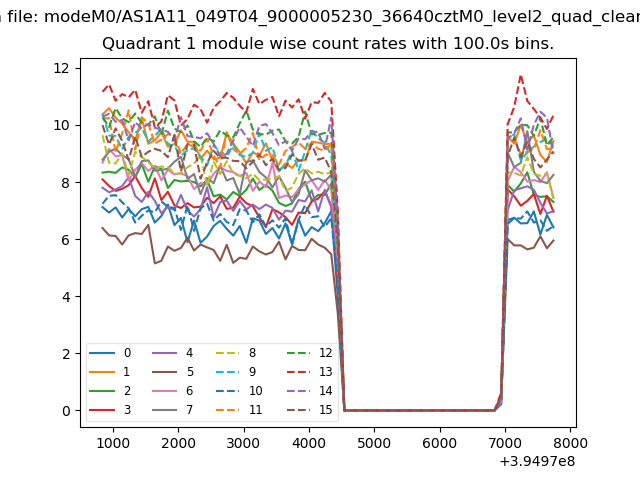
| Quadrant-wise count rates Data is divided into 100 sec bins |
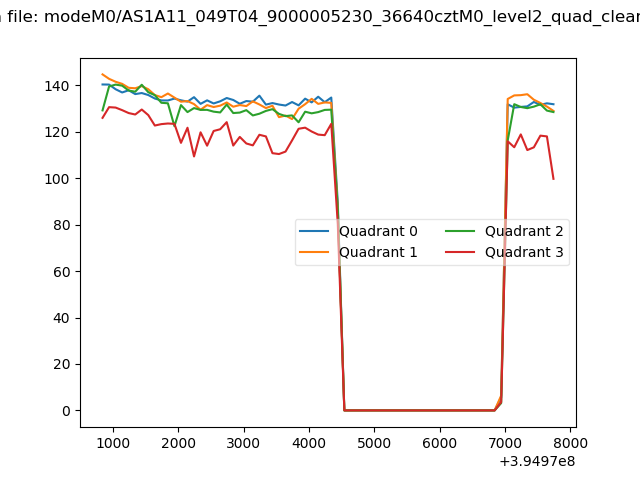 |
|
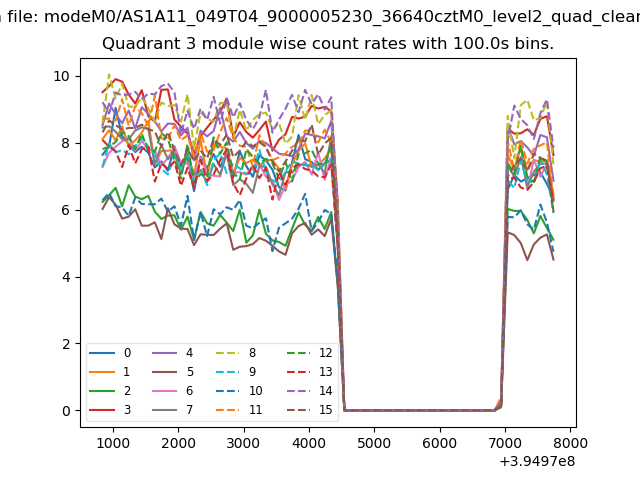
| Module-wise count rates for Quadrant A Data is divided into 100 sec bins |
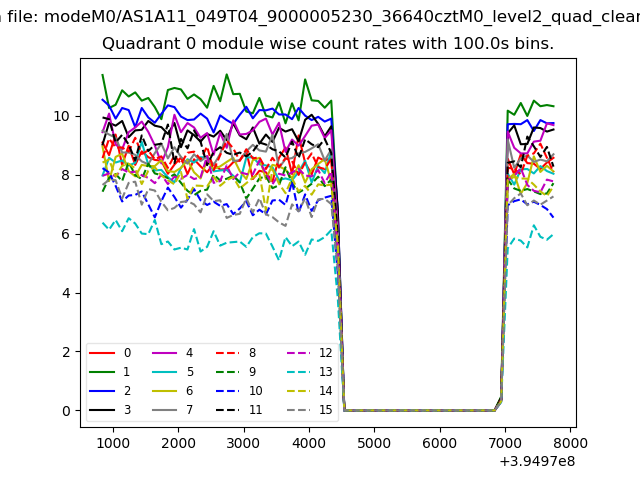 |
 |
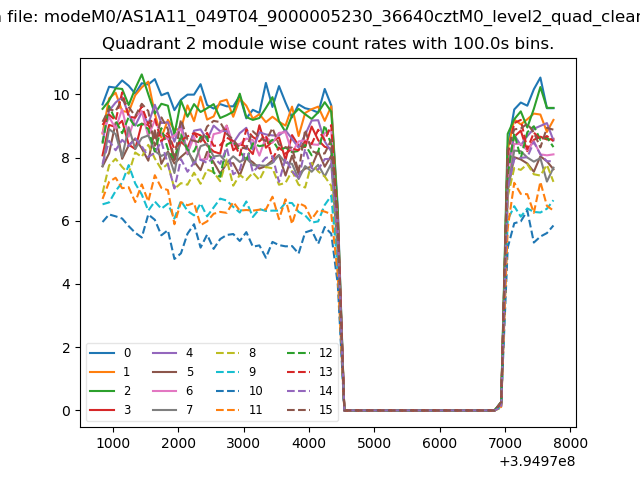
| Module-wise count rates for Quadrant B Data is divided into 100 sec bins |
 |
 |
| Module-wise count rates for Quadrant C Data is divided into 100 sec bins |
 |
 |
| Module-wise count rates for Quadrant D Data is divided into 100 sec bins |
 |
 |
| Parameter | Plot |
|---|---|
| CZT HV Monitor | 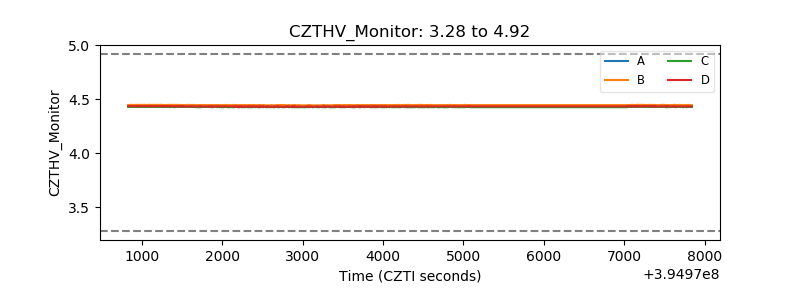 |
| D_VDD | 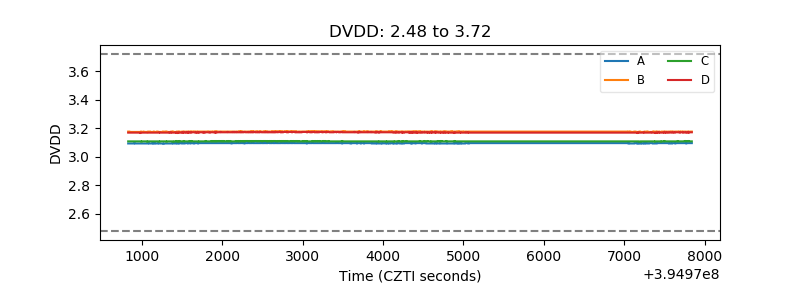 |
| Temperature 1 | 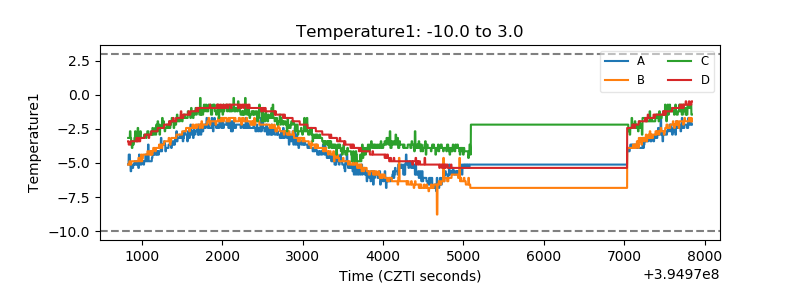 |
| Veto HV Monitor | 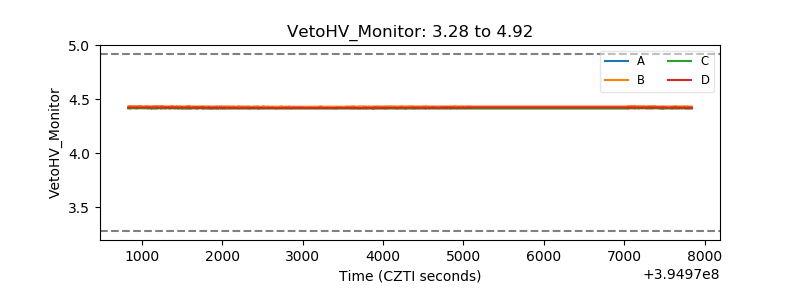 |
| Veto LLD | 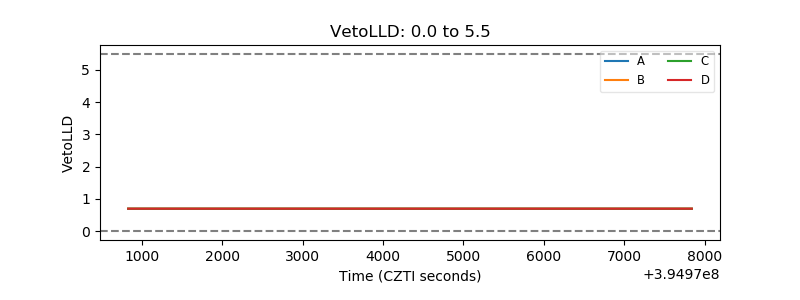 |
| Alpha Counter | 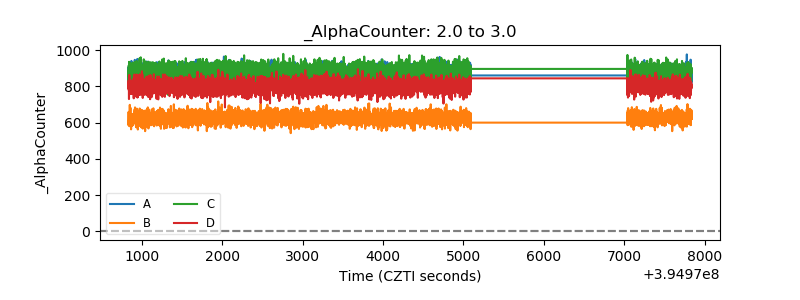 |
| _CPM_Rate | 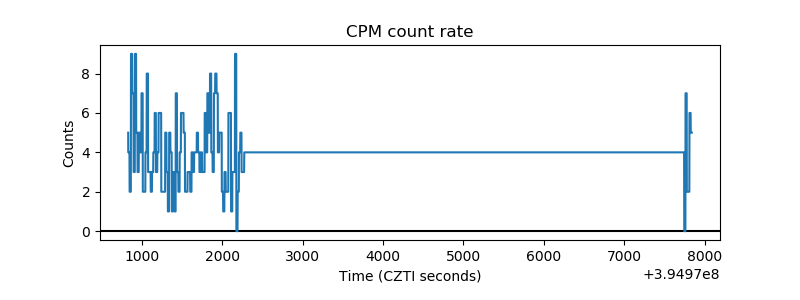 |
| CZT Counter | 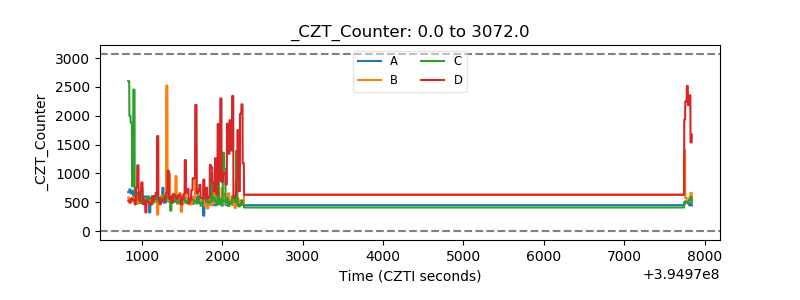 |
| +2.5 Volts monitor |  |
| +5 Volts monitor |  |
| _ROLL_ROT | 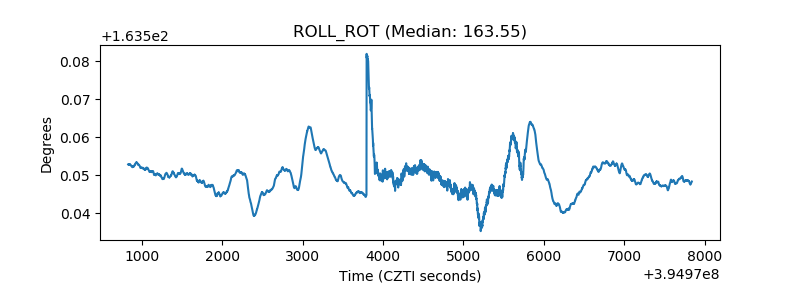 |
| _Roll_DEC |  |
| _Roll_RA | 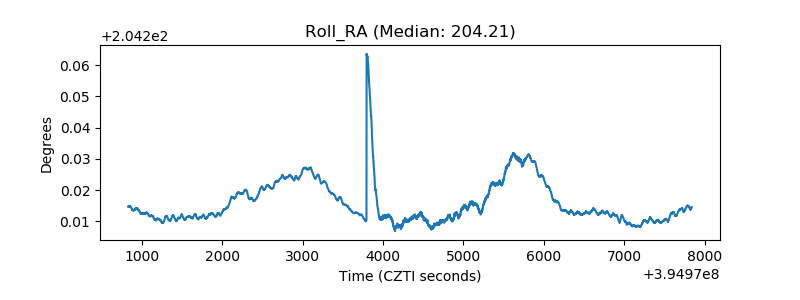 |
| Veto Counter | 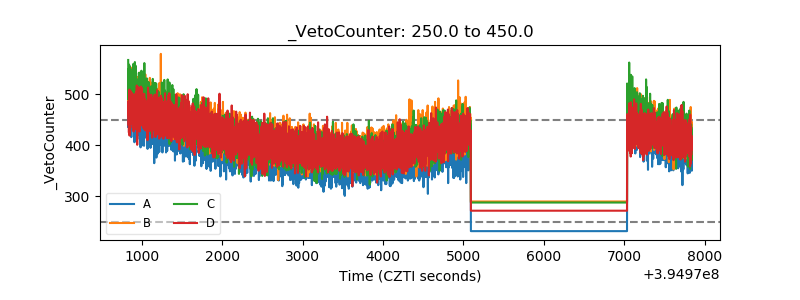 |