| Param | Original file | Final file |
|---|---|---|
| Filename | modeM0/AS1A11_049T04_9000005230_36641cztM0_level2.evt | modeM0/AS1A11_049T04_9000005230_36641cztM0_level2_quad_clean.evt |
| Size (bytes) | 625,429,440 | 83,632,320 |
| Size | 596.5 MB | 79.8 MB |
| Events in quadrant A | 2,853,341 | 566,596 |
| Events in quadrant B | 3,068,431 | 561,785 |
| Events in quadrant C | 3,286,361 | 543,440 |
| Events in quadrant D | 9,345,161 | 458,827 |
| Mode M0 | |||
|---|---|---|---|
| Quadrant | BADHDUFLAG | Total packets | Discarded packets |
| A | 0 | 12049 | 3 |
| B | 0 | 12687 | 2 |
| C | 0 | 13221 | 2 |
| D | 0 | 31765 | 2 |
| Mode M9 | |||
|---|---|---|---|
| Quadrant | BADHDUFLAG | Total packets | Discarded packets |
| A | 0 | 16 | 0 |
| B | 0 | 16 | 0 |
| C | 0 | 16 | 0 |
| D | 0 | 17 | 0 |
| Mode SS | |||
|---|---|---|---|
| Quadrant | BADHDUFLAG | Total packets | Discarded packets |
| A | 0 | 116 | 0 |
| B | 0 | 116 | 0 |
| C | 0 | 116 | 0 |
| D | 0 | 116 | 0 |
| Quadrant | Total seconds | Saturated seconds | Saturation percentage |
|---|---|---|---|
| A | 5740 | 7 | 0.121951% |
| B | 5740 | 35 | 0.609756% |
| C | 5740 | 158 | 2.752613% |
| D | 5740 | 1597 | 27.822300% |
Noise dominated data is calculated using 1-second bins in cleaned event files. If a bin has >2000 counts, and if more than 50% of those come from <1% of pixels, then it is considered to be noise-dominated and hence unusable.
| Quadrant | # 1 sec bins | Bins with >0 counts | Bins with >2000 counts | High rate bins dominated by noise | Noise dominated (total time) | Noise dominated (detector-on time) | Marked lightcurve |
|---|---|---|---|---|---|---|---|
| A | 7353 | 5741 | 0 | 0 | 0.00% | 0.00% |  |
| B | 7353 | 5741 | 23 | 23 | 0.31% | 0.40% |  |
| C | 7353 | 5741 | 119 | 119 | 1.62% | 2.07% |  |
| D | 7353 | 5741 | 1570 | 1570 | 21.35% | 27.35% |  |
Top three noisy pixels from each quadrant. If the there are fewer than three noisy pixels in the level2.evt file, extra rows are filled as -1
| Pixel properties | Quadrant properties | ||||||
|---|---|---|---|---|---|---|---|
| Quadrant | DetID | PixID | Counts | Sigma | Mean | Median | Sigma |
| A | 10 | 83 | 221490 | 1625.14 | 674 | 661 | 135.9 |
| A | 13 | 254 | 9136 | 62.37 | 674 | 661 | 135.9 |
| A | 9 | 143 | 8766 | 59.65 | 674 | 661 | 135.9 |
| B | 0 | 190 | 237006 | 1839.69 | 663 | 646 | 128.5 |
| B | 5 | 255 | 114248 | 884.21 | 663 | 646 | 128.5 |
| B | 0 | 219 | 24004 | 181.81 | 663 | 646 | 128.5 |
| C | 0 | 10 | 408588 | 2757.95 | 636 | 640 | 147.9 |
| C | 15 | 214 | 242565 | 1635.55 | 636 | 640 | 147.9 |
| C | 14 | 254 | 74811 | 501.44 | 636 | 640 | 147.9 |
| D | 12 | 235 | 6191012 | 41520.1 | 603 | 587 | 149.1 |
| D | 2 | 250 | 181311 | 1212.14 | 603 | 587 | 149.1 |
| D | 12 | 17 | 144866 | 967.7 | 603 | 587 | 149.1 |
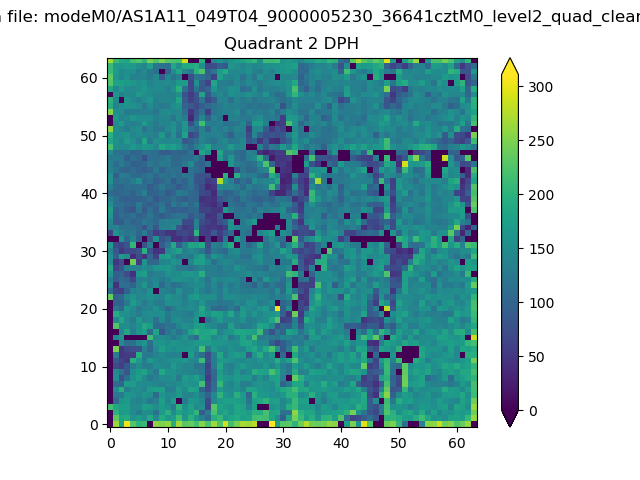
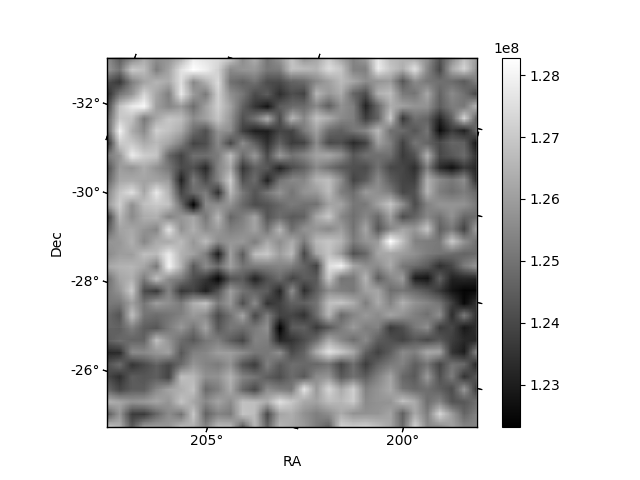
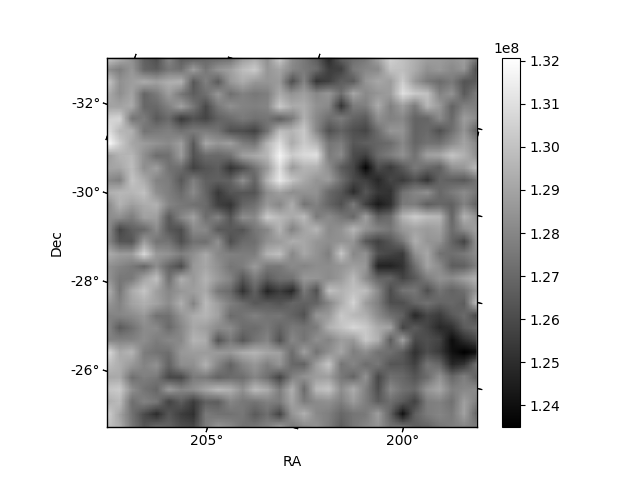
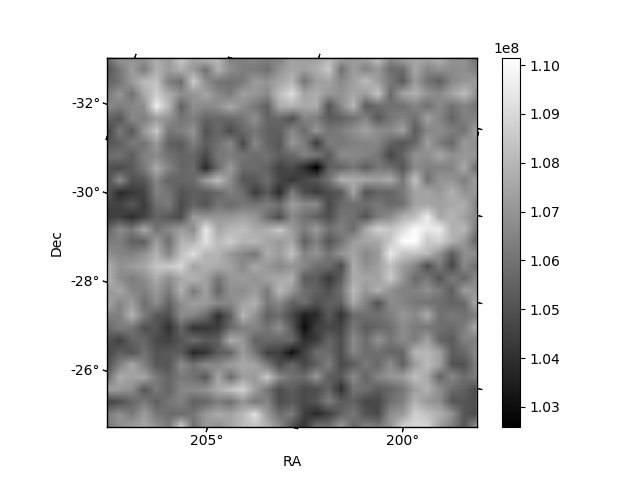
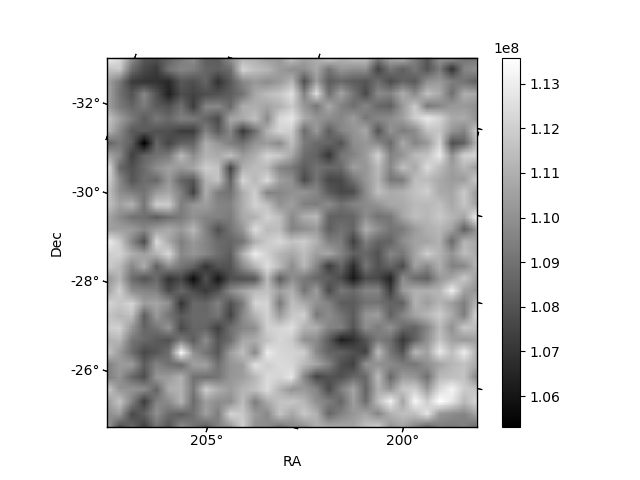
Histogram calculated using DETX and DETY for each event in the final _common_clean file
| Quadrant A | 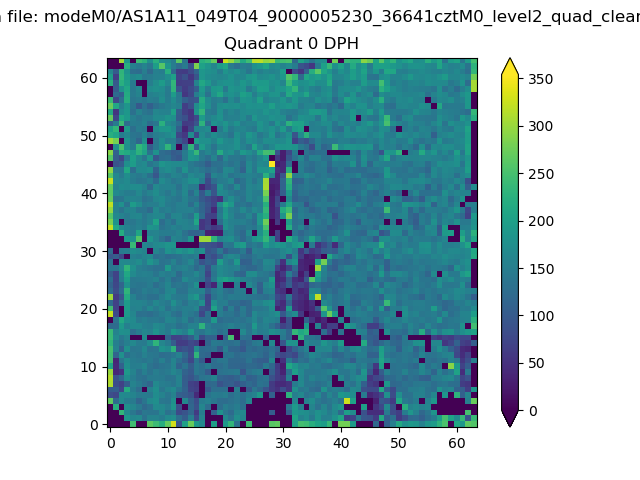 |
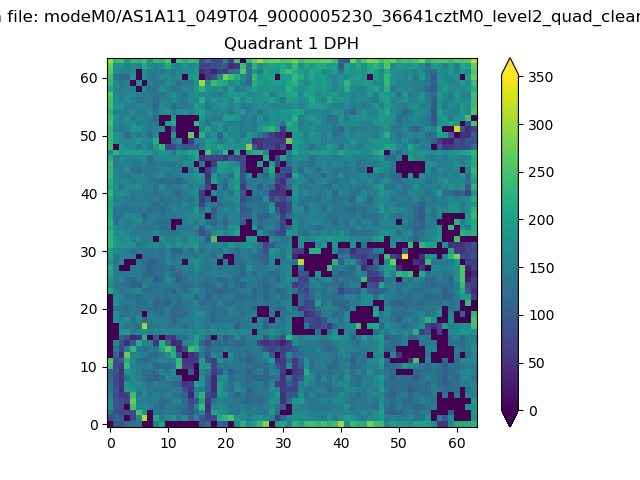 |
Quadrant B |
|---|---|---|---|
| Quadrant D | 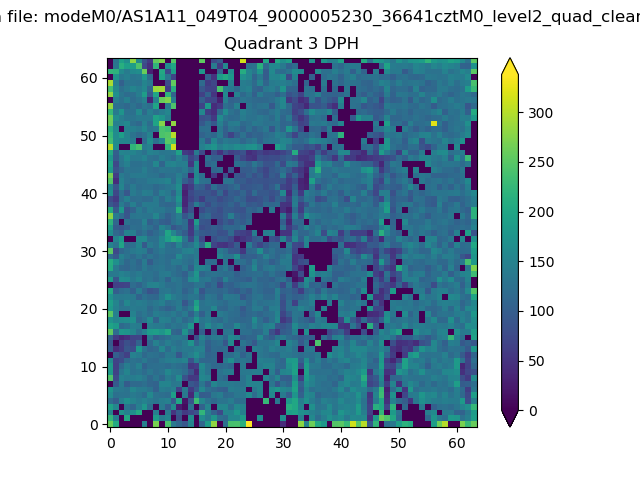 |
 |
Quadrant C |
| Plot type | Count rate plots | Images |
|---|---|---|
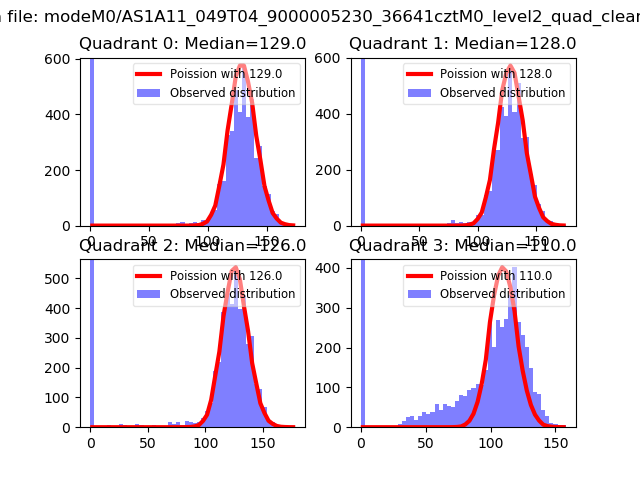
| Comparison with Poisson distribution Blue bars denote a histogram of data divided into 1 sec bins. Red curve is a Poisson curve with rate = median count rate of data. |
 |
 |
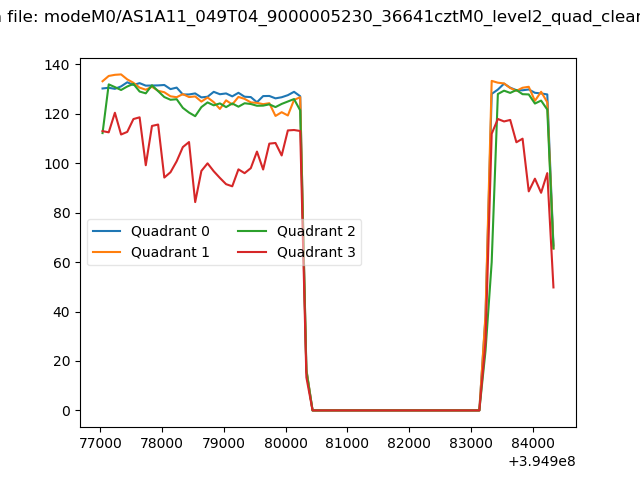
| Quadrant-wise count rates Data is divided into 100 sec bins |
 |
|
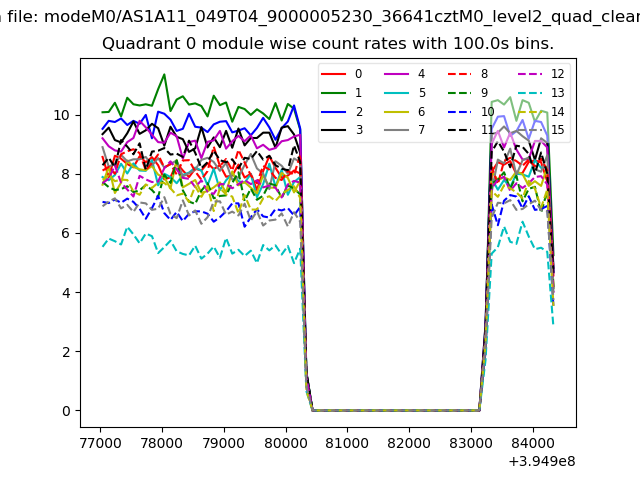
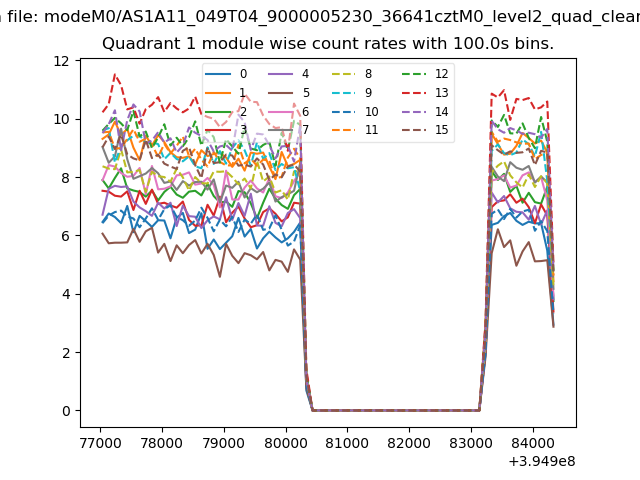
| Module-wise count rates for Quadrant A Data is divided into 100 sec bins |
 |
 |
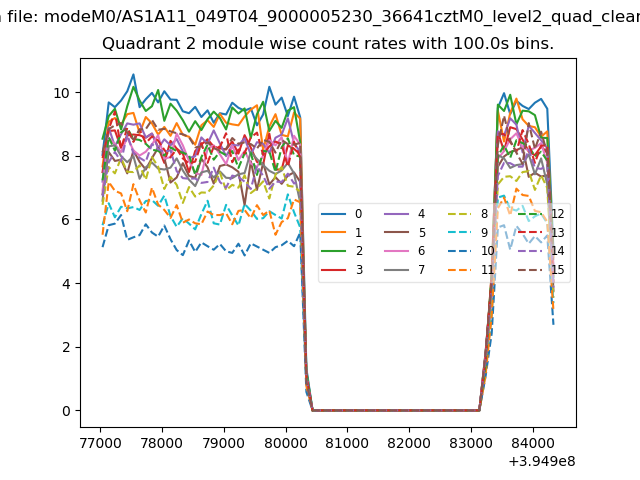
| Module-wise count rates for Quadrant B Data is divided into 100 sec bins |
 |
 |
| Module-wise count rates for Quadrant C Data is divided into 100 sec bins |
 |
 |
| Module-wise count rates for Quadrant D Data is divided into 100 sec bins |
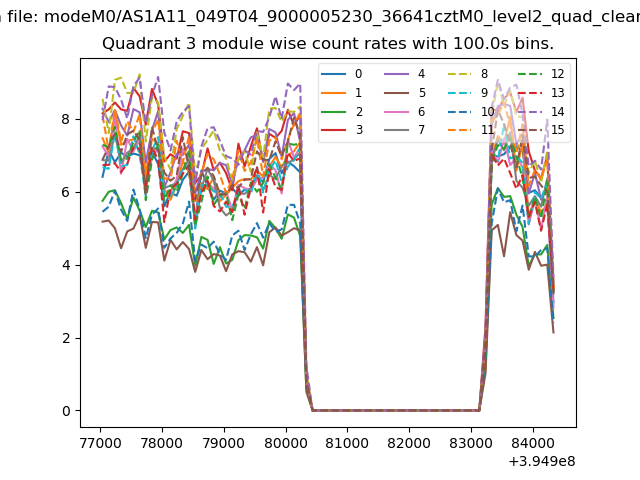 |
 |
| Parameter | Plot |
|---|---|
| CZT HV Monitor | 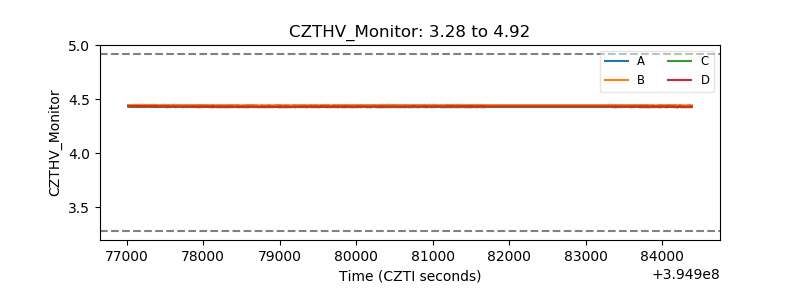 |
| D_VDD | 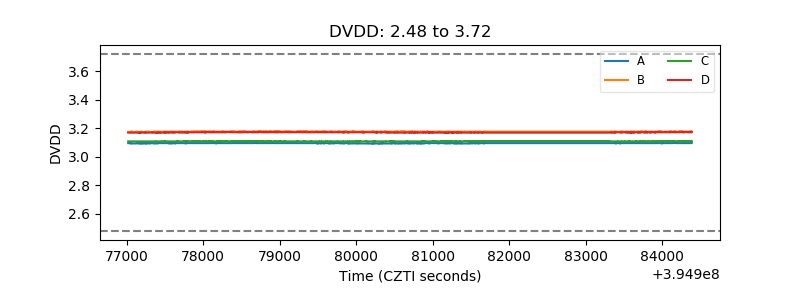 |
| Temperature 1 | 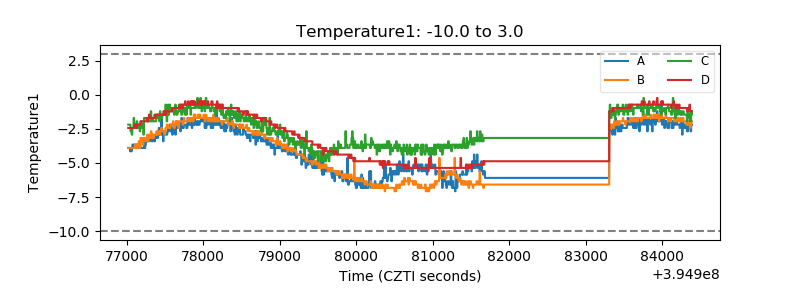 |
| Veto HV Monitor | 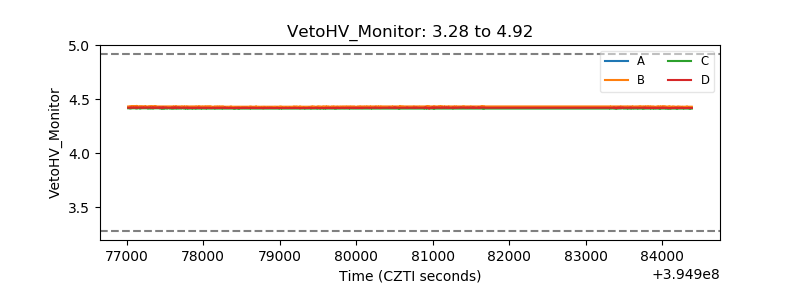 |
| Veto LLD | 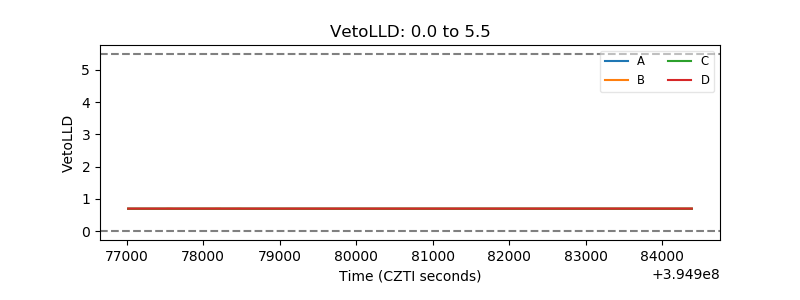 |
| Alpha Counter |  |
| _CPM_Rate | 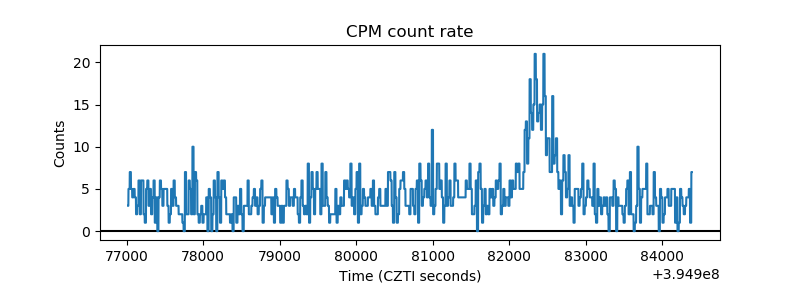 |
| CZT Counter | 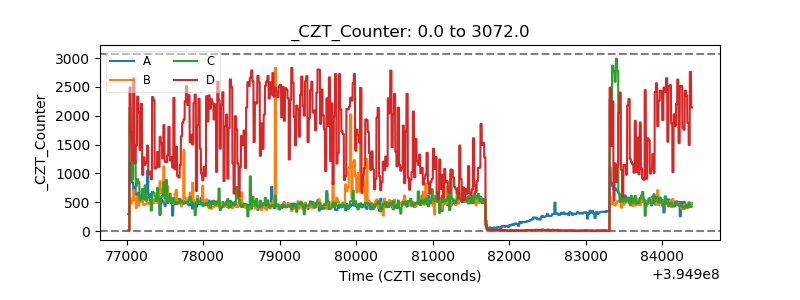 |
| +2.5 Volts monitor |  |
| +5 Volts monitor |  |
| _ROLL_ROT | 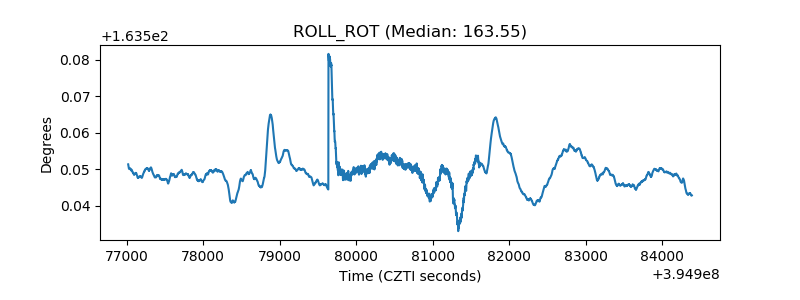 |
| _Roll_DEC | 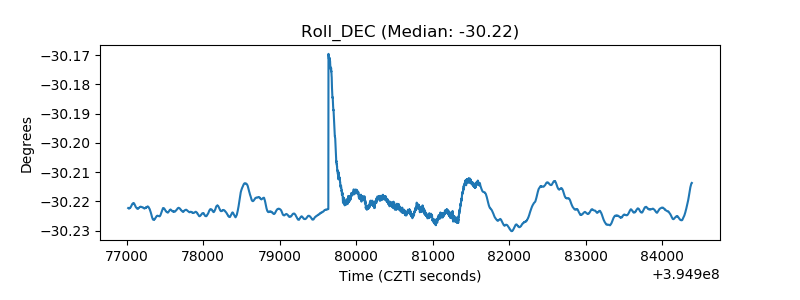 |
| _Roll_RA | 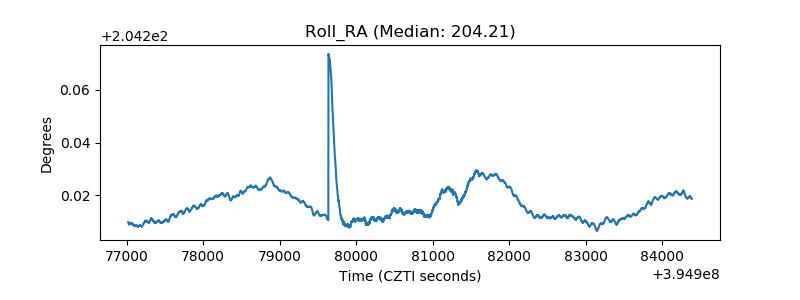 |
| Veto Counter | 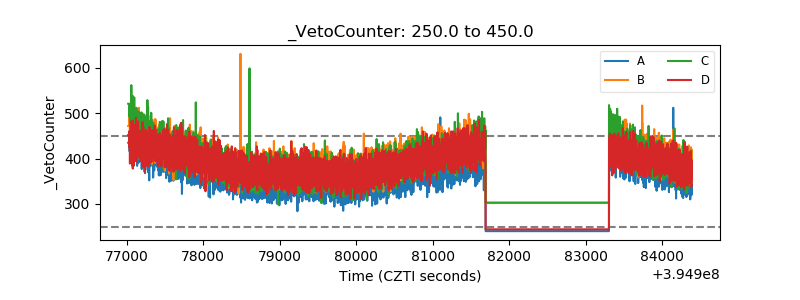 |