| Param | Original file | Final file |
|---|---|---|
| Filename | modeM0/AS1A11_049T04_9000005230_36642cztM0_level2.evt | modeM0/AS1A11_049T04_9000005230_36642cztM0_level2_quad_clean.evt |
| Size (bytes) | 502,073,280 | 71,311,680 |
| Size | 478.8 MB | 68.0 MB |
| Events in quadrant A | 2,748,332 | 463,410 |
| Events in quadrant B | 2,873,084 | 455,975 |
| Events in quadrant C | 2,965,350 | 445,767 |
| Events in quadrant D | 6,234,812 | 398,135 |
| Mode M0 | |||
|---|---|---|---|
| Quadrant | BADHDUFLAG | Total packets | Discarded packets |
| A | 0 | 11671 | 2 |
| B | 0 | 12142 | 1 |
| C | 0 | 12316 | 1 |
| D | 0 | 22329 | 1 |
| Mode M9 | |||
|---|---|---|---|
| Quadrant | BADHDUFLAG | Total packets | Discarded packets |
| A | 0 | 14 | 0 |
| B | 0 | 14 | 0 |
| C | 0 | 14 | 0 |
| D | 0 | 14 | 0 |
| Mode SS | |||
|---|---|---|---|
| Quadrant | BADHDUFLAG | Total packets | Discarded packets |
| A | 0 | 114 | 0 |
| B | 0 | 114 | 0 |
| C | 0 | 114 | 0 |
| D | 0 | 114 | 0 |
| Quadrant | Total seconds | Saturated seconds | Saturation percentage |
|---|---|---|---|
| A | 5663 | 10 | 0.176585% |
| B | 5663 | 19 | 0.335511% |
| C | 5663 | 65 | 1.147802% |
| D | 5663 | 813 | 14.356348% |
Noise dominated data is calculated using 1-second bins in cleaned event files. If a bin has >2000 counts, and if more than 50% of those come from <1% of pixels, then it is considered to be noise-dominated and hence unusable.
| Quadrant | # 1 sec bins | Bins with >0 counts | Bins with >2000 counts | High rate bins dominated by noise | Noise dominated (total time) | Noise dominated (detector-on time) | Marked lightcurve |
|---|---|---|---|---|---|---|---|
| A | 7035 | 5664 | 1 | 1 | 0.01% | 0.02% | 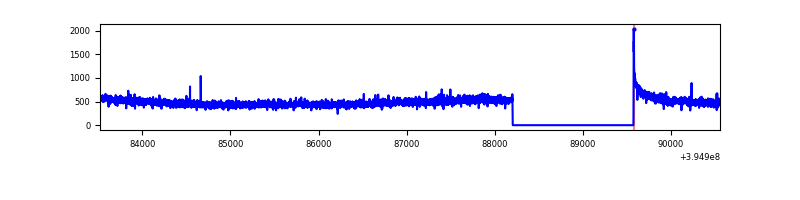 |
| B | 7035 | 5664 | 6 | 6 | 0.09% | 0.11% | 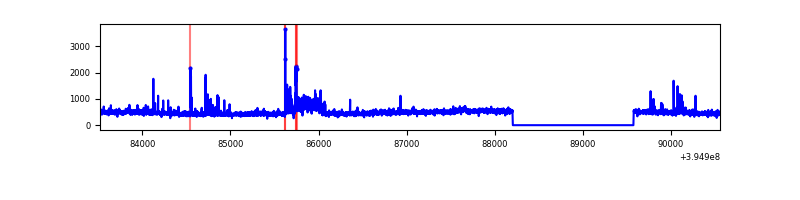 |
| C | 7035 | 5664 | 43 | 43 | 0.61% | 0.76% | 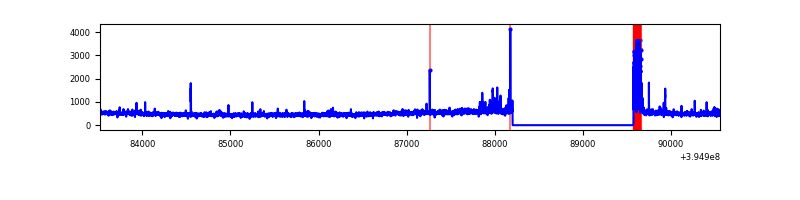 |
| D | 7035 | 5664 | 815 | 815 | 11.58% | 14.39% | 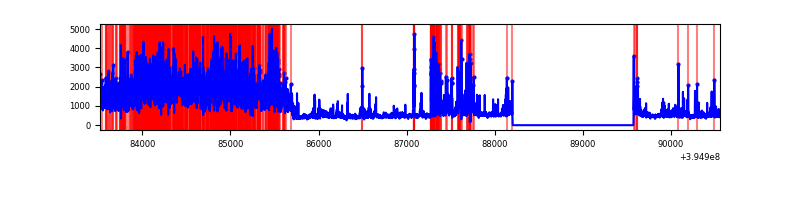 |
Top three noisy pixels from each quadrant. If the there are fewer than three noisy pixels in the level2.evt file, extra rows are filled as -1
| Pixel properties | Quadrant properties | ||||||
|---|---|---|---|---|---|---|---|
| Quadrant | DetID | PixID | Counts | Sigma | Mean | Median | Sigma |
| A | 10 | 83 | 182979 | 1366.96 | 660 | 647 | 133.4 |
| A | 13 | 6 | 10075 | 70.68 | 660 | 647 | 133.4 |
| A | 13 | 254 | 9358 | 65.31 | 660 | 647 | 133.4 |
| B | 0 | 190 | 114985 | 904.76 | 652 | 635 | 126.4 |
| B | 5 | 255 | 71797 | 563.05 | 652 | 635 | 126.4 |
| B | 0 | 229 | 46190 | 360.44 | 652 | 635 | 126.4 |
| C | 15 | 214 | 236194 | 1604.5 | 629 | 634 | 146.8 |
| C | 0 | 10 | 215019 | 1460.26 | 629 | 634 | 146.8 |
| C | 14 | 254 | 39059 | 261.73 | 629 | 634 | 146.8 |
| D | 12 | 235 | 2957680 | 19766.65 | 609 | 592 | 149.6 |
| D | 12 | 6 | 388505 | 2593.0 | 609 | 592 | 149.6 |
| D | 2 | 250 | 135199 | 899.78 | 609 | 592 | 149.6 |
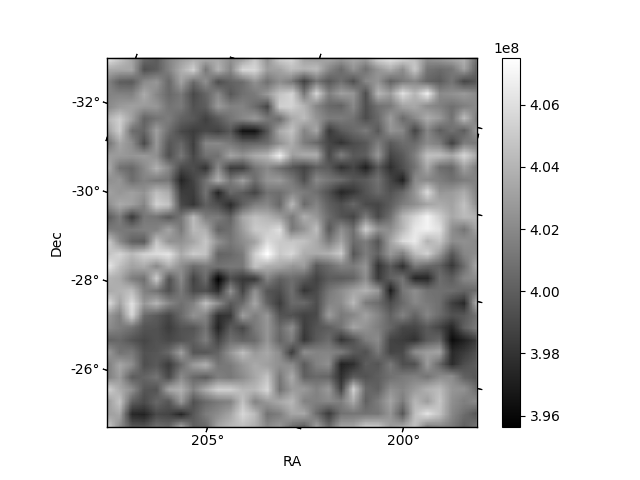
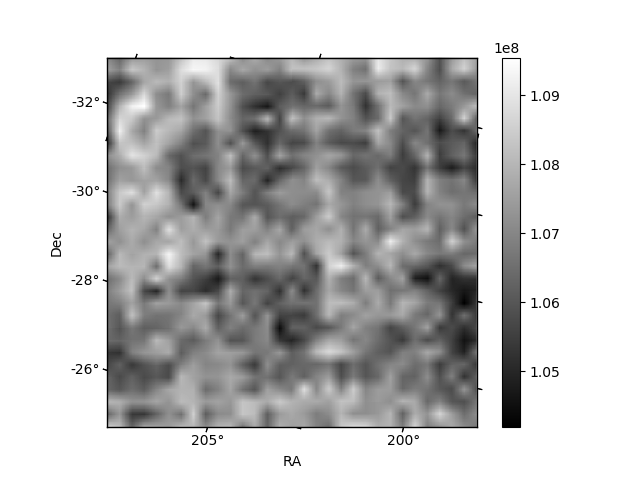
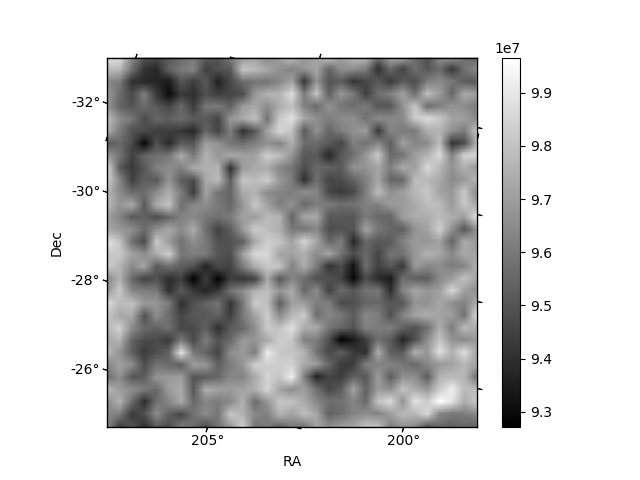
Histogram calculated using DETX and DETY for each event in the final _common_clean file
| Quadrant A | 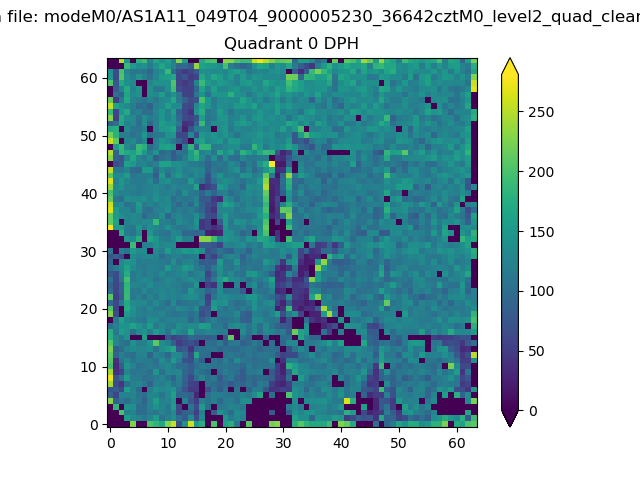 |
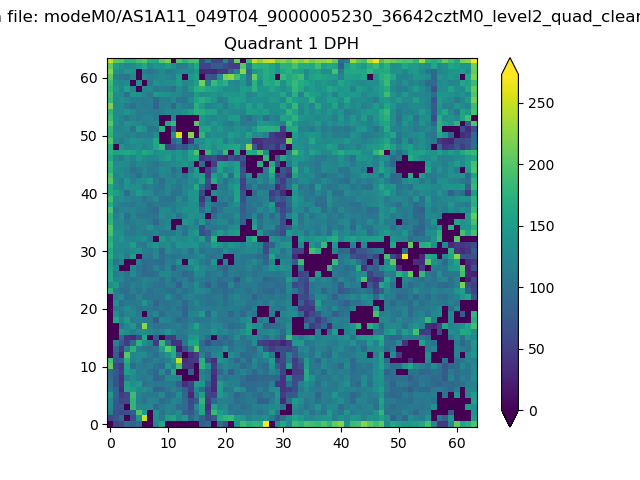 |
Quadrant B |
|---|---|---|---|
| Quadrant D |  |
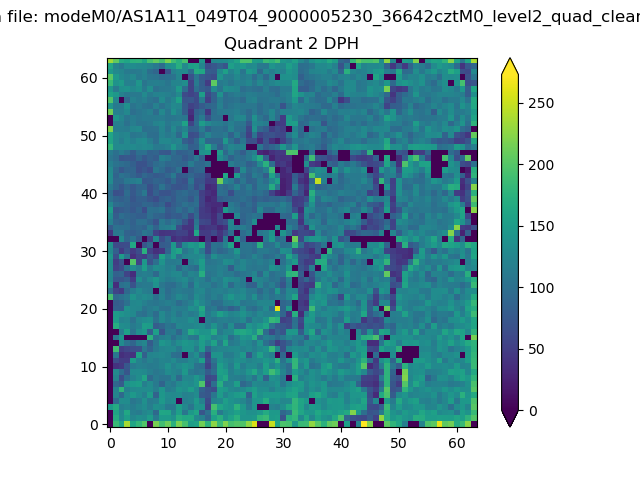 |
Quadrant C |
| Plot type | Count rate plots | Images |
|---|---|---|
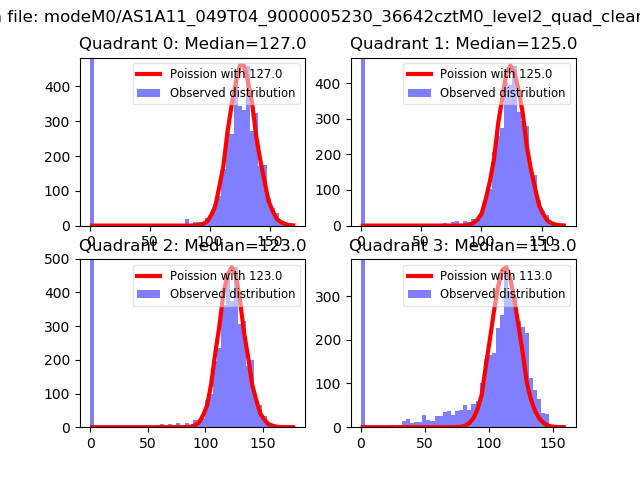
| Comparison with Poisson distribution Blue bars denote a histogram of data divided into 1 sec bins. Red curve is a Poisson curve with rate = median count rate of data. |
 |
 |
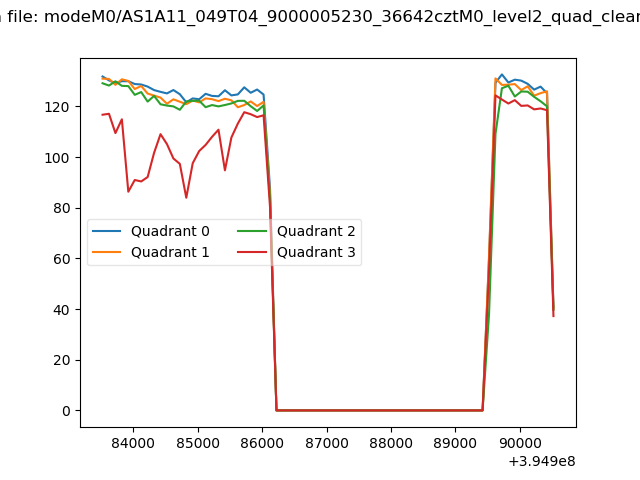
| Quadrant-wise count rates Data is divided into 100 sec bins |
 |
|
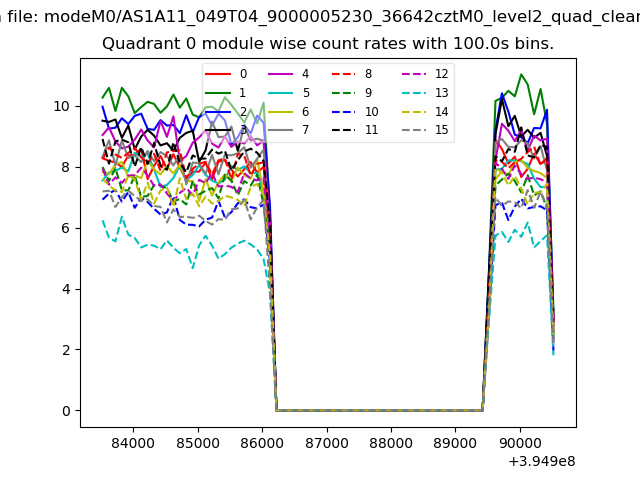
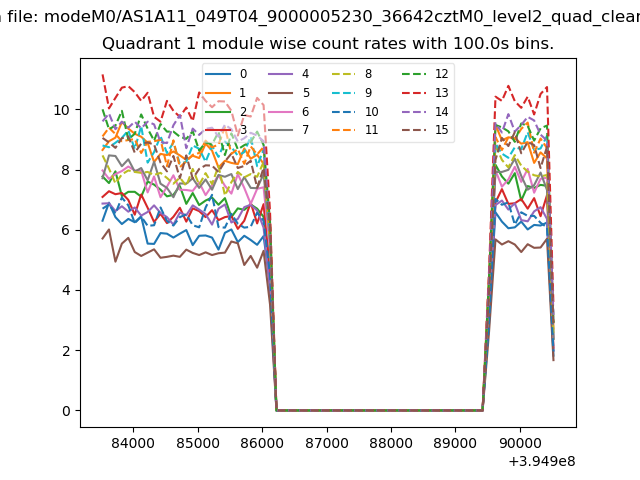
| Module-wise count rates for Quadrant A Data is divided into 100 sec bins |
 |
 |
| Module-wise count rates for Quadrant B Data is divided into 100 sec bins |
 |
 |
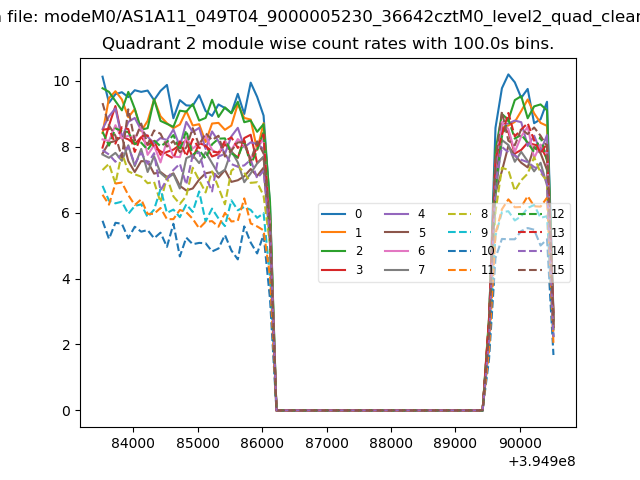
| Module-wise count rates for Quadrant C Data is divided into 100 sec bins |
 |
 |
| Module-wise count rates for Quadrant D Data is divided into 100 sec bins |
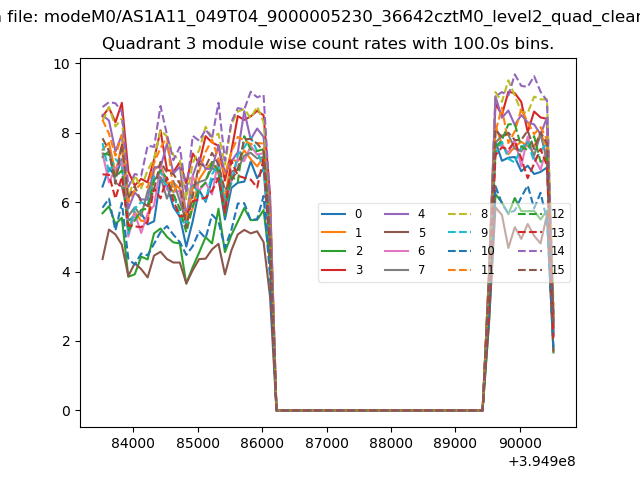 |
 |
| Parameter | Plot |
|---|---|
| CZT HV Monitor | 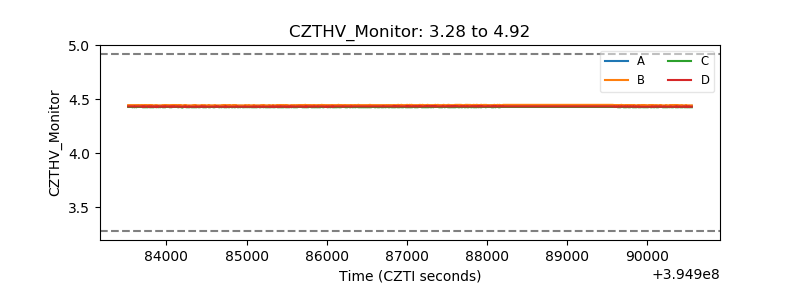 |
| D_VDD | 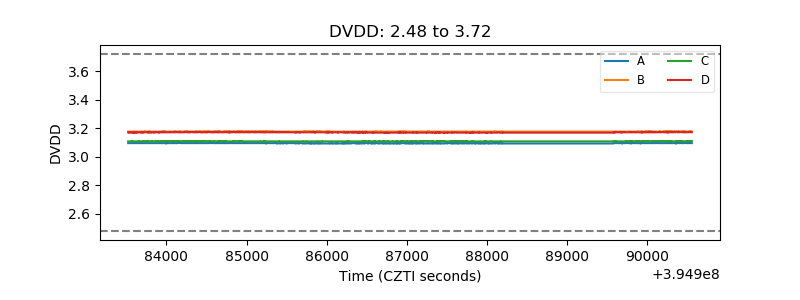 |
| Temperature 1 | 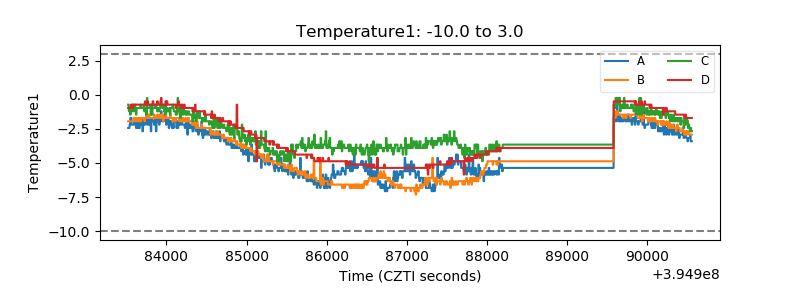 |
| Veto HV Monitor | 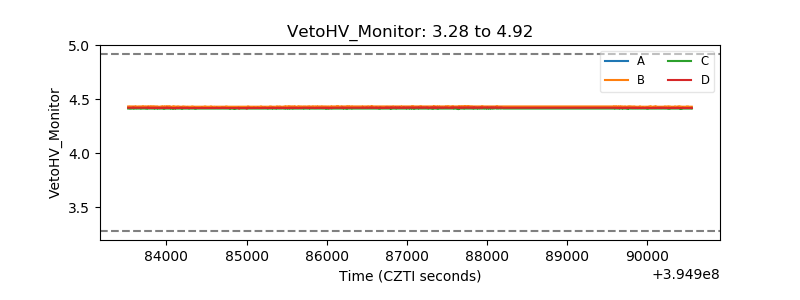 |
| Veto LLD | 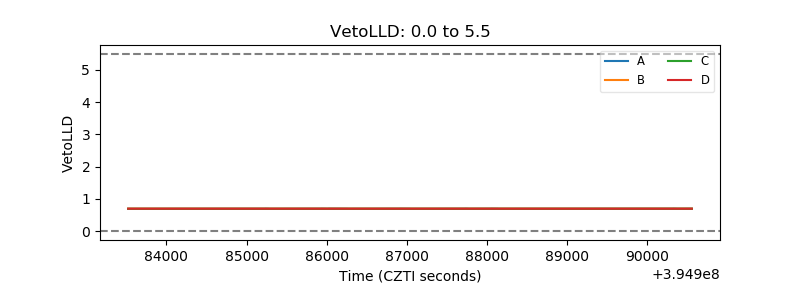 |
| Alpha Counter | 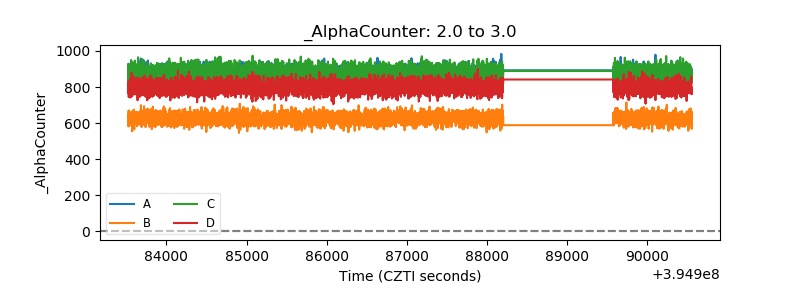 |
| _CPM_Rate |  |
| CZT Counter | 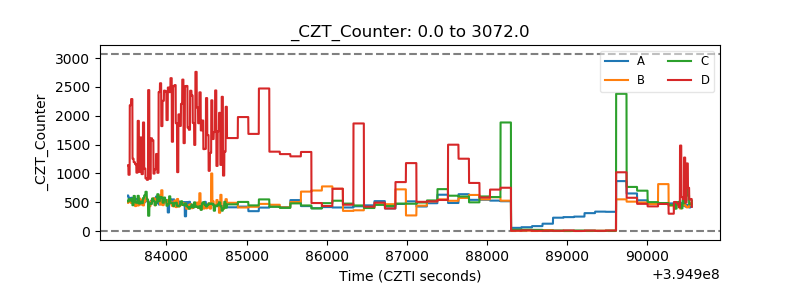 |
| +2.5 Volts monitor | 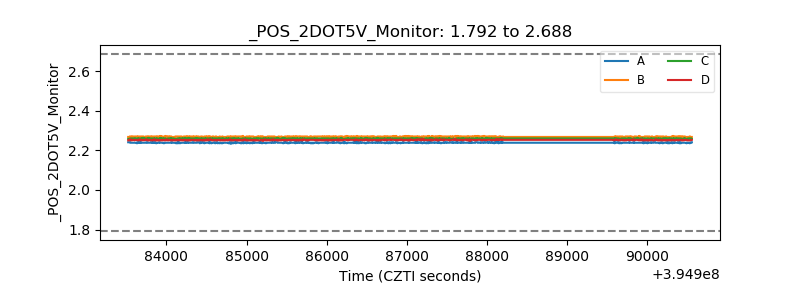 |
| +5 Volts monitor | 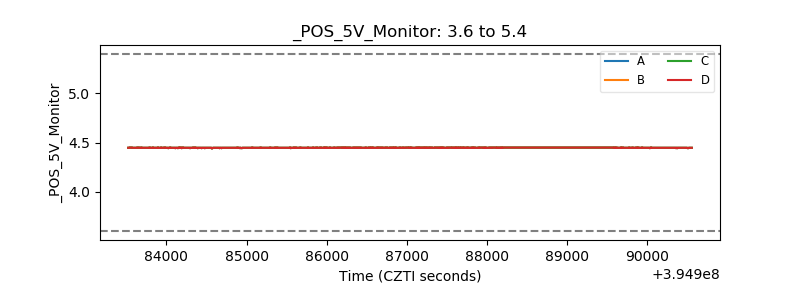 |
| _ROLL_ROT | 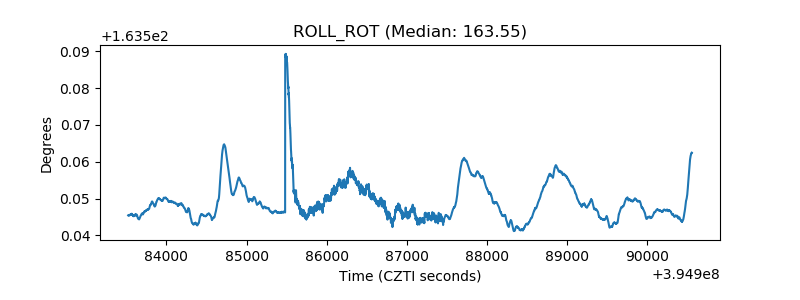 |
| _Roll_DEC |  |
| _Roll_RA | 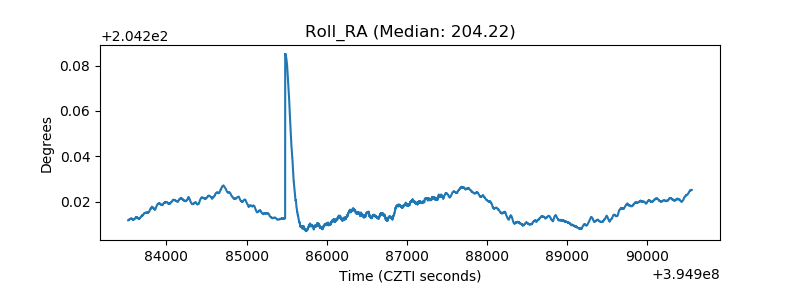 |
| Veto Counter | 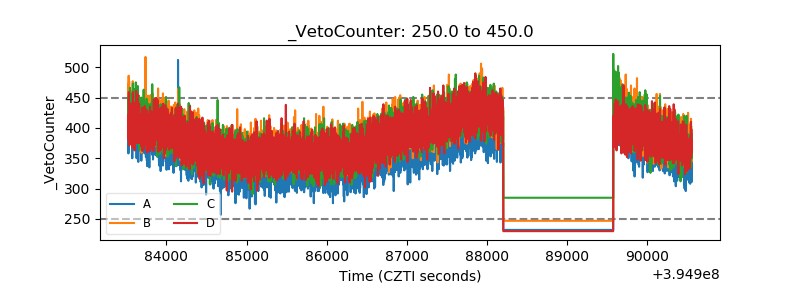 |