| Param | Original file | Final file |
|---|---|---|
| Filename | modeM0/AS1A11_049T04_9000005230_36643cztM0_level2.evt | modeM0/AS1A11_049T04_9000005230_36643cztM0_level2_quad_clean.evt |
| Size (bytes) | 451,779,840 | 74,427,840 |
| Size | 430.9 MB | 71.0 MB |
| Events in quadrant A | 2,967,529 | 475,500 |
| Events in quadrant B | 3,491,352 | 463,422 |
| Events in quadrant C | 3,357,747 | 453,744 |
| Events in quadrant D | 3,461,243 | 445,341 |
| Mode M0 | |||
|---|---|---|---|
| Quadrant | BADHDUFLAG | Total packets | Discarded packets |
| A | 0 | 12554 | 3 |
| B | 0 | 14129 | 2 |
| C | 0 | 13701 | 2 |
| D | 0 | 14160 | 2 |
| Mode M9 | |||
|---|---|---|---|
| Quadrant | BADHDUFLAG | Total packets | Discarded packets |
| A | 0 | 13 | 0 |
| B | 0 | 13 | 0 |
| C | 0 | 13 | 0 |
| D | 0 | 14 | 0 |
| Mode SS | |||
|---|---|---|---|
| Quadrant | BADHDUFLAG | Total packets | Discarded packets |
| A | 0 | 120 | 0 |
| B | 0 | 120 | 0 |
| C | 0 | 120 | 0 |
| D | 0 | 120 | 0 |
| Quadrant | Total seconds | Saturated seconds | Saturation percentage |
|---|---|---|---|
| A | 5953 | 20 | 0.335965% |
| B | 5953 | 174 | 2.922896% |
| C | 5953 | 132 | 2.217369% |
| D | 5953 | 145 | 2.435747% |
Noise dominated data is calculated using 1-second bins in cleaned event files. If a bin has >2000 counts, and if more than 50% of those come from <1% of pixels, then it is considered to be noise-dominated and hence unusable.
| Quadrant | # 1 sec bins | Bins with >0 counts | Bins with >2000 counts | High rate bins dominated by noise | Noise dominated (total time) | Noise dominated (detector-on time) | Marked lightcurve |
|---|---|---|---|---|---|---|---|
| A | 7237 | 5954 | 2 | 2 | 0.03% | 0.03% | 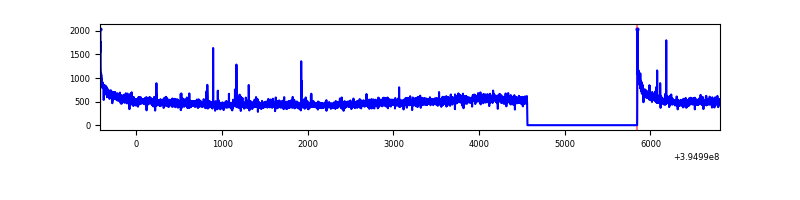 |
| B | 7237 | 5954 | 114 | 114 | 1.58% | 1.91% | 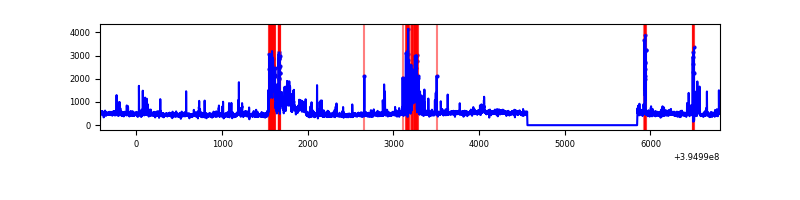 |
| C | 7237 | 5954 | 101 | 101 | 1.40% | 1.70% | 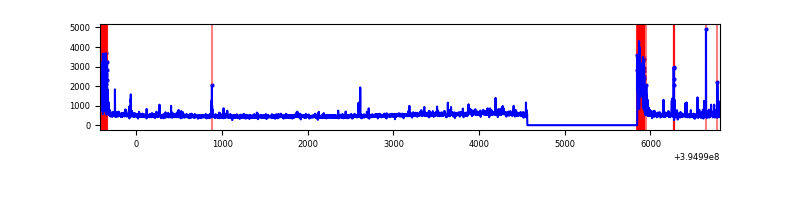 |
| D | 7237 | 5954 | 108 | 108 | 1.49% | 1.81% | 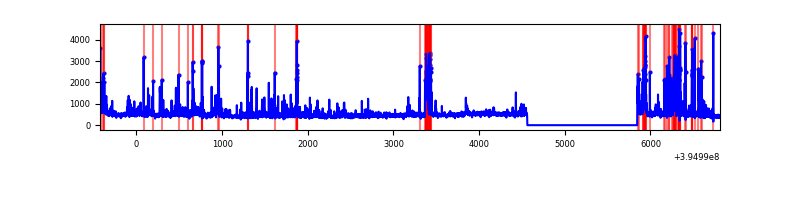 |
Top three noisy pixels from each quadrant. If the there are fewer than three noisy pixels in the level2.evt file, extra rows are filled as -1
| Pixel properties | Quadrant properties | ||||||
|---|---|---|---|---|---|---|---|
| Quadrant | DetID | PixID | Counts | Sigma | Mean | Median | Sigma |
| A | 10 | 83 | 232768 | 1641.08 | 694 | 681 | 141.4 |
| A | 13 | 6 | 13942 | 93.77 | 694 | 681 | 141.4 |
| A | 7 | 192 | 11236 | 74.63 | 694 | 681 | 141.4 |
| B | 0 | 190 | 308008 | 2315.44 | 680 | 662 | 132.7 |
| B | 5 | 255 | 291856 | 2193.75 | 680 | 662 | 132.7 |
| B | 4 | 81 | 49018 | 364.3 | 680 | 662 | 132.7 |
| C | 0 | 10 | 388316 | 2519.67 | 659 | 664 | 153.9 |
| C | 15 | 214 | 250304 | 1622.62 | 659 | 664 | 153.9 |
| C | 14 | 254 | 98790 | 637.8 | 659 | 664 | 153.9 |
| D | 2 | 153 | 254481 | 1556.89 | 665 | 646 | 163.0 |
| D | 2 | 250 | 239316 | 1463.88 | 665 | 646 | 163.0 |
| D | 12 | 235 | 107698 | 656.6 | 665 | 646 | 163.0 |
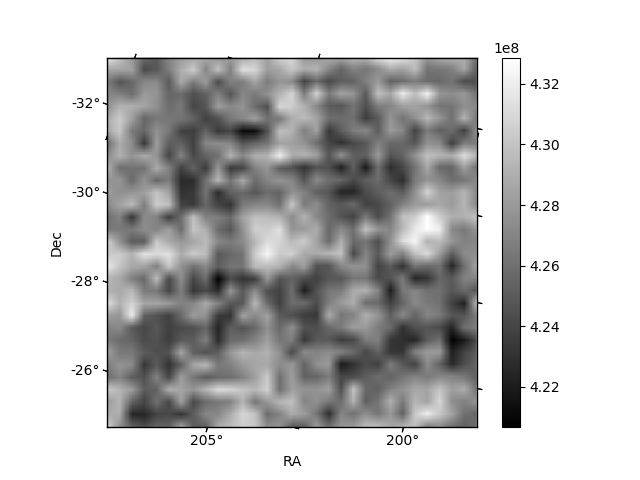
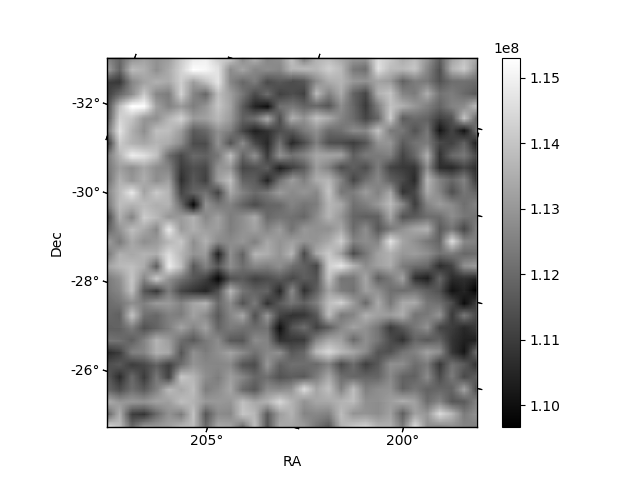
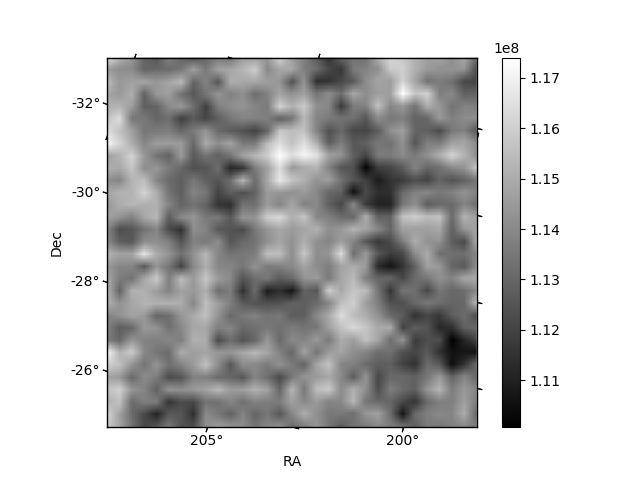
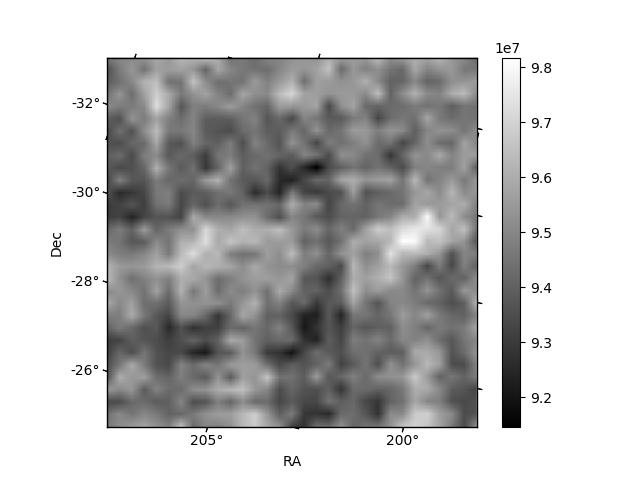
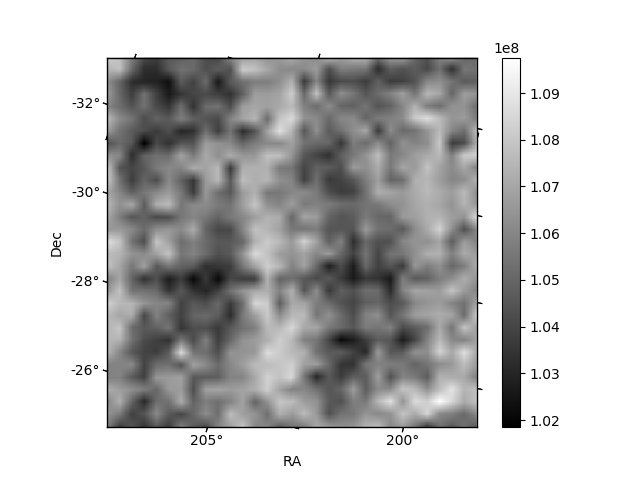
Histogram calculated using DETX and DETY for each event in the final _common_clean file
| Quadrant A | 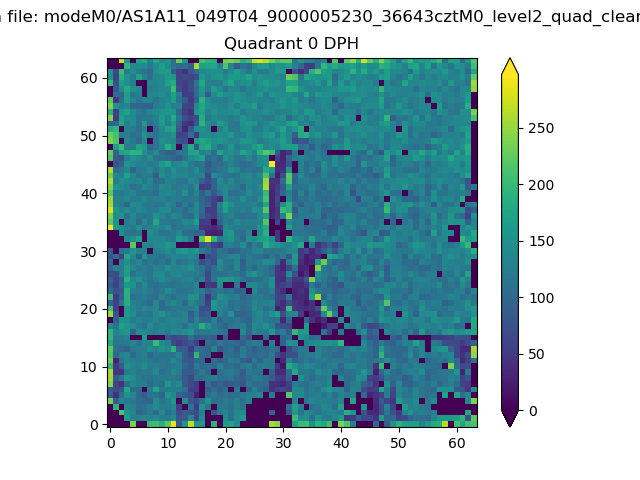 |
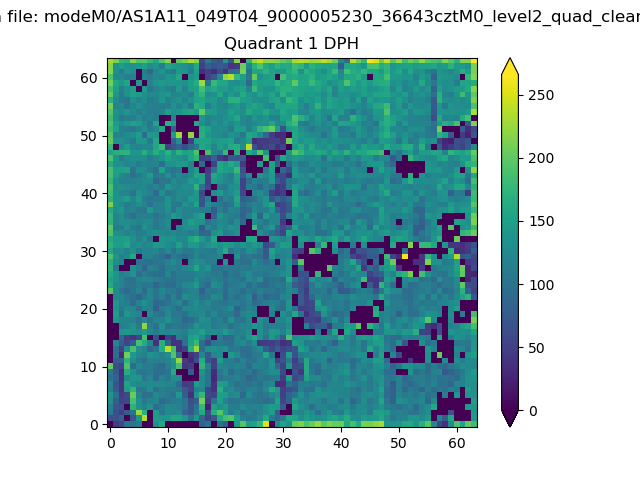 |
Quadrant B |
|---|---|---|---|
| Quadrant D | 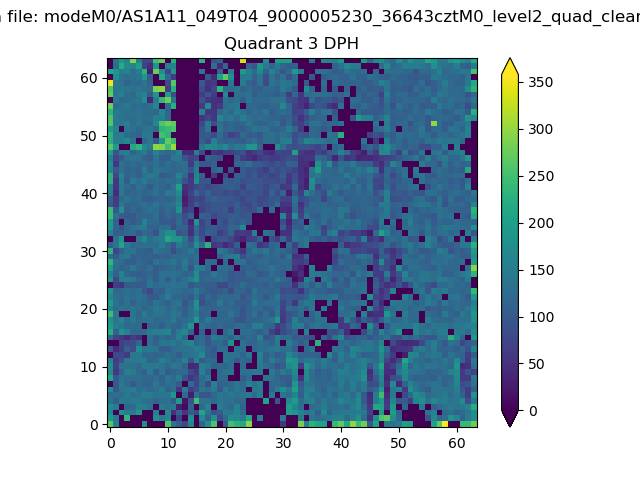 |
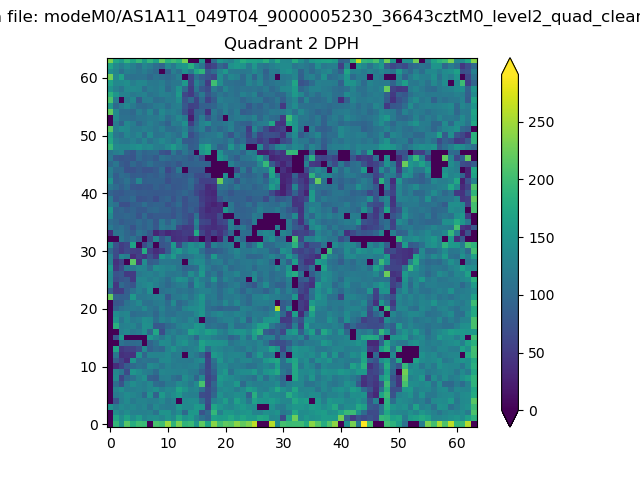 |
Quadrant C |
| Plot type | Count rate plots | Images |
|---|---|---|
| Comparison with Poisson distribution Blue bars denote a histogram of data divided into 1 sec bins. Red curve is a Poisson curve with rate = median count rate of data. |
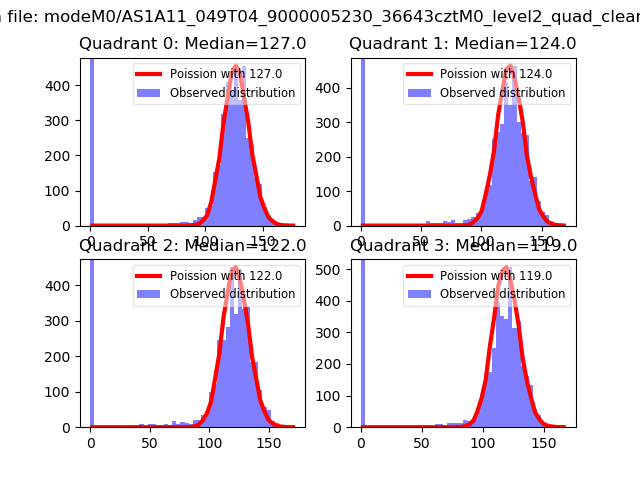 |
 |
| Quadrant-wise count rates Data is divided into 100 sec bins |
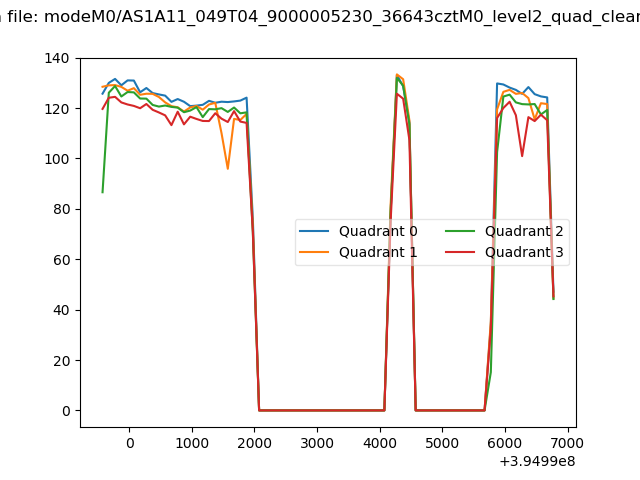 |
|
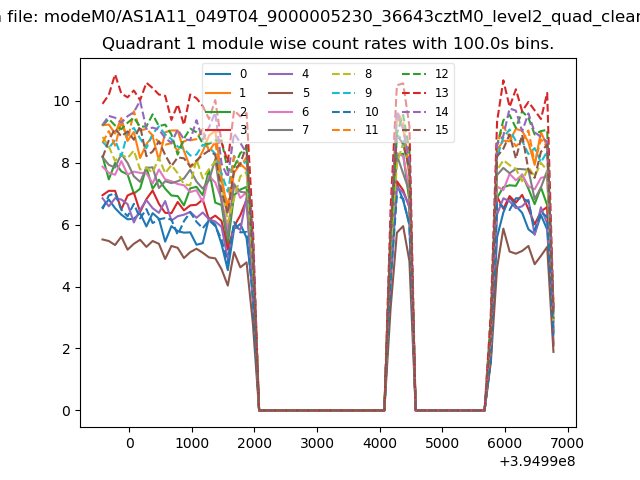
| Module-wise count rates for Quadrant A Data is divided into 100 sec bins |
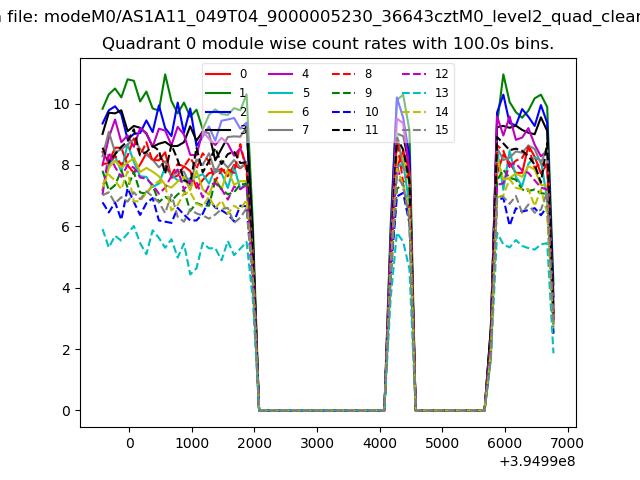 |
 |
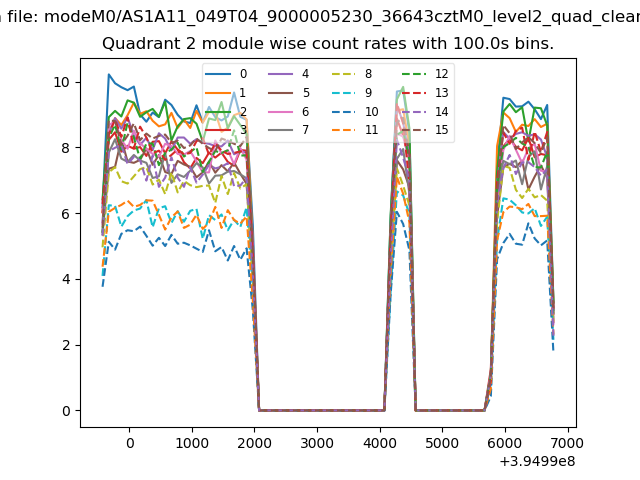
| Module-wise count rates for Quadrant B Data is divided into 100 sec bins |
 |
 |
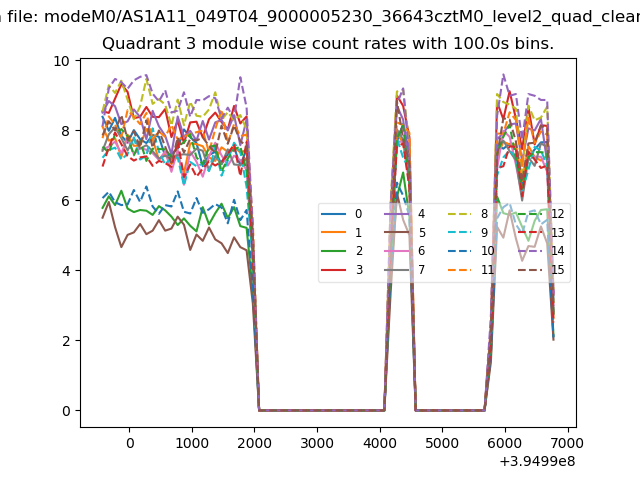
| Module-wise count rates for Quadrant C Data is divided into 100 sec bins |
 |
 |
| Module-wise count rates for Quadrant D Data is divided into 100 sec bins |
 |
 |
| Parameter | Plot |
|---|---|
| CZT HV Monitor | 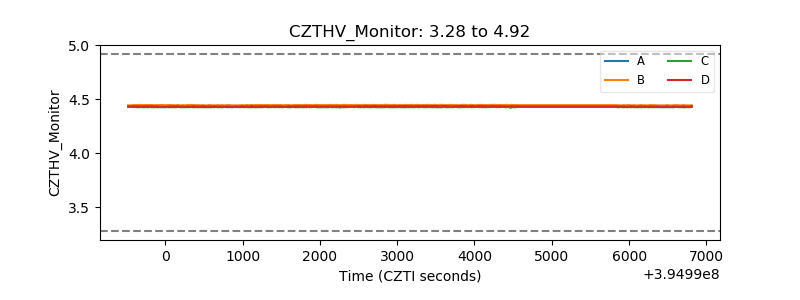 |
| D_VDD | 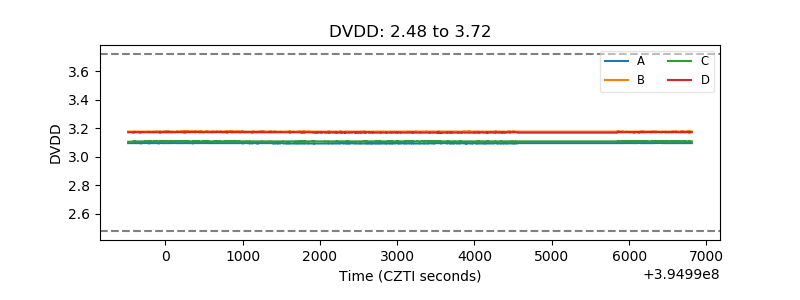 |
| Temperature 1 | 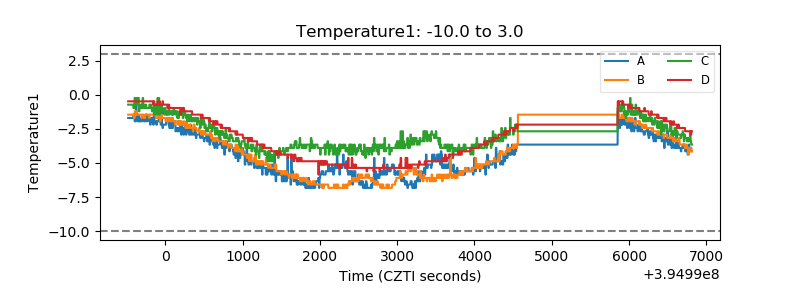 |
| Veto HV Monitor | 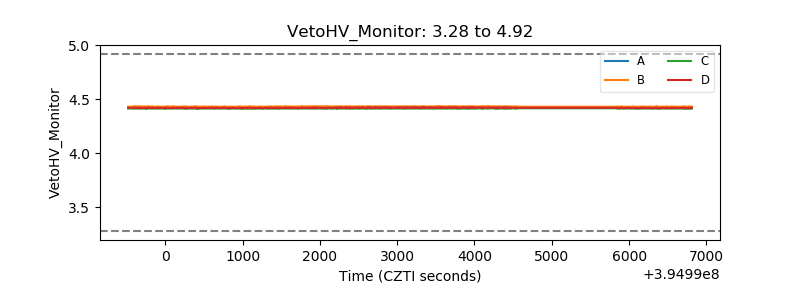 |
| Veto LLD | 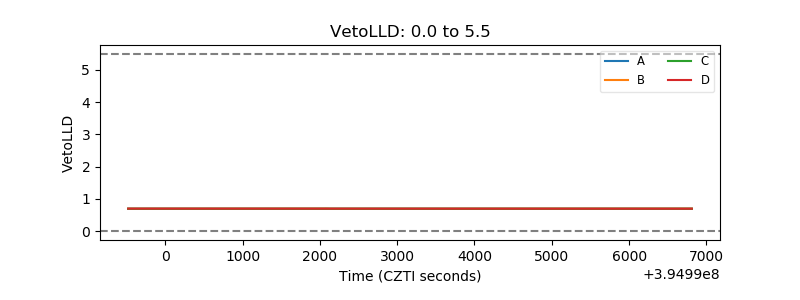 |
| Alpha Counter |  |
| _CPM_Rate |  |
| CZT Counter | 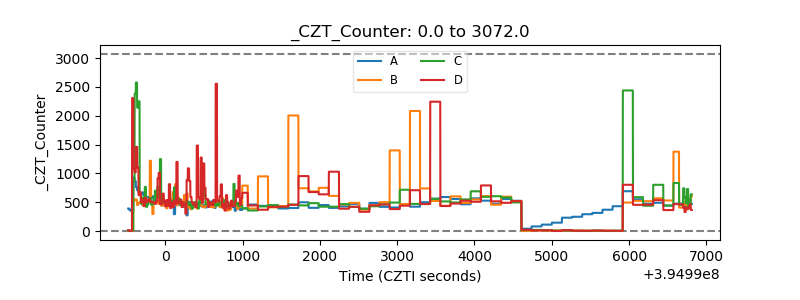 |
| +2.5 Volts monitor |  |
| +5 Volts monitor |  |
| _ROLL_ROT | 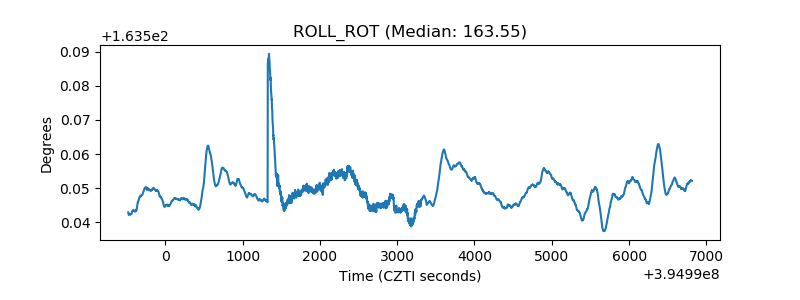 |
| _Roll_DEC | 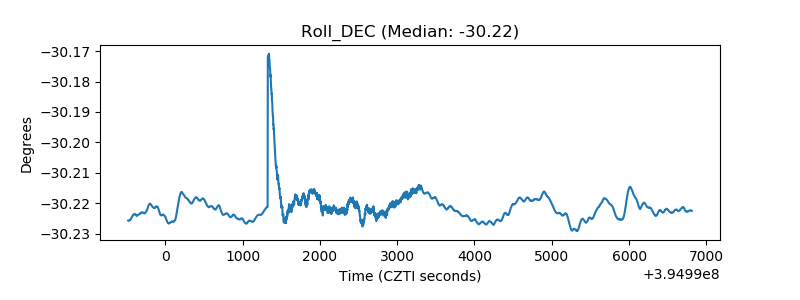 |
| _Roll_RA | 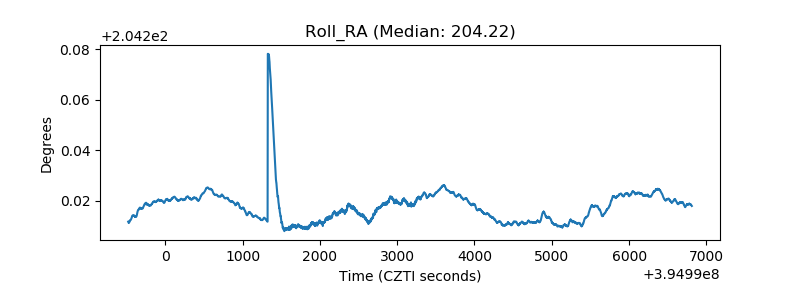 |
| Veto Counter | 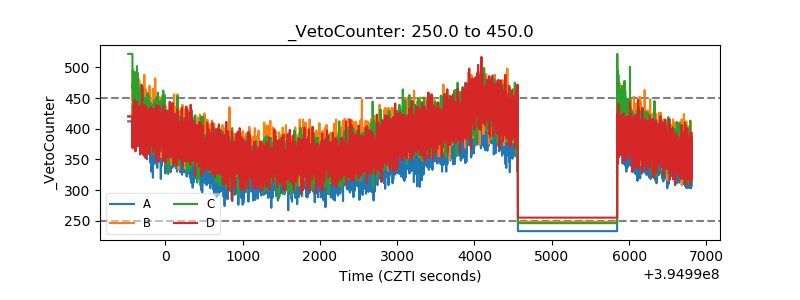 |