| Param | Original file | Final file |
|---|---|---|
| Filename | modeM0/AS1A11_049T04_9000005230_36645cztM0_level2.evt | modeM0/AS1A11_049T04_9000005230_36645cztM0_level2_quad_clean.evt |
| Size (bytes) | 817,551,360 | 127,379,520 |
| Size | 779.7 MB | 121.5 MB |
| Events in quadrant A | 5,292,135 | 808,101 |
| Events in quadrant B | 6,015,960 | 788,031 |
| Events in quadrant C | 6,251,705 | 773,698 |
| Events in quadrant D | 6,472,961 | 743,838 |
| Mode M0 | |||
|---|---|---|---|
| Quadrant | BADHDUFLAG | Total packets | Discarded packets |
| A | 0 | 22531 | 4 |
| B | 0 | 24619 | 3 |
| C | 0 | 25268 | 3 |
| D | 0 | 26537 | 3 |
| Mode M9 | |||
|---|---|---|---|
| Quadrant | BADHDUFLAG | Total packets | Discarded packets |
| A | 0 | 30 | 0 |
| B | 0 | 30 | 0 |
| C | 0 | 30 | 0 |
| D | 0 | 31 | 0 |
| Mode SS | |||
|---|---|---|---|
| Quadrant | BADHDUFLAG | Total packets | Discarded packets |
| A | 0 | 220 | 0 |
| B | 0 | 220 | 0 |
| C | 0 | 220 | 0 |
| D | 0 | 220 | 0 |
| Quadrant | Total seconds | Saturated seconds | Saturation percentage |
|---|---|---|---|
| A | 10737 | 30 | 0.279408% |
| B | 10737 | 249 | 2.319084% |
| C | 10737 | 285 | 2.654373% |
| D | 10737 | 335 | 3.120052% |
Noise dominated data is calculated using 1-second bins in cleaned event files. If a bin has >2000 counts, and if more than 50% of those come from <1% of pixels, then it is considered to be noise-dominated and hence unusable.
| Quadrant | # 1 sec bins | Bins with >0 counts | Bins with >2000 counts | High rate bins dominated by noise | Noise dominated (total time) | Noise dominated (detector-on time) | Marked lightcurve |
|---|---|---|---|---|---|---|---|
| A | 13513 | 10739 | 10 | 10 | 0.07% | 0.09% | 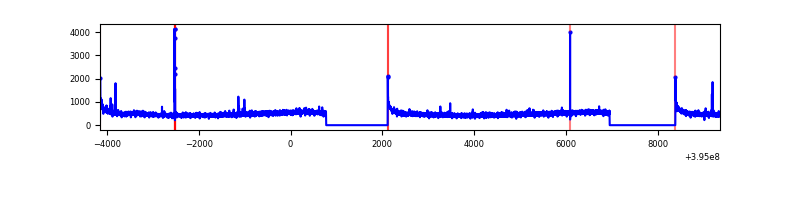 |
| B | 13513 | 10739 | 156 | 156 | 1.15% | 1.45% | 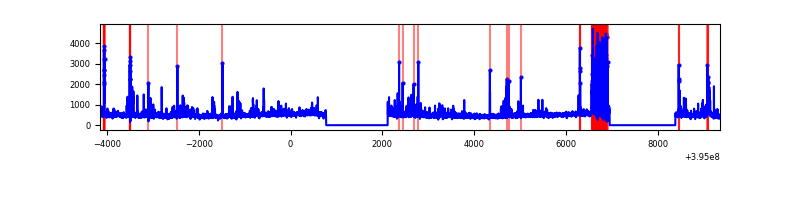 |
| C | 13513 | 10739 | 229 | 229 | 1.69% | 2.13% | 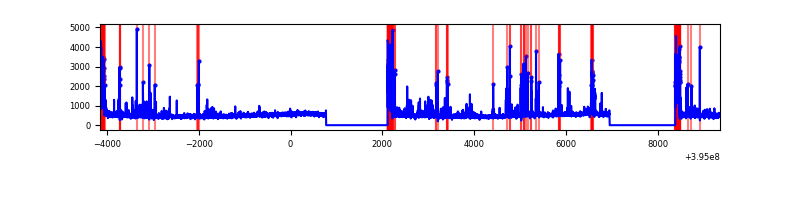 |
| D | 13513 | 10739 | 251 | 251 | 1.86% | 2.34% | 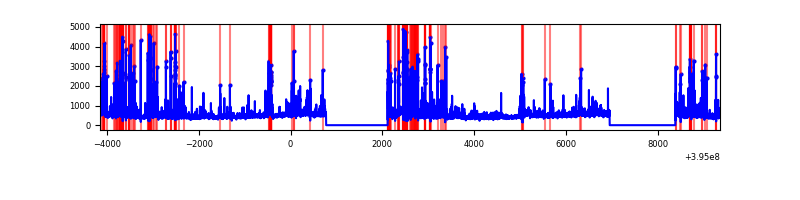 |
Top three noisy pixels from each quadrant. If the there are fewer than three noisy pixels in the level2.evt file, extra rows are filled as -1
| Pixel properties | Quadrant properties | ||||||
|---|---|---|---|---|---|---|---|
| Quadrant | DetID | PixID | Counts | Sigma | Mean | Median | Sigma |
| A | 10 | 83 | 376586 | 1502.36 | 1246 | 1222 | 249.8 |
| A | 9 | 143 | 37361 | 144.64 | 1246 | 1222 | 249.8 |
| A | 13 | 6 | 30669 | 117.86 | 1246 | 1222 | 249.8 |
| B | 0 | 190 | 555275 | 2353.2 | 1226 | 1193 | 235.5 |
| B | 0 | 221 | 150890 | 635.77 | 1226 | 1193 | 235.5 |
| B | 5 | 255 | 129850 | 546.41 | 1226 | 1193 | 235.5 |
| C | 0 | 10 | 769638 | 2762.62 | 1192 | 1200 | 278.2 |
| C | 15 | 214 | 446874 | 1602.25 | 1192 | 1200 | 278.2 |
| C | 14 | 254 | 348375 | 1248.13 | 1192 | 1200 | 278.2 |
| D | 2 | 153 | 444692 | 1507.68 | 1191 | 1157 | 294.2 |
| D | 2 | 250 | 270687 | 916.19 | 1191 | 1157 | 294.2 |
| D | 13 | 171 | 249638 | 844.64 | 1191 | 1157 | 294.2 |
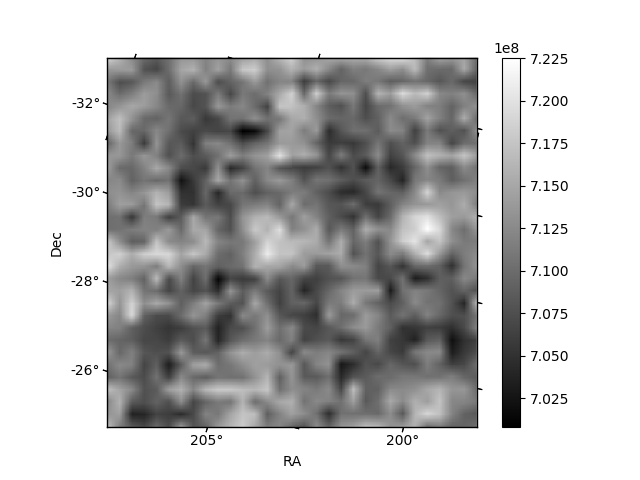
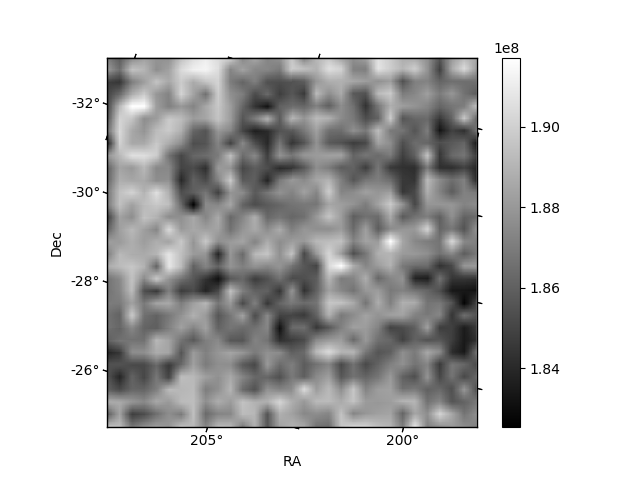
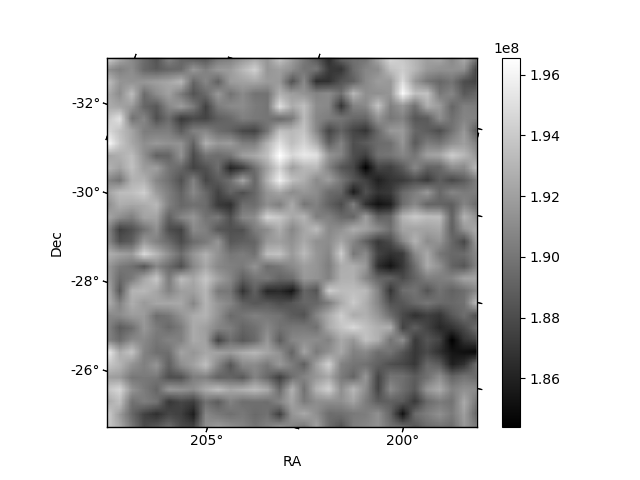
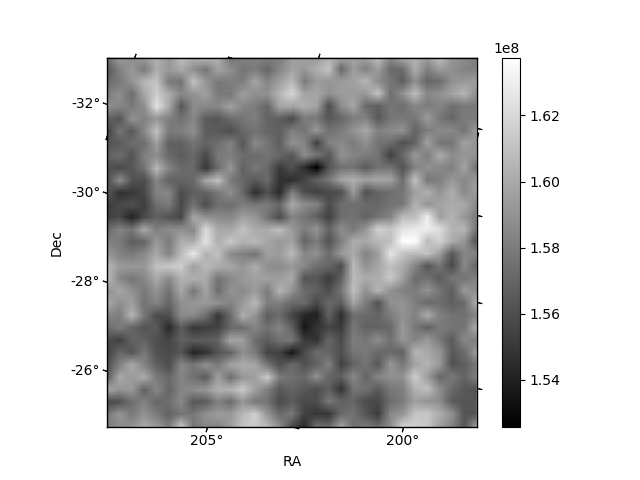
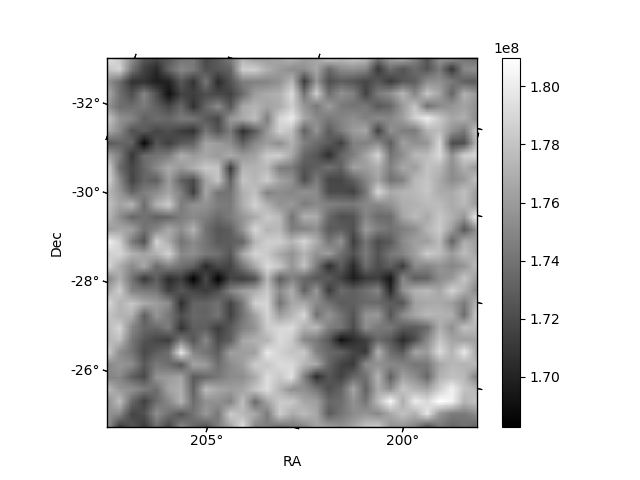
Histogram calculated using DETX and DETY for each event in the final _common_clean file
| Quadrant A | 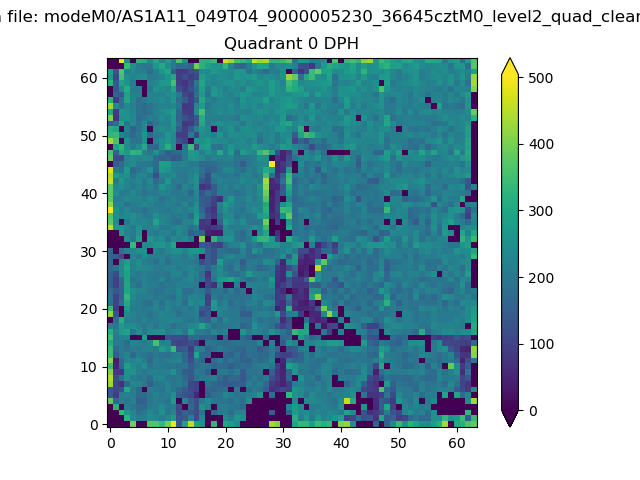 |
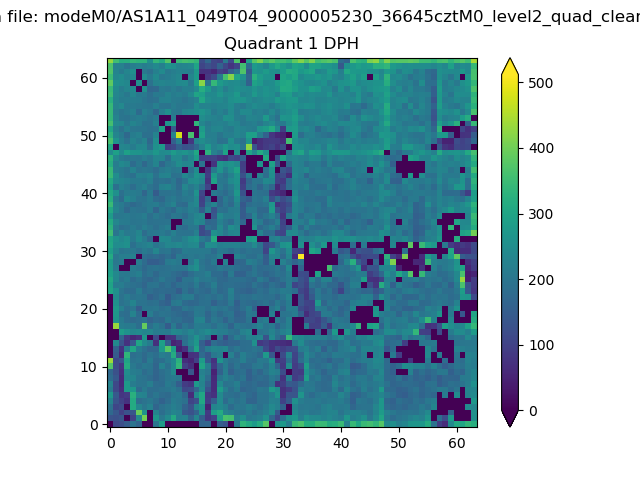 |
Quadrant B |
|---|---|---|---|
| Quadrant D | 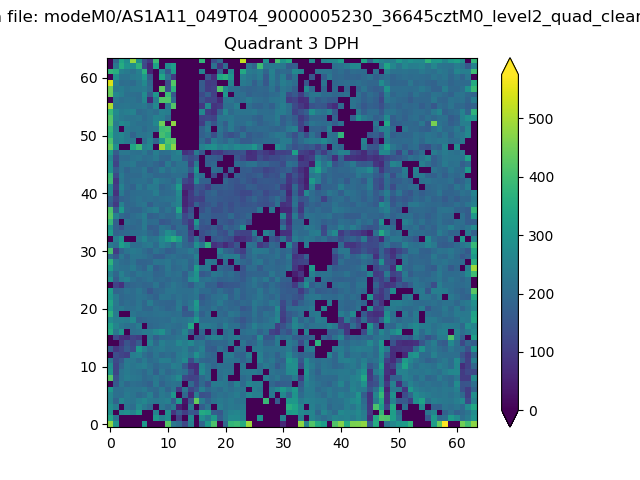 |
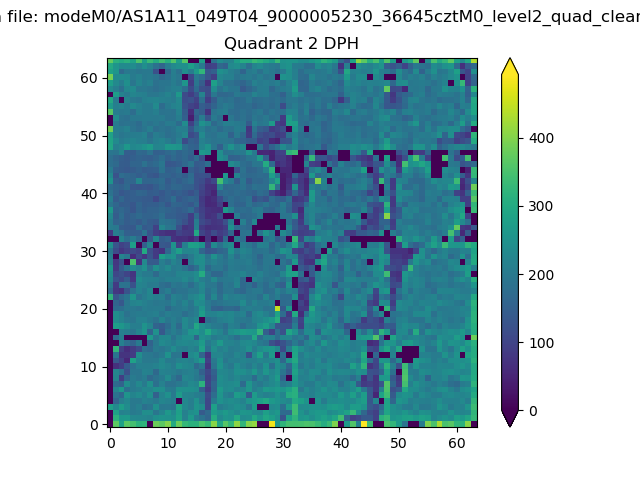 |
Quadrant C |
| Plot type | Count rate plots | Images |
|---|---|---|
| Comparison with Poisson distribution Blue bars denote a histogram of data divided into 1 sec bins. Red curve is a Poisson curve with rate = median count rate of data. |
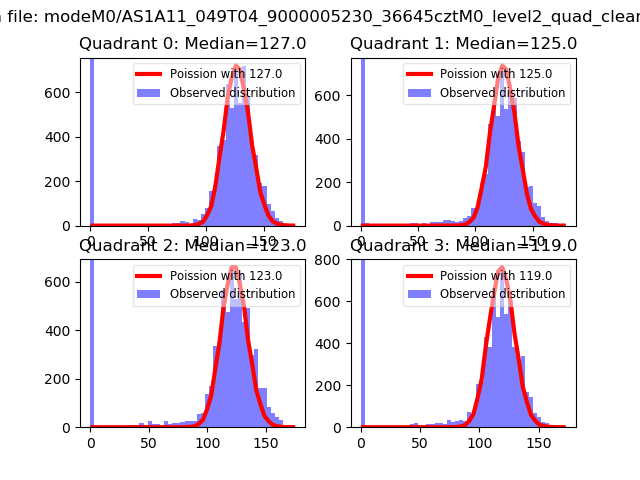 |
 |
| Quadrant-wise count rates Data is divided into 100 sec bins |
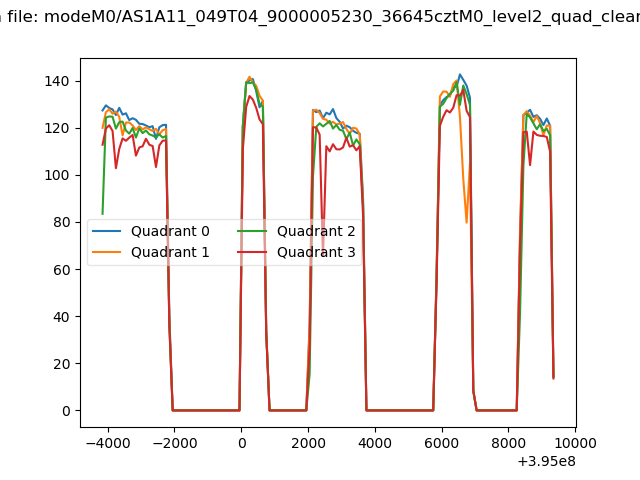 |
|
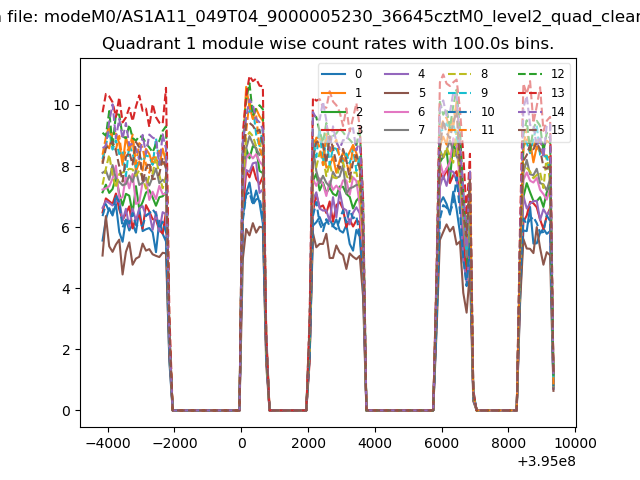
| Module-wise count rates for Quadrant A Data is divided into 100 sec bins |
 |
 |
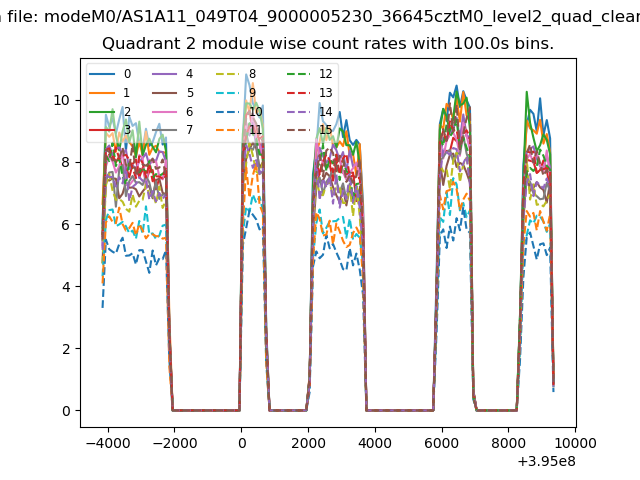
| Module-wise count rates for Quadrant B Data is divided into 100 sec bins |
 |
 |
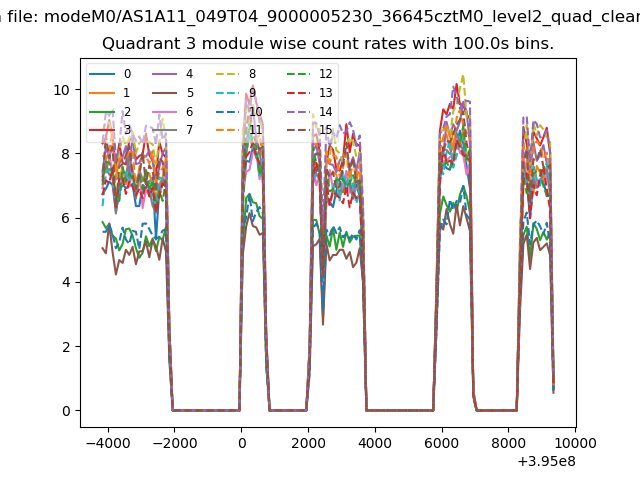
| Module-wise count rates for Quadrant C Data is divided into 100 sec bins |
 |
 |
| Module-wise count rates for Quadrant D Data is divided into 100 sec bins |
 |
 |
| Parameter | Plot |
|---|---|
| CZT HV Monitor | 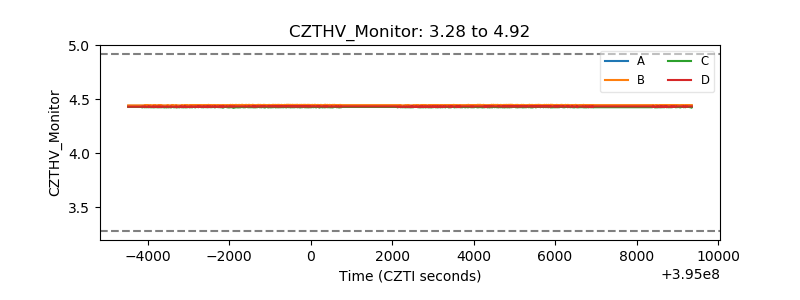 |
| D_VDD | 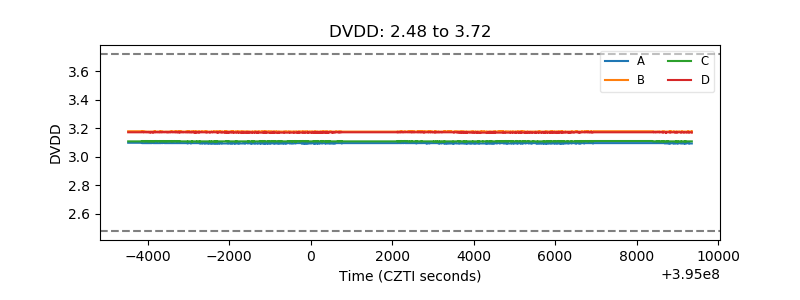 |
| Temperature 1 | 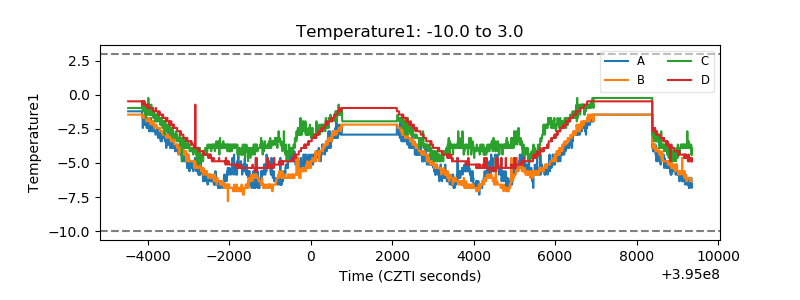 |
| Veto HV Monitor |  |
| Veto LLD | 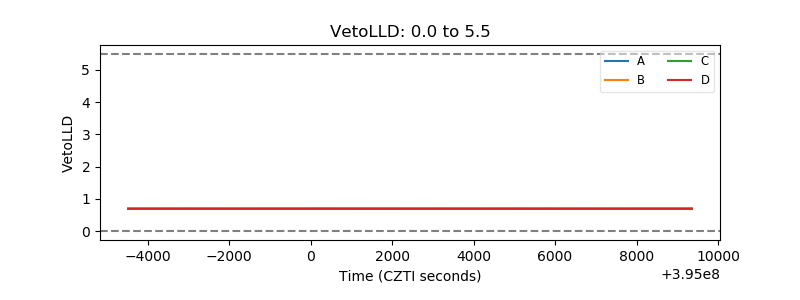 |
| Alpha Counter | 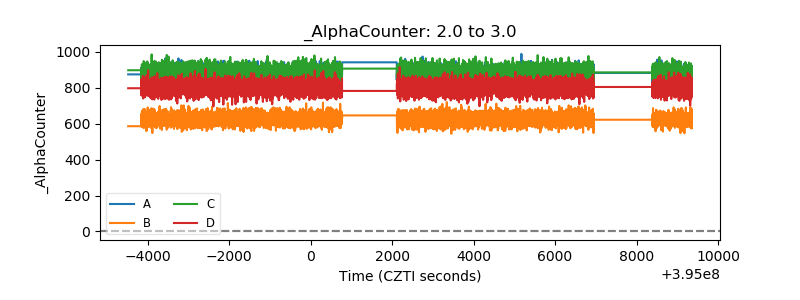 |
| _CPM_Rate | 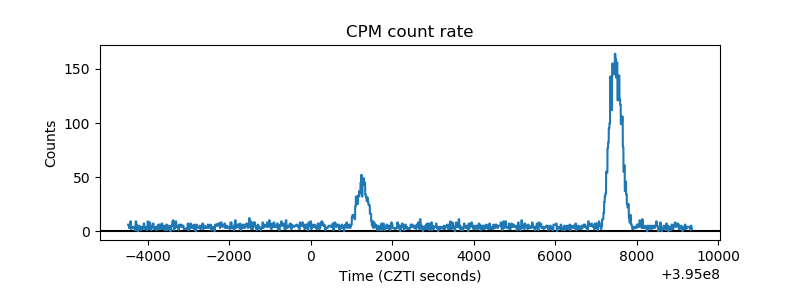 |
| CZT Counter | 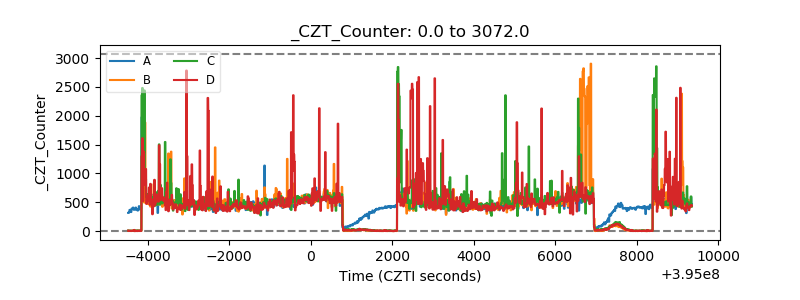 |
| +2.5 Volts monitor |  |
| +5 Volts monitor |  |
| _ROLL_ROT |  |
| _Roll_DEC | 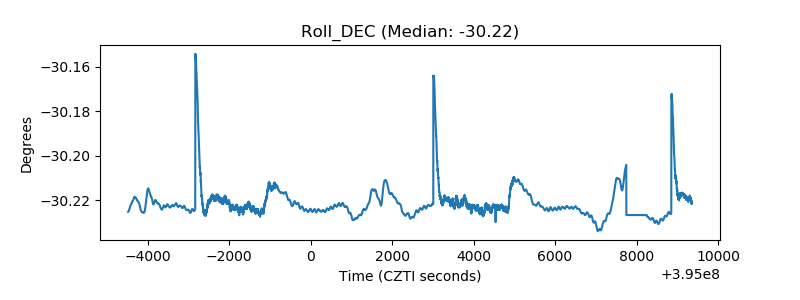 |
| _Roll_RA | 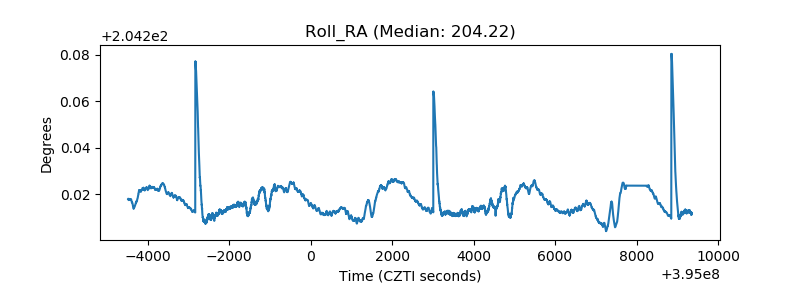 |
| Veto Counter | 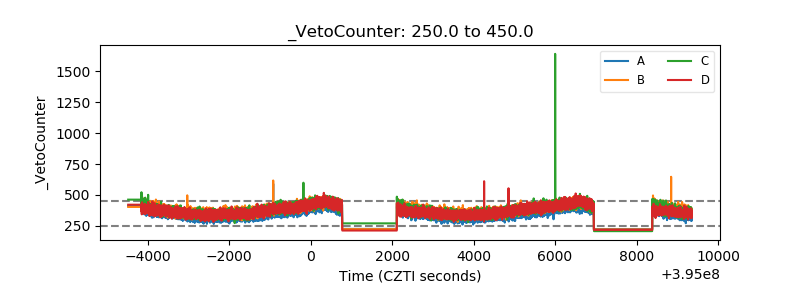 |