| Param | Original file | Final file |
|---|---|---|
| Filename | modeM0/AS1A11_049T04_9000005230_36646cztM0_level2.evt | modeM0/AS1A11_049T04_9000005230_36646cztM0_level2_quad_clean.evt |
| Size (bytes) | 439,248,960 | 67,625,280 |
| Size | 418.9 MB | 64.5 MB |
| Events in quadrant A | 2,883,617 | 426,677 |
| Events in quadrant B | 3,228,587 | 416,390 |
| Events in quadrant C | 3,323,634 | 408,828 |
| Events in quadrant D | 3,474,976 | 392,383 |
| Mode M0 | |||
|---|---|---|---|
| Quadrant | BADHDUFLAG | Total packets | Discarded packets |
| A | 0 | 12216 | 3 |
| B | 0 | 13249 | 2 |
| C | 0 | 13340 | 2 |
| D | 0 | 14356 | 2 |
| Mode M9 | |||
|---|---|---|---|
| Quadrant | BADHDUFLAG | Total packets | Discarded packets |
| A | 0 | 23 | 0 |
| B | 0 | 23 | 0 |
| C | 0 | 23 | 0 |
| D | 0 | 24 | 0 |
| Mode SS | |||
|---|---|---|---|
| Quadrant | BADHDUFLAG | Total packets | Discarded packets |
| A | 0 | 118 | 0 |
| B | 0 | 118 | 0 |
| C | 0 | 118 | 0 |
| D | 0 | 118 | 0 |
| Quadrant | Total seconds | Saturated seconds | Saturation percentage |
|---|---|---|---|
| A | 5762 | 17 | 0.295036% |
| B | 5762 | 141 | 2.447067% |
| C | 5762 | 156 | 2.707393% |
| D | 5762 | 193 | 3.349531% |
Noise dominated data is calculated using 1-second bins in cleaned event files. If a bin has >2000 counts, and if more than 50% of those come from <1% of pixels, then it is considered to be noise-dominated and hence unusable.
| Quadrant | # 1 sec bins | Bins with >0 counts | Bins with >2000 counts | High rate bins dominated by noise | Noise dominated (total time) | Noise dominated (detector-on time) | Marked lightcurve |
|---|---|---|---|---|---|---|---|
| A | 7284 | 5763 | 8 | 8 | 0.11% | 0.14% | 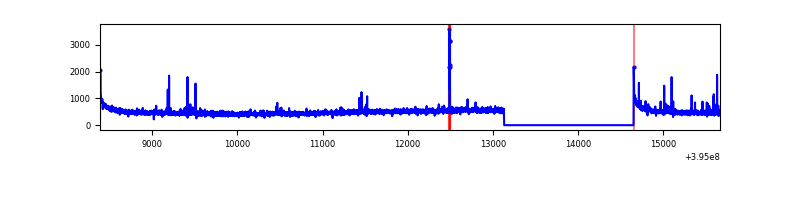 |
| B | 7284 | 5763 | 104 | 104 | 1.43% | 1.80% | 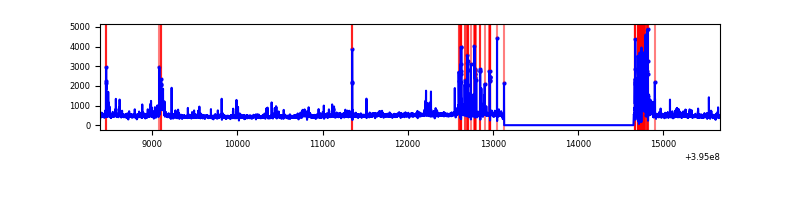 |
| C | 7284 | 5763 | 128 | 128 | 1.76% | 2.22% | 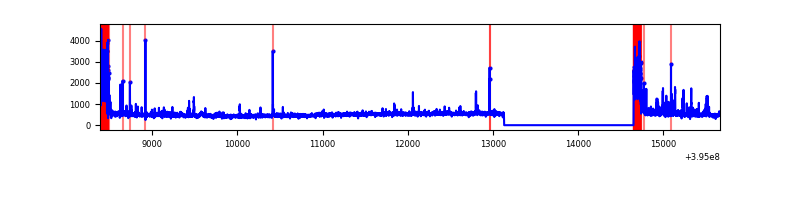 |
| D | 7284 | 5763 | 151 | 151 | 2.07% | 2.62% | 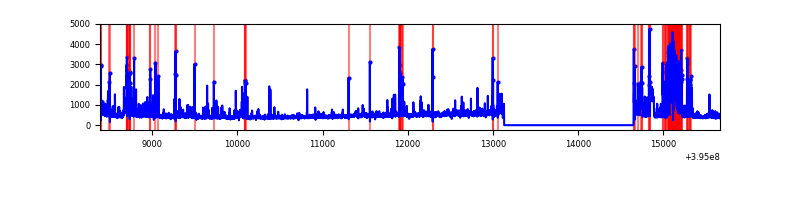 |
Top three noisy pixels from each quadrant. If the there are fewer than three noisy pixels in the level2.evt file, extra rows are filled as -1
| Pixel properties | Quadrant properties | ||||||
|---|---|---|---|---|---|---|---|
| Quadrant | DetID | PixID | Counts | Sigma | Mean | Median | Sigma |
| A | 10 | 83 | 216404 | 1606.51 | 665 | 655 | 134.3 |
| A | 9 | 143 | 80988 | 598.18 | 665 | 655 | 134.3 |
| A | 13 | 254 | 10067 | 70.08 | 665 | 655 | 134.3 |
| B | 0 | 190 | 312945 | 2460.6 | 654 | 637 | 126.9 |
| B | 5 | 255 | 106966 | 837.74 | 654 | 637 | 126.9 |
| B | 0 | 221 | 102407 | 801.82 | 654 | 637 | 126.9 |
| C | 0 | 10 | 470082 | 3147.72 | 636 | 640 | 149.1 |
| C | 15 | 214 | 241615 | 1615.79 | 636 | 640 | 149.1 |
| C | 14 | 254 | 62095 | 412.07 | 636 | 640 | 149.1 |
| D | 12 | 6 | 474966 | 3062.83 | 635 | 619 | 154.9 |
| D | 13 | 171 | 131376 | 844.29 | 635 | 619 | 154.9 |
| D | 2 | 153 | 84922 | 544.34 | 635 | 619 | 154.9 |
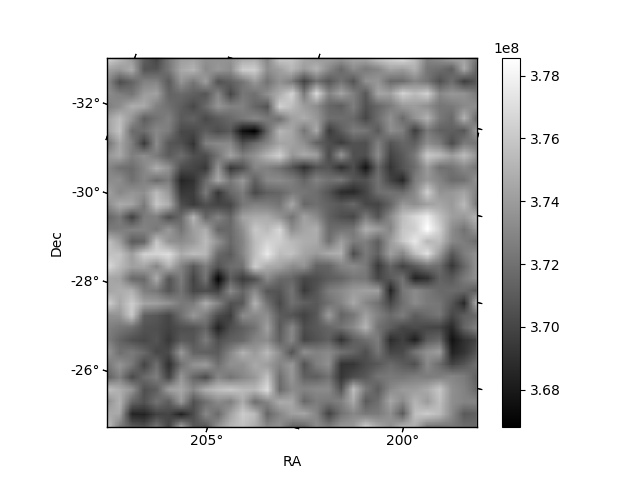
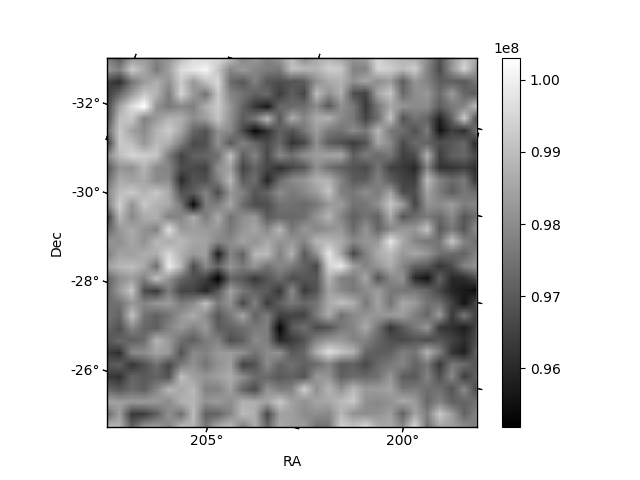
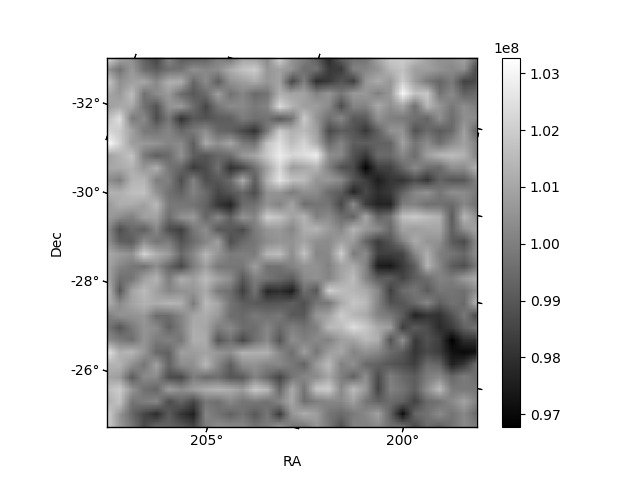
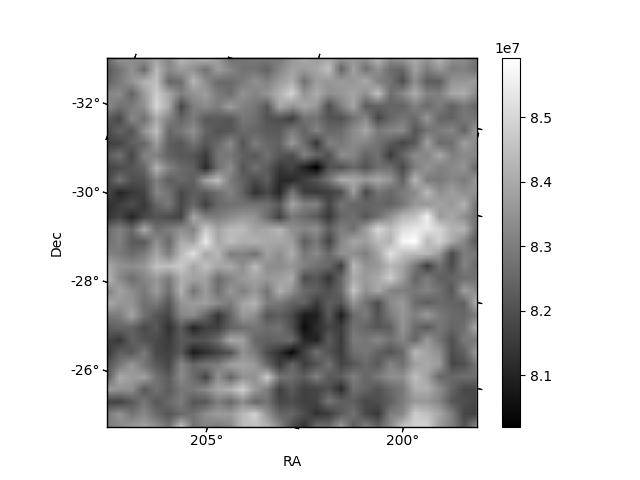
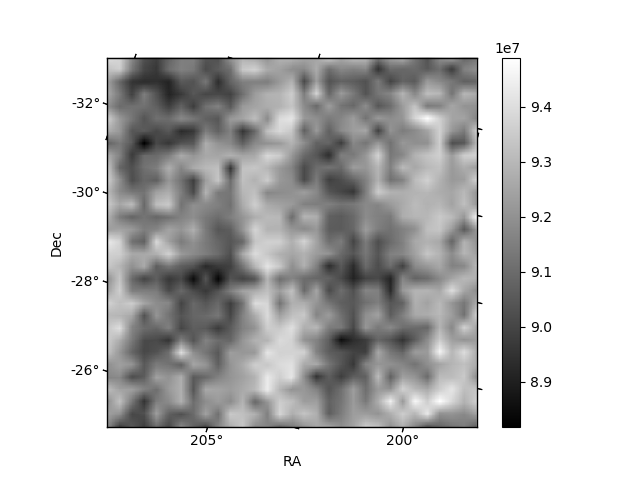
Histogram calculated using DETX and DETY for each event in the final _common_clean file
| Quadrant A | 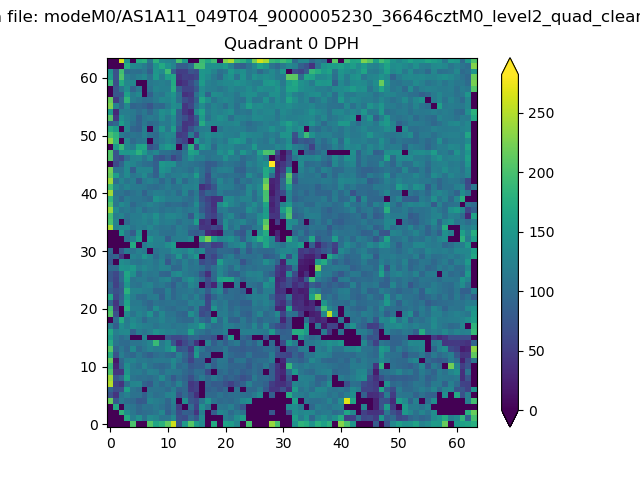 |
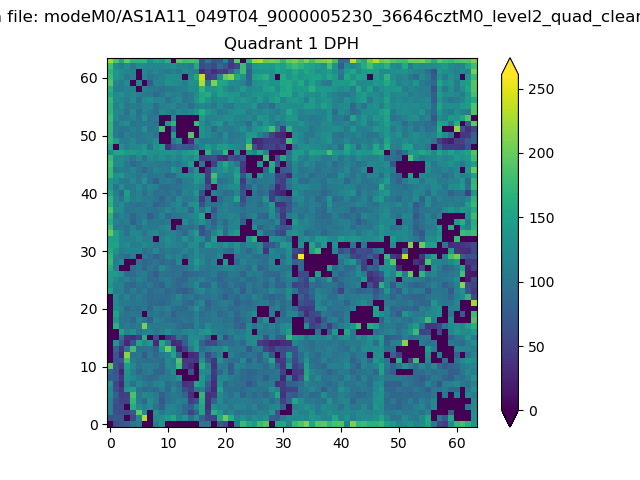 |
Quadrant B |
|---|---|---|---|
| Quadrant D |  |
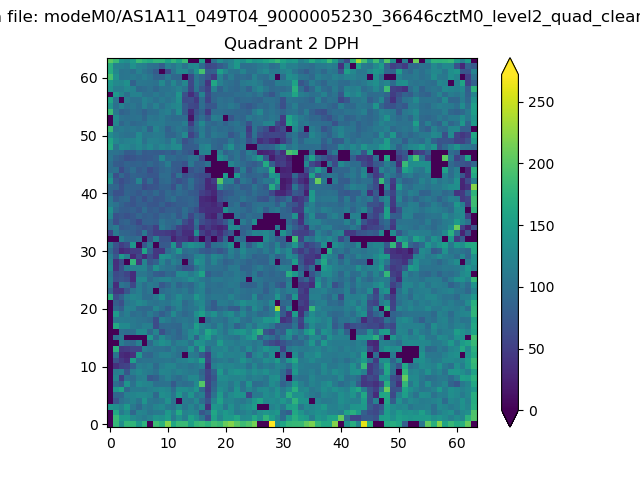 |
Quadrant C |
| Plot type | Count rate plots | Images |
|---|---|---|
| Comparison with Poisson distribution Blue bars denote a histogram of data divided into 1 sec bins. Red curve is a Poisson curve with rate = median count rate of data. |
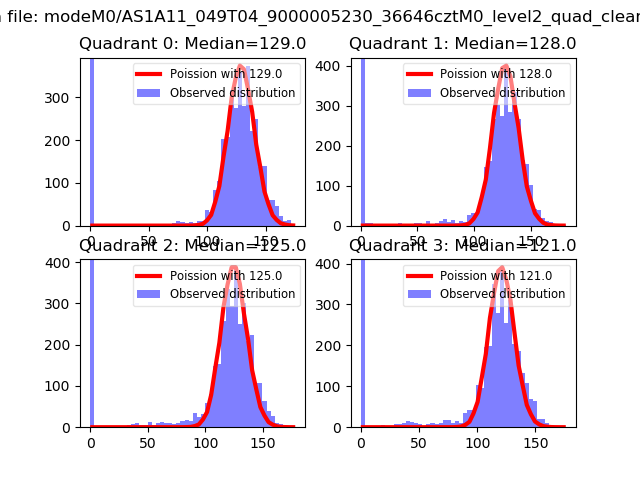 |
 |
| Quadrant-wise count rates Data is divided into 100 sec bins |
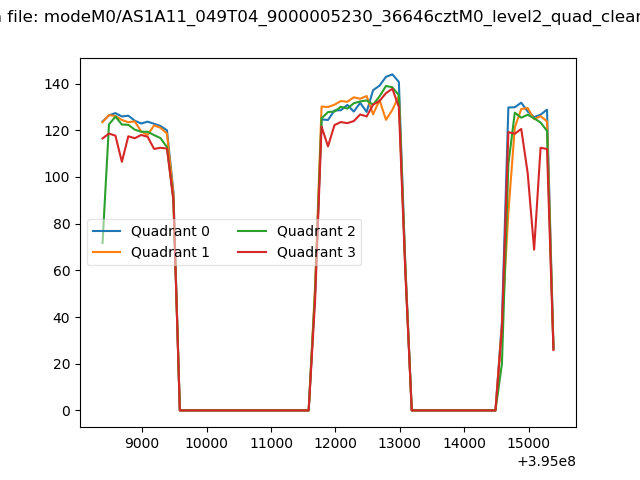 |
|
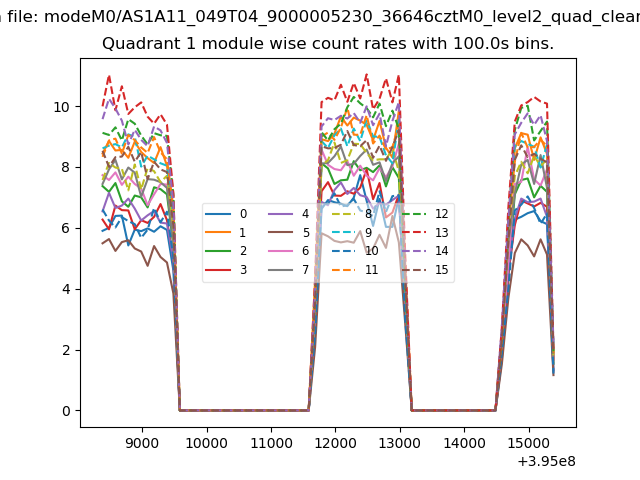
| Module-wise count rates for Quadrant A Data is divided into 100 sec bins |
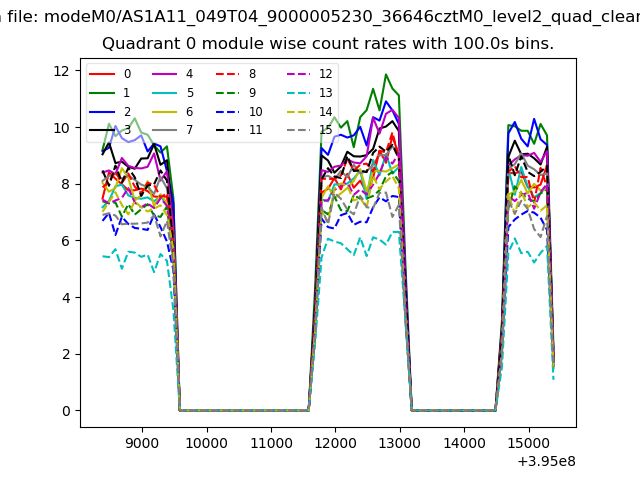 |
 |
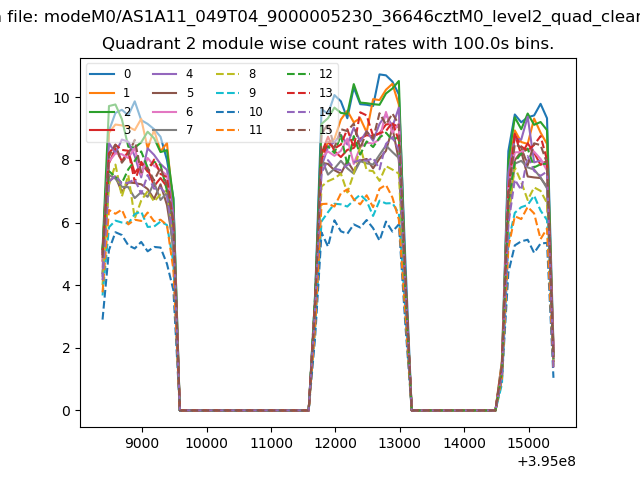
| Module-wise count rates for Quadrant B Data is divided into 100 sec bins |
 |
 |
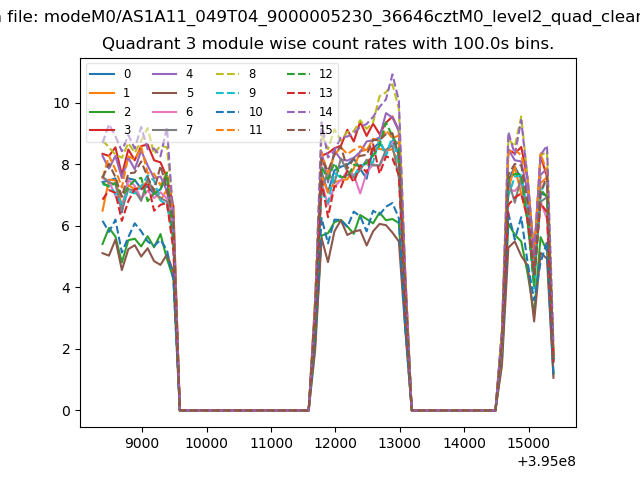
| Module-wise count rates for Quadrant C Data is divided into 100 sec bins |
 |
 |
| Module-wise count rates for Quadrant D Data is divided into 100 sec bins |
 |
 |
| Parameter | Plot |
|---|---|
| CZT HV Monitor | 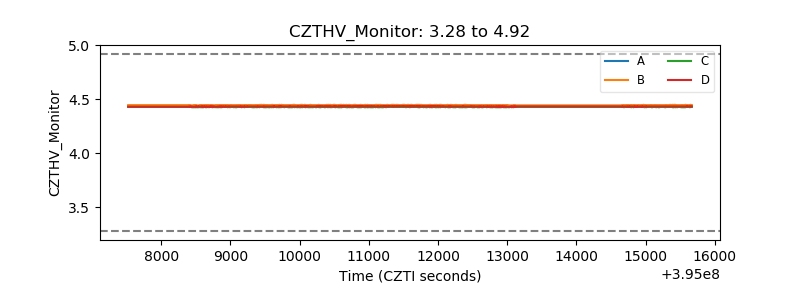 |
| D_VDD | 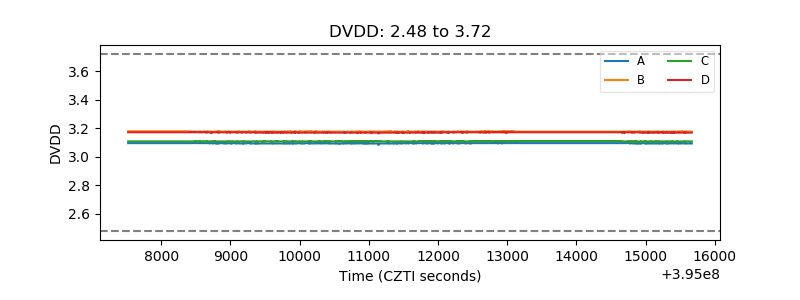 |
| Temperature 1 | 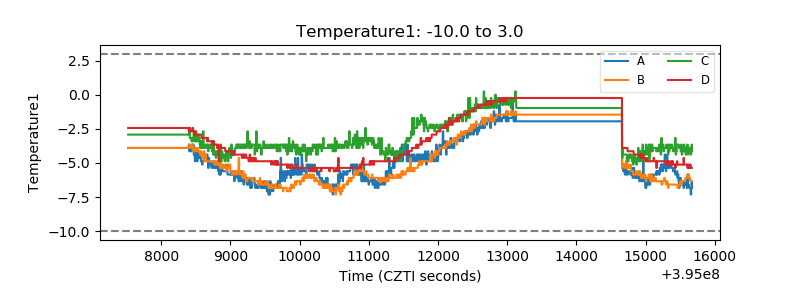 |
| Veto HV Monitor |  |
| Veto LLD | 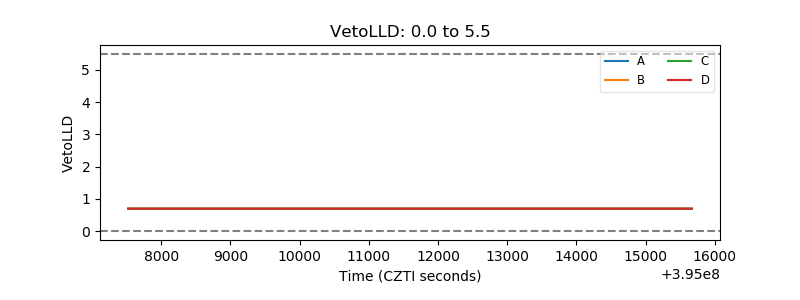 |
| Alpha Counter | 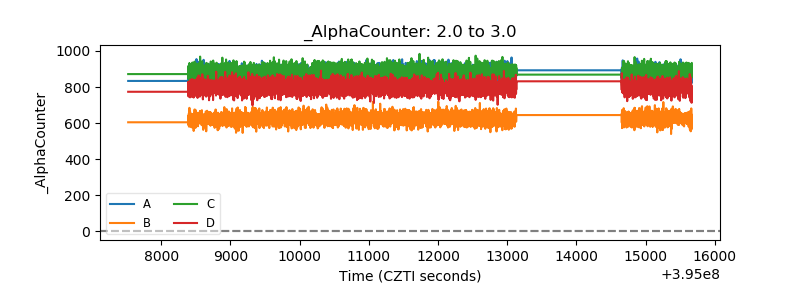 |
| _CPM_Rate |  |
| CZT Counter | 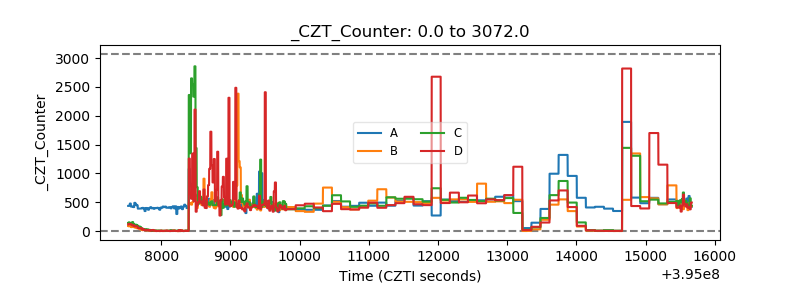 |
| +2.5 Volts monitor | 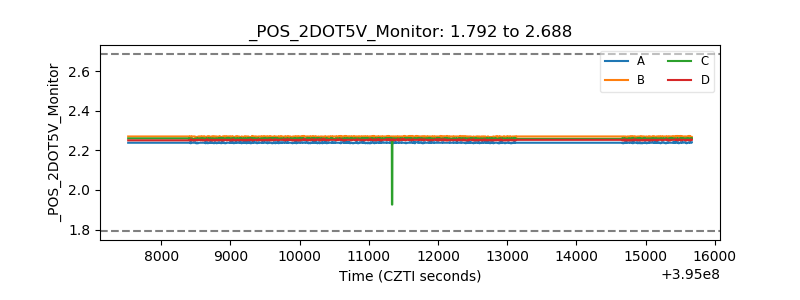 |
| +5 Volts monitor |  |
| _ROLL_ROT | 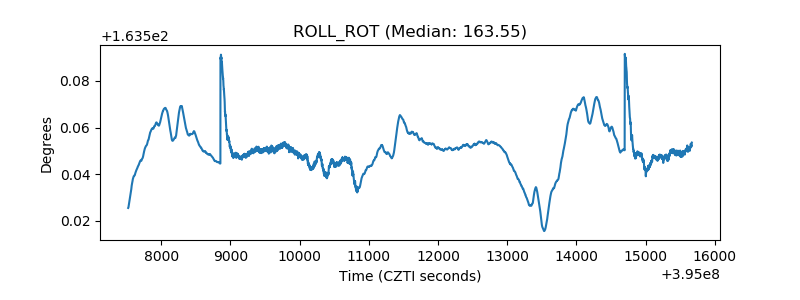 |
| _Roll_DEC | 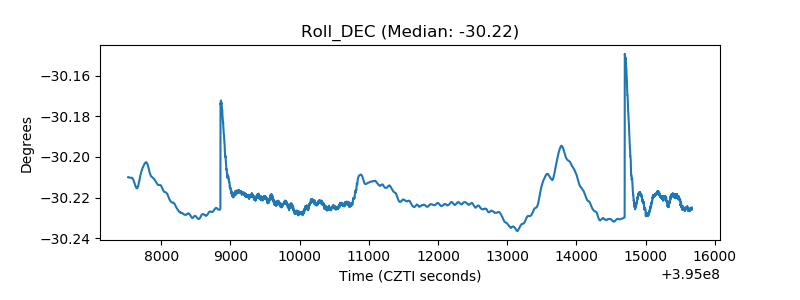 |
| _Roll_RA | 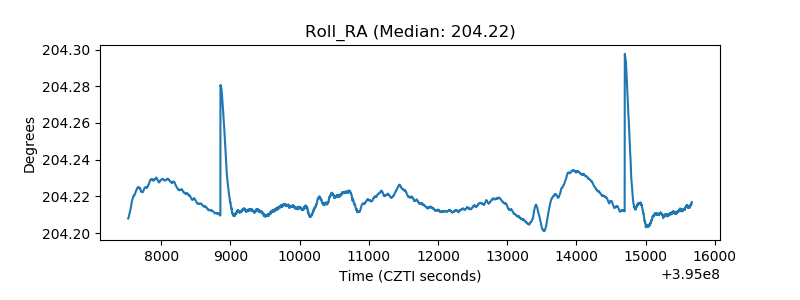 |
| Veto Counter | 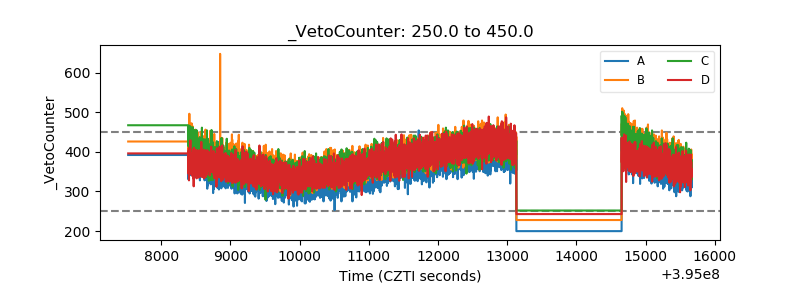 |