| Param | Original file | Final file |
|---|---|---|
| Filename | modeM0/AS1A11_049T04_9000005230_36647cztM0_level2.evt | modeM0/AS1A11_049T04_9000005230_36647cztM0_level2_quad_clean.evt |
| Size (bytes) | 417,720,960 | 58,294,080 |
| Size | 398.4 MB | 55.6 MB |
| Events in quadrant A | 2,764,633 | 358,905 |
| Events in quadrant B | 2,831,497 | 356,008 |
| Events in quadrant C | 3,361,299 | 341,502 |
| Events in quadrant D | 3,325,030 | 329,056 |
| Mode M0 | |||
|---|---|---|---|
| Quadrant | BADHDUFLAG | Total packets | Discarded packets |
| A | 0 | 11564 | 3 |
| B | 0 | 11785 | 2 |
| C | 0 | 13212 | 2 |
| D | 0 | 13681 | 2 |
| Mode M9 | |||
|---|---|---|---|
| Quadrant | BADHDUFLAG | Total packets | Discarded packets |
| A | 0 | 25 | 0 |
| B | 0 | 25 | 0 |
| C | 0 | 25 | 0 |
| D | 0 | 26 | 0 |
| Mode SS | |||
|---|---|---|---|
| Quadrant | BADHDUFLAG | Total packets | Discarded packets |
| A | 0 | 110 | 0 |
| B | 0 | 110 | 0 |
| C | 0 | 110 | 0 |
| D | 0 | 110 | 0 |
| Quadrant | Total seconds | Saturated seconds | Saturation percentage |
|---|---|---|---|
| A | 5417 | 14 | 0.258446% |
| B | 5417 | 81 | 1.495293% |
| C | 5417 | 186 | 3.433635% |
| D | 5417 | 168 | 3.101348% |
Noise dominated data is calculated using 1-second bins in cleaned event files. If a bin has >2000 counts, and if more than 50% of those come from <1% of pixels, then it is considered to be noise-dominated and hence unusable.
| Quadrant | # 1 sec bins | Bins with >0 counts | Bins with >2000 counts | High rate bins dominated by noise | Noise dominated (total time) | Noise dominated (detector-on time) | Marked lightcurve |
|---|---|---|---|---|---|---|---|
| A | 7091 | 5418 | 5 | 5 | 0.07% | 0.09% | 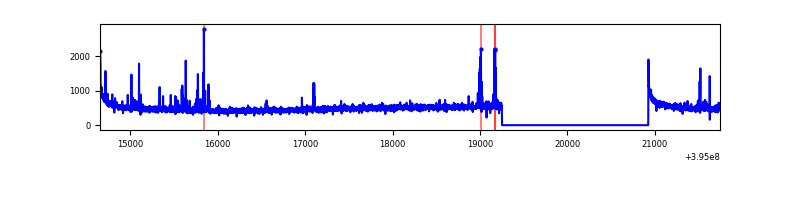 |
| B | 7091 | 5418 | 57 | 57 | 0.80% | 1.05% |  |
| C | 7091 | 5418 | 138 | 138 | 1.95% | 2.55% | 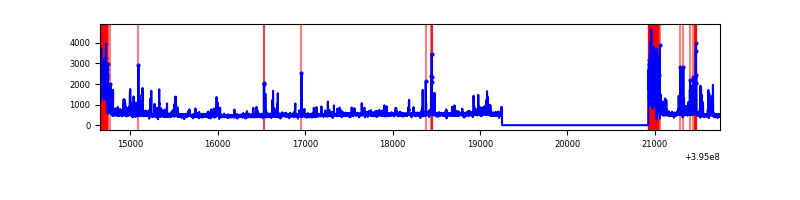 |
| D | 7091 | 5418 | 120 | 120 | 1.69% | 2.21% | 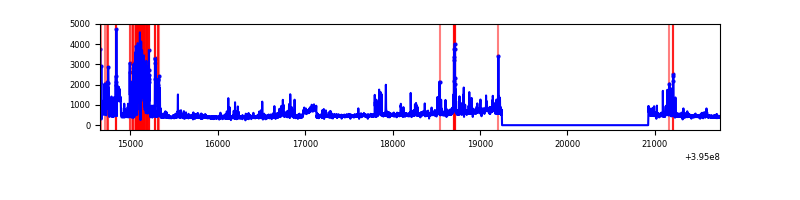 |
Top three noisy pixels from each quadrant. If the there are fewer than three noisy pixels in the level2.evt file, extra rows are filled as -1
| Pixel properties | Quadrant properties | ||||||
|---|---|---|---|---|---|---|---|
| Quadrant | DetID | PixID | Counts | Sigma | Mean | Median | Sigma |
| A | 10 | 83 | 205655 | 1604.9 | 632 | 622 | 127.8 |
| A | 9 | 143 | 91536 | 711.63 | 632 | 622 | 127.8 |
| A | 13 | 6 | 11609 | 86.0 | 632 | 622 | 127.8 |
| B | 0 | 190 | 137045 | 1132.5 | 625 | 609 | 120.5 |
| B | 5 | 255 | 104033 | 858.48 | 625 | 609 | 120.5 |
| B | 0 | 199 | 53780 | 441.35 | 625 | 609 | 120.5 |
| C | 0 | 10 | 545592 | 3853.65 | 602 | 606 | 141.4 |
| C | 15 | 214 | 227855 | 1606.9 | 602 | 606 | 141.4 |
| C | 0 | 207 | 86647 | 608.4 | 602 | 606 | 141.4 |
| D | 12 | 6 | 401534 | 2719.34 | 602 | 587 | 147.4 |
| D | 7 | 223 | 97095 | 654.55 | 602 | 587 | 147.4 |
| D | 1 | 20 | 83723 | 563.85 | 602 | 587 | 147.4 |
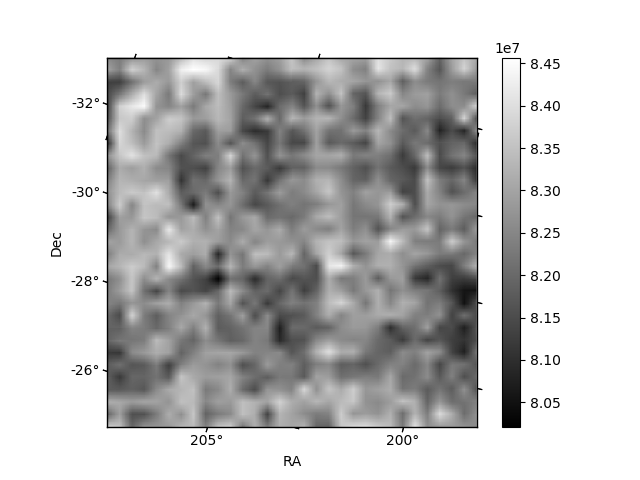
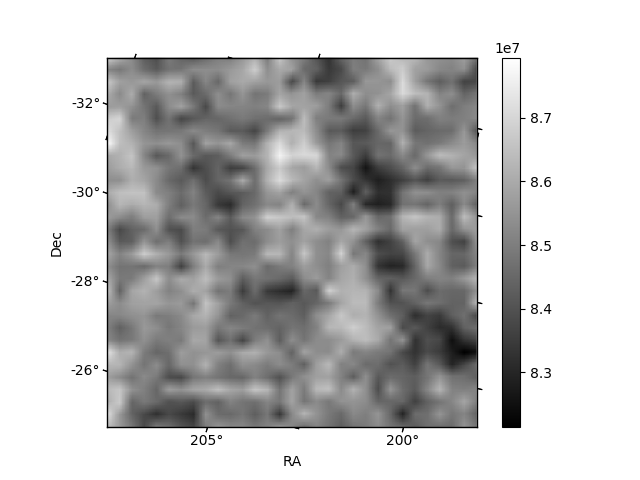
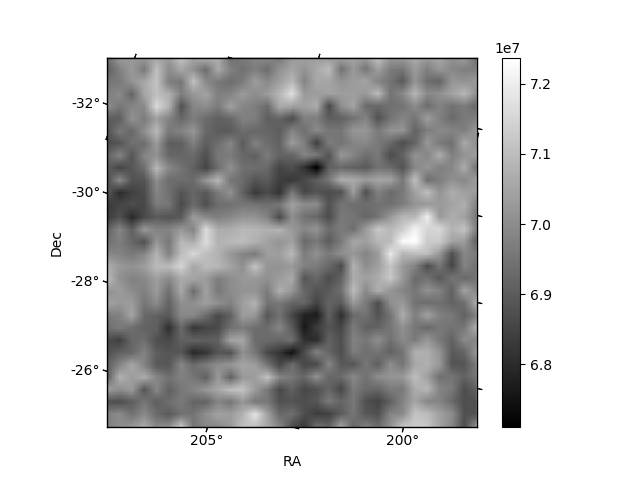
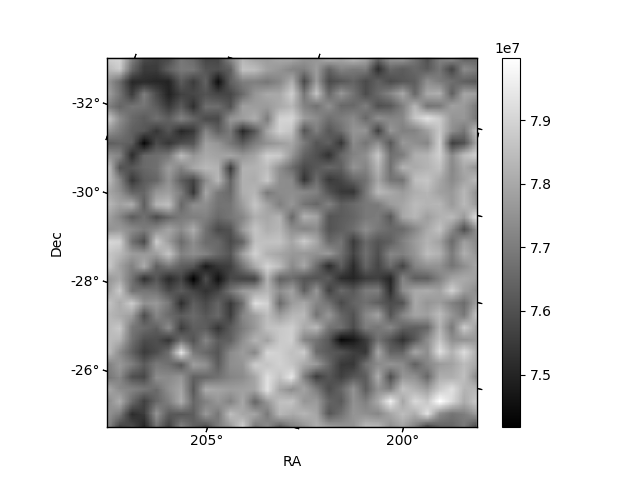
Histogram calculated using DETX and DETY for each event in the final _common_clean file
| Quadrant A | 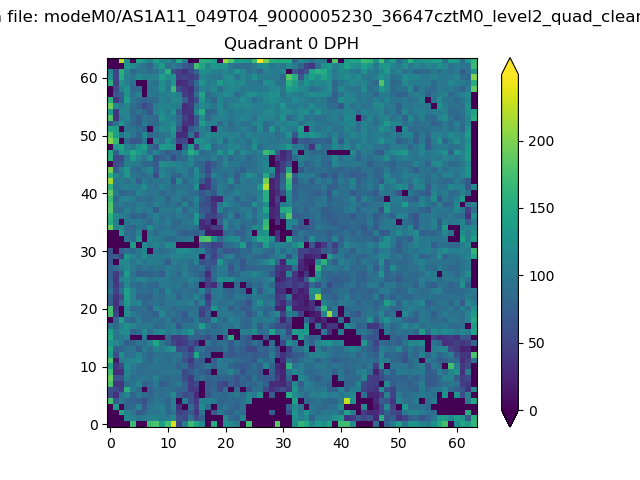 |
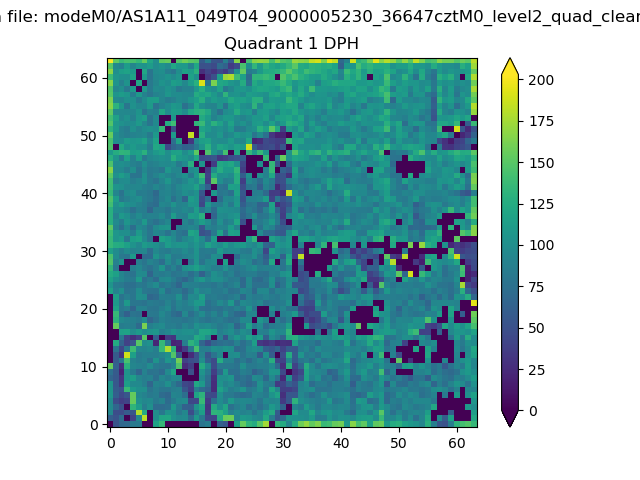 |
Quadrant B |
|---|---|---|---|
| Quadrant D |  |
 |
Quadrant C |
| Plot type | Count rate plots | Images |
|---|---|---|
| Comparison with Poisson distribution Blue bars denote a histogram of data divided into 1 sec bins. Red curve is a Poisson curve with rate = median count rate of data. |
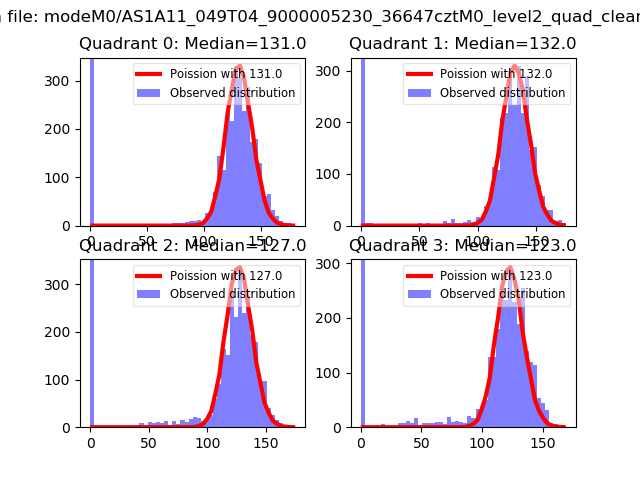 |
 |
| Quadrant-wise count rates Data is divided into 100 sec bins |
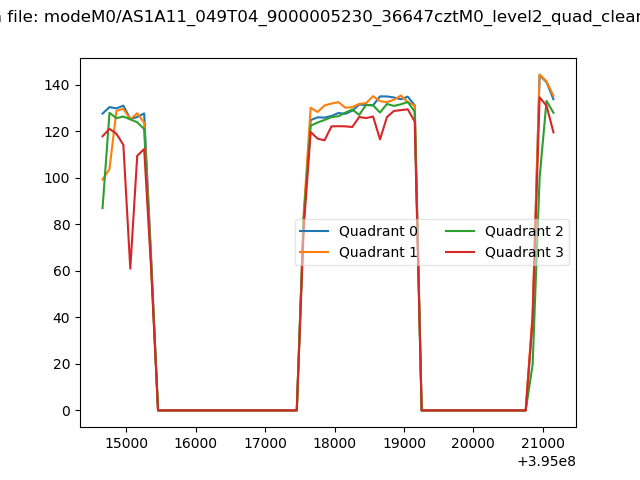 |
|
| Module-wise count rates for Quadrant A Data is divided into 100 sec bins |
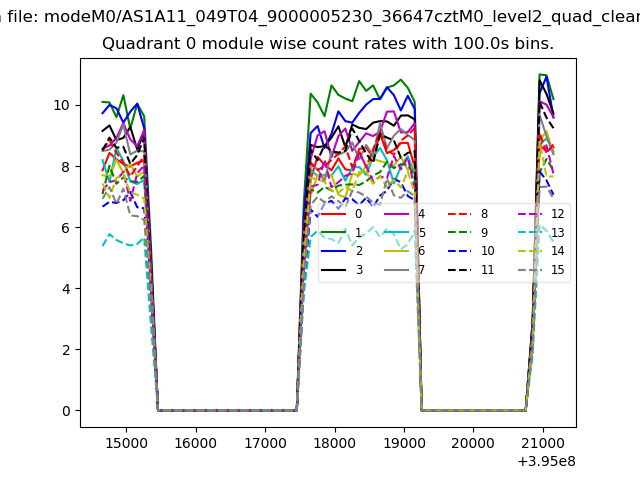 |
 |
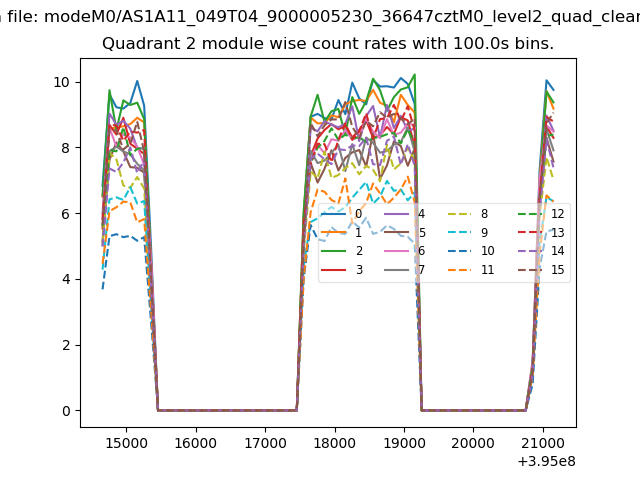
| Module-wise count rates for Quadrant B Data is divided into 100 sec bins |
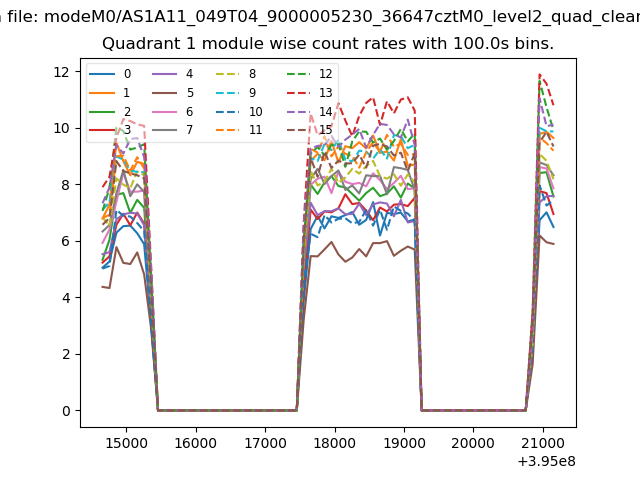 |
 |
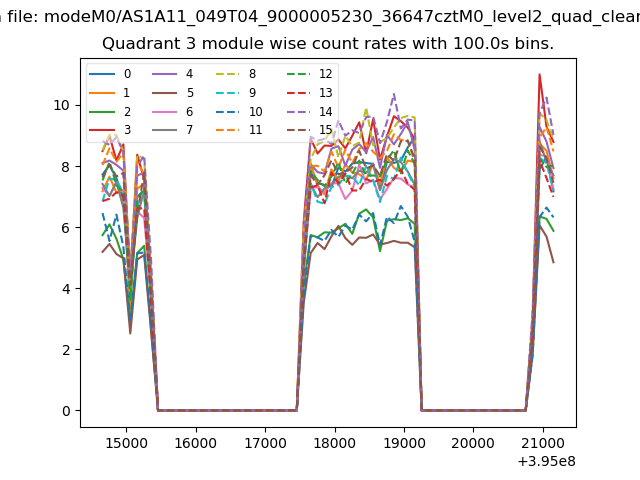
| Module-wise count rates for Quadrant C Data is divided into 100 sec bins |
 |
 |
| Module-wise count rates for Quadrant D Data is divided into 100 sec bins |
 |
 |
| Parameter | Plot |
|---|---|
| CZT HV Monitor | 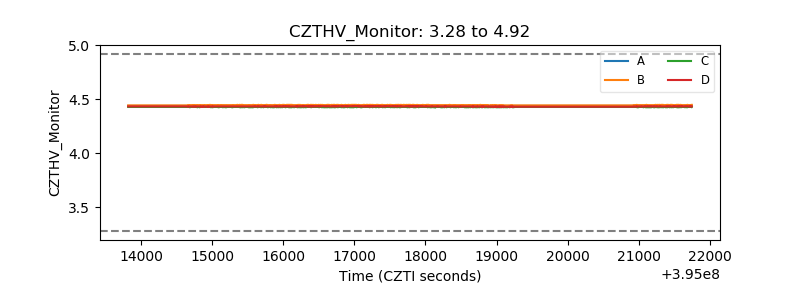 |
| D_VDD | 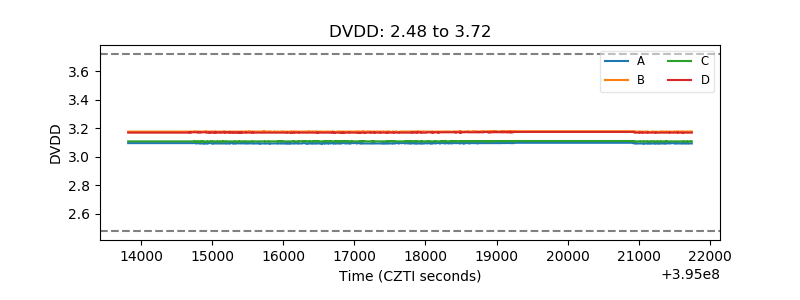 |
| Temperature 1 | 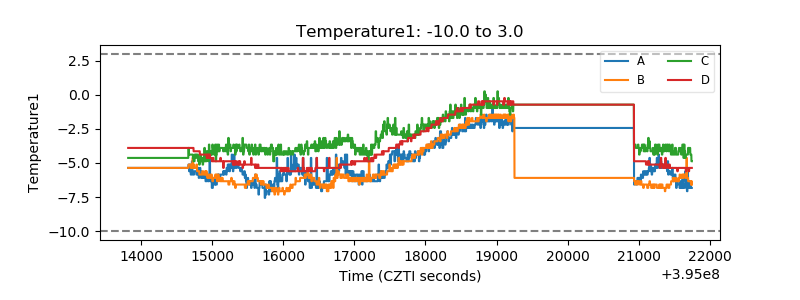 |
| Veto HV Monitor |  |
| Veto LLD |  |
| Alpha Counter | 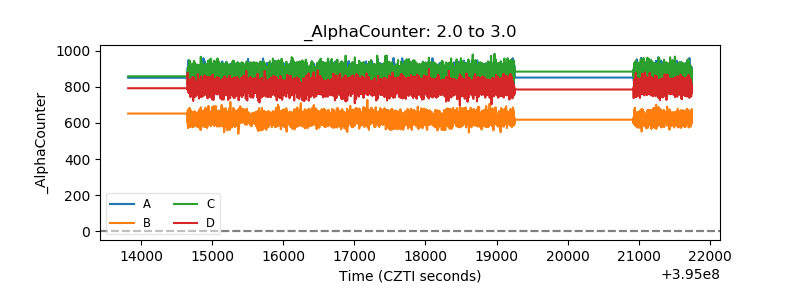 |
| _CPM_Rate | 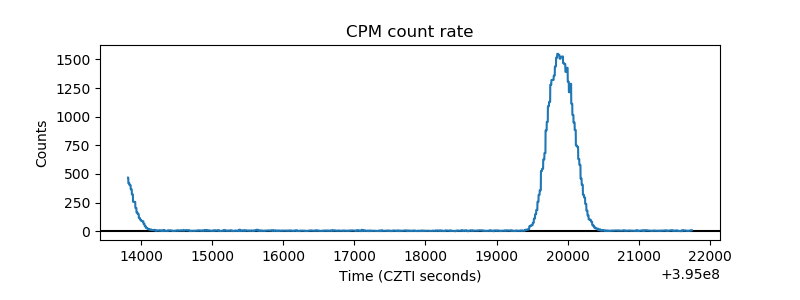 |
| CZT Counter | 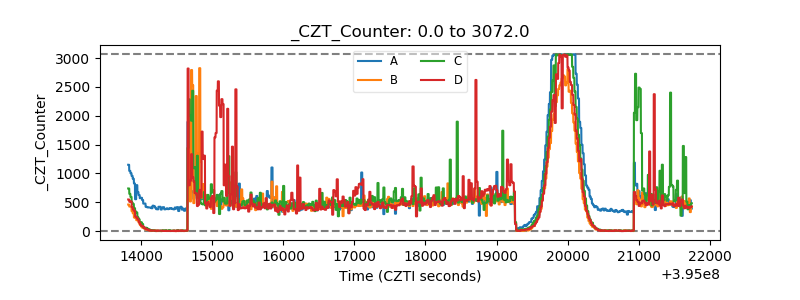 |
| +2.5 Volts monitor |  |
| +5 Volts monitor | 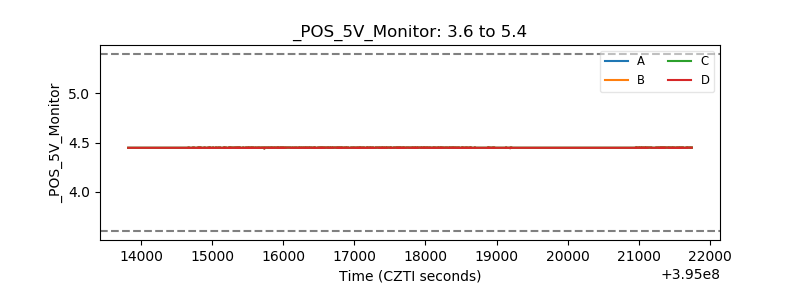 |
| _ROLL_ROT | 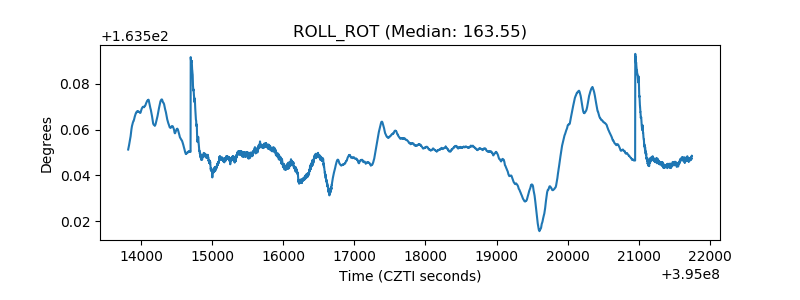 |
| _Roll_DEC | 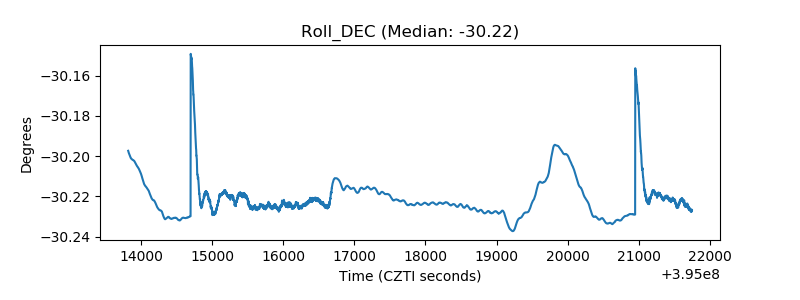 |
| _Roll_RA | 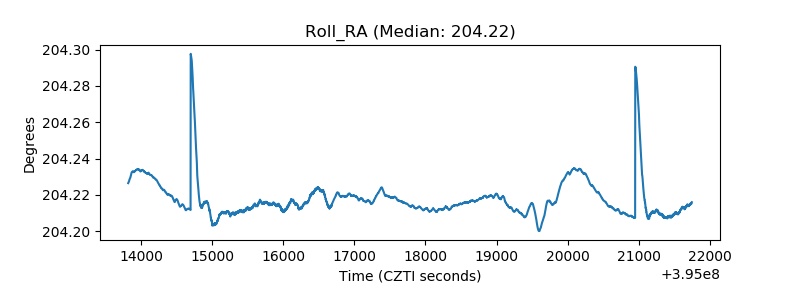 |
| Veto Counter | 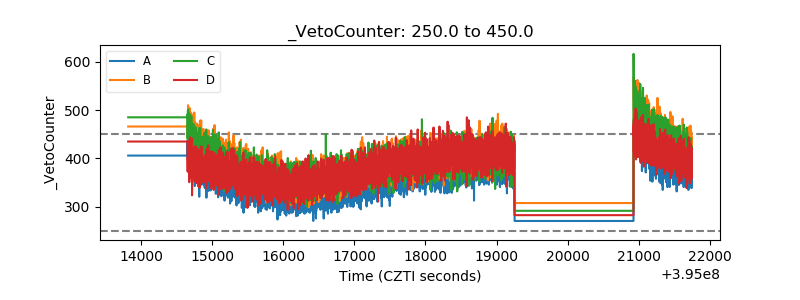 |