| Param | Original file | Final file |
|---|---|---|
| Filename | modeM0/AS1A11_049T04_9000005230_36649cztM0_level2.evt | modeM0/AS1A11_049T04_9000005230_36649cztM0_level2_quad_clean.evt |
| Size (bytes) | 406,563,840 | 51,753,600 |
| Size | 387.7 MB | 49.4 MB |
| Events in quadrant A | 2,819,159 | 305,865 |
| Events in quadrant B | 2,625,802 | 309,431 |
| Events in quadrant C | 3,465,668 | 293,689 |
| Events in quadrant D | 3,039,857 | 284,450 |
| Mode M0 | |||
|---|---|---|---|
| Quadrant | BADHDUFLAG | Total packets | Discarded packets |
| A | 0 | 11541 | 3 |
| B | 0 | 11006 | 2 |
| C | 0 | 13370 | 2 |
| D | 0 | 12603 | 2 |
| Mode M9 | |||
|---|---|---|---|
| Quadrant | BADHDUFLAG | Total packets | Discarded packets |
| A | 0 | 28 | 0 |
| B | 0 | 28 | 0 |
| C | 0 | 28 | 0 |
| D | 0 | 29 | 0 |
| Mode SS | |||
|---|---|---|---|
| Quadrant | BADHDUFLAG | Total packets | Discarded packets |
| A | 0 | 108 | 0 |
| B | 0 | 108 | 0 |
| C | 0 | 108 | 0 |
| D | 0 | 108 | 0 |
| Quadrant | Total seconds | Saturated seconds | Saturation percentage |
|---|---|---|---|
| A | 5332 | 26 | 0.487622% |
| B | 5332 | 10 | 0.187547% |
| C | 5332 | 234 | 4.388597% |
| D | 5332 | 82 | 1.537884% |
Noise dominated data is calculated using 1-second bins in cleaned event files. If a bin has >2000 counts, and if more than 50% of those come from <1% of pixels, then it is considered to be noise-dominated and hence unusable.
| Quadrant | # 1 sec bins | Bins with >0 counts | Bins with >2000 counts | High rate bins dominated by noise | Noise dominated (total time) | Noise dominated (detector-on time) | Marked lightcurve |
|---|---|---|---|---|---|---|---|
| A | 7125 | 5333 | 15 | 15 | 0.21% | 0.28% | 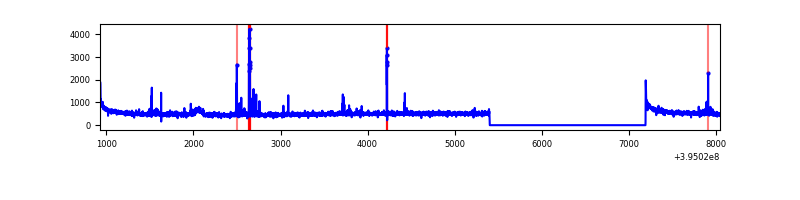 |
| B | 7125 | 5333 | 2 | 2 | 0.03% | 0.04% | 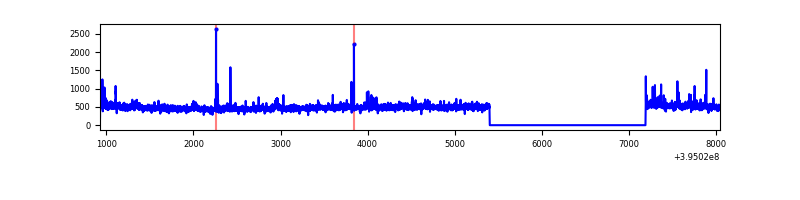 |
| C | 7125 | 5333 | 155 | 155 | 2.18% | 2.91% | 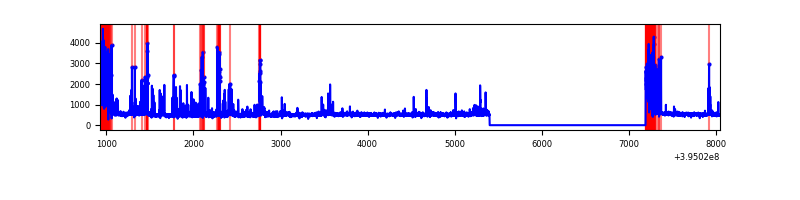 |
| D | 7125 | 5333 | 60 | 60 | 0.84% | 1.13% | 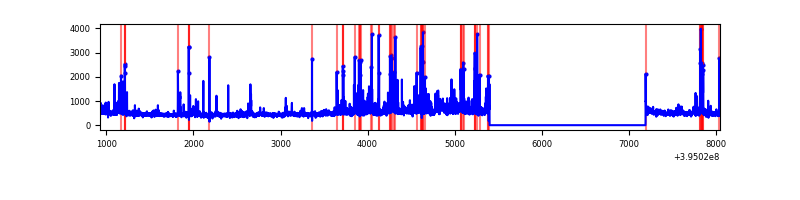 |
Top three noisy pixels from each quadrant. If the there are fewer than three noisy pixels in the level2.evt file, extra rows are filled as -1
| Pixel properties | Quadrant properties | ||||||
|---|---|---|---|---|---|---|---|
| Quadrant | DetID | PixID | Counts | Sigma | Mean | Median | Sigma |
| A | 10 | 83 | 203707 | 1586.18 | 640 | 628 | 128.0 |
| A | 9 | 143 | 133079 | 1034.53 | 640 | 628 | 128.0 |
| A | 13 | 6 | 9591 | 70.01 | 640 | 628 | 128.0 |
| B | 0 | 221 | 33593 | 270.17 | 638 | 622 | 122.0 |
| B | 0 | 199 | 31523 | 253.2 | 638 | 622 | 122.0 |
| B | 5 | 172 | 24796 | 198.08 | 638 | 622 | 122.0 |
| C | 0 | 10 | 579685 | 4120.58 | 607 | 611 | 140.5 |
| C | 15 | 214 | 223403 | 1585.35 | 607 | 611 | 140.5 |
| C | 0 | 207 | 180366 | 1279.1 | 607 | 611 | 140.5 |
| D | 13 | 171 | 141239 | 948.09 | 614 | 598 | 148.3 |
| D | 12 | 6 | 127690 | 856.75 | 614 | 598 | 148.3 |
| D | 13 | 249 | 126676 | 849.91 | 614 | 598 | 148.3 |
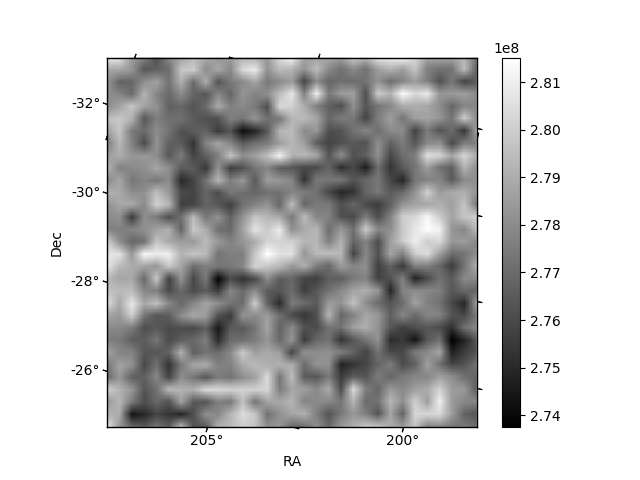
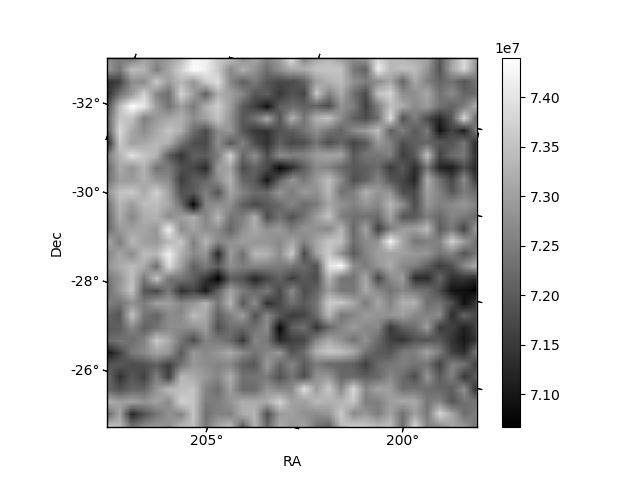
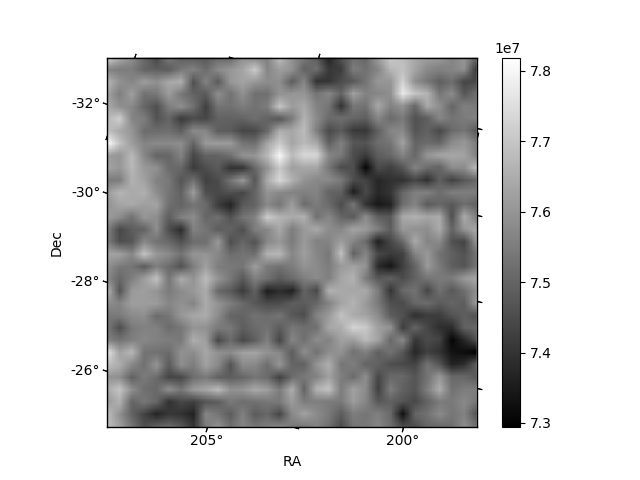
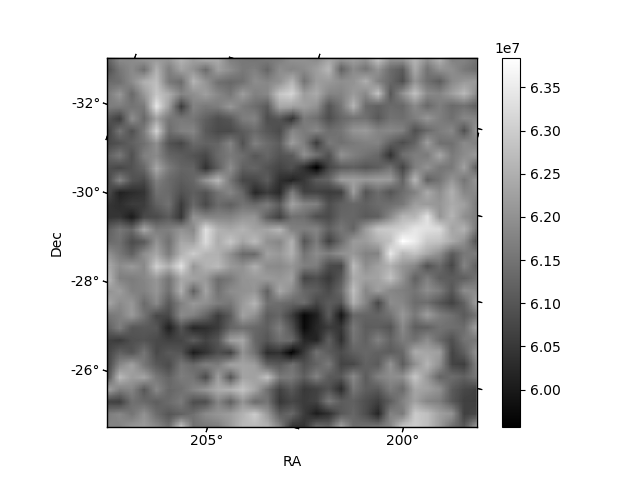
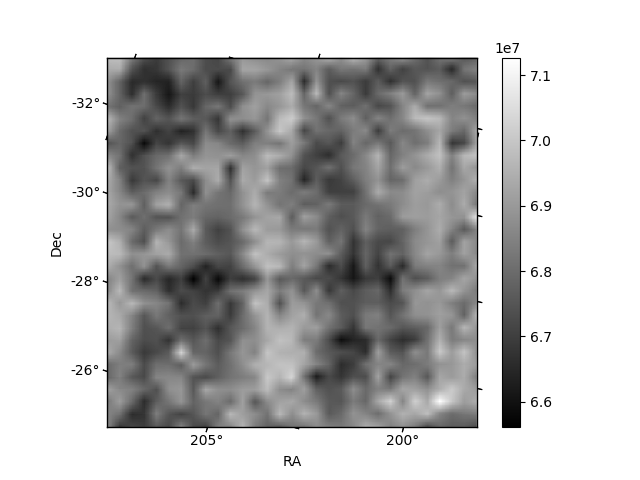
Histogram calculated using DETX and DETY for each event in the final _common_clean file
| Quadrant A | 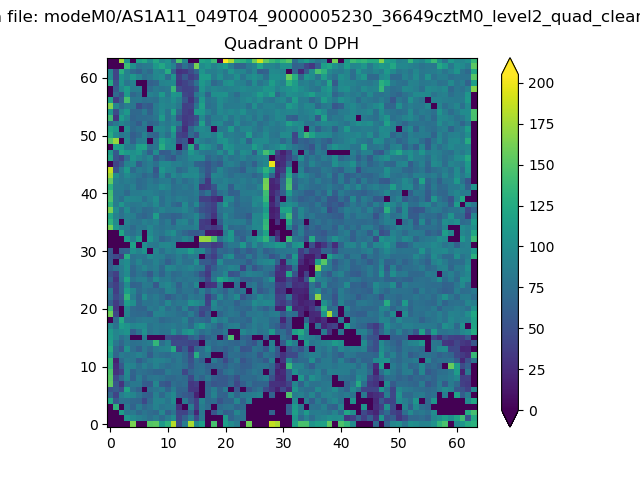 |
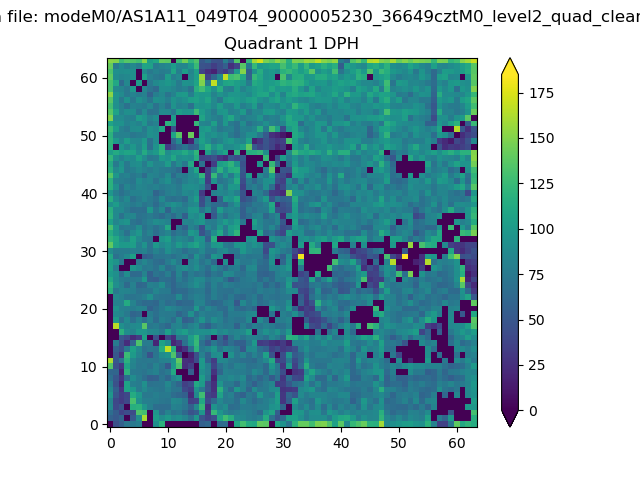 |
Quadrant B |
|---|---|---|---|
| Quadrant D |  |
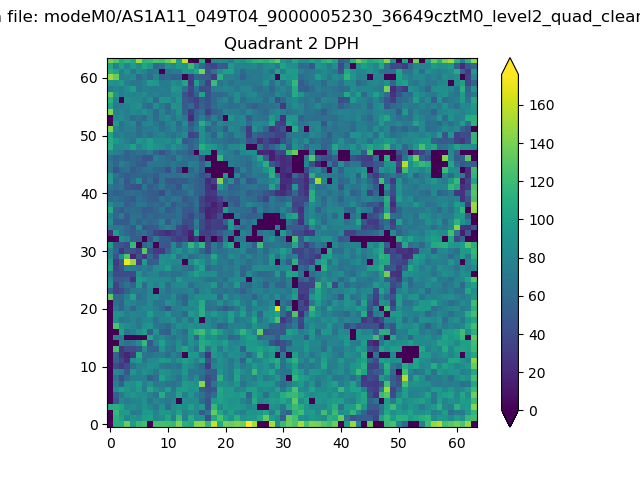 |
Quadrant C |
| Plot type | Count rate plots | Images |
|---|---|---|
| Comparison with Poisson distribution Blue bars denote a histogram of data divided into 1 sec bins. Red curve is a Poisson curve with rate = median count rate of data. |
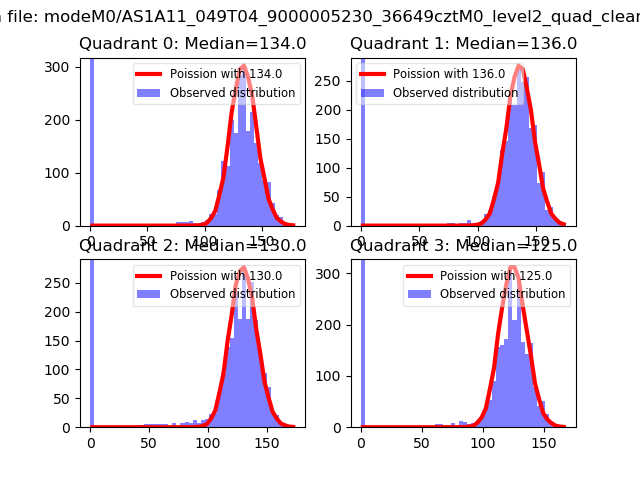 |
 |
| Quadrant-wise count rates Data is divided into 100 sec bins |
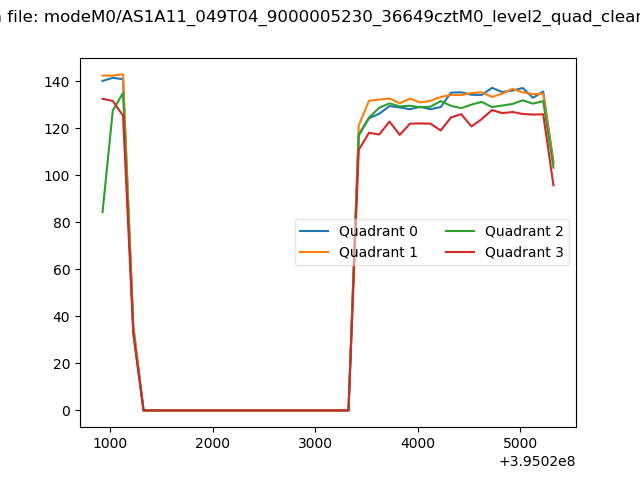 |
|
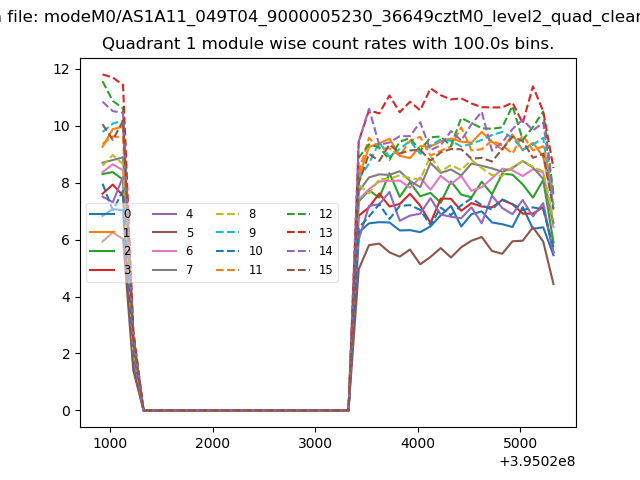
| Module-wise count rates for Quadrant A Data is divided into 100 sec bins |
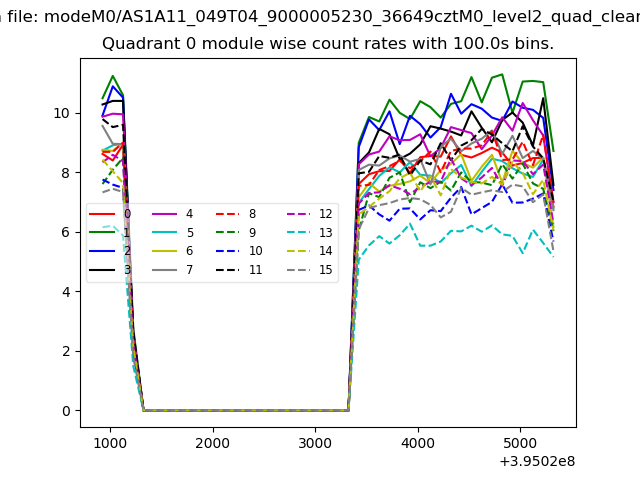 |
 |
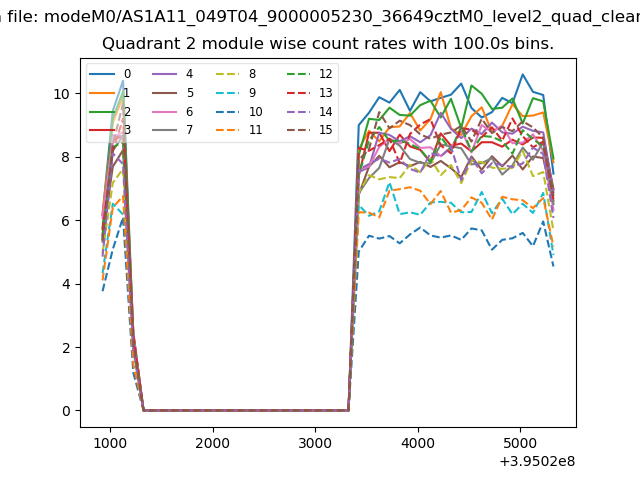
| Module-wise count rates for Quadrant B Data is divided into 100 sec bins |
 |
 |
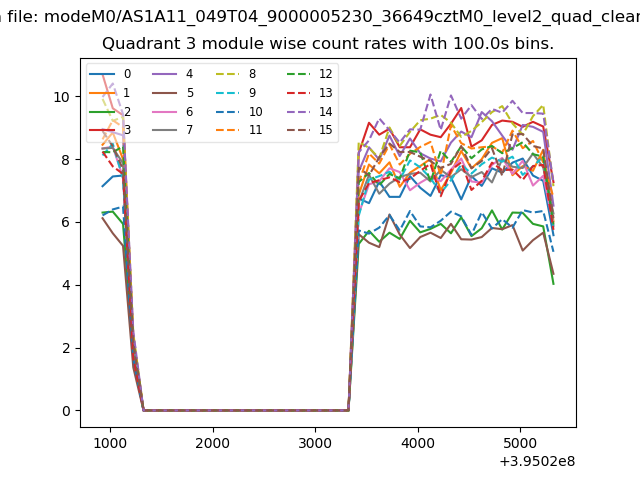
| Module-wise count rates for Quadrant C Data is divided into 100 sec bins |
 |
 |
| Module-wise count rates for Quadrant D Data is divided into 100 sec bins |
 |
 |
| Parameter | Plot |
|---|---|
| CZT HV Monitor | 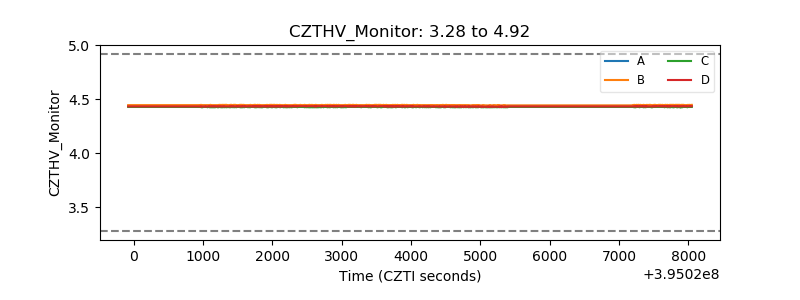 |
| D_VDD | 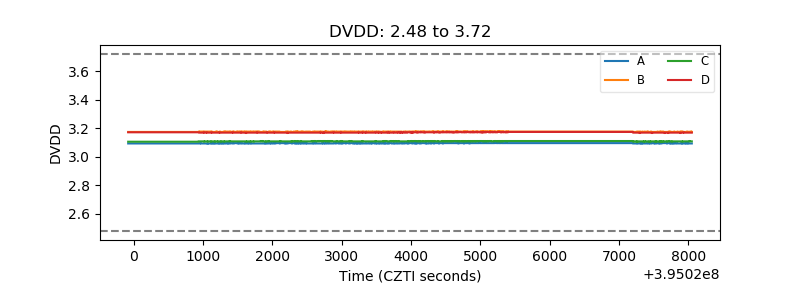 |
| Temperature 1 | 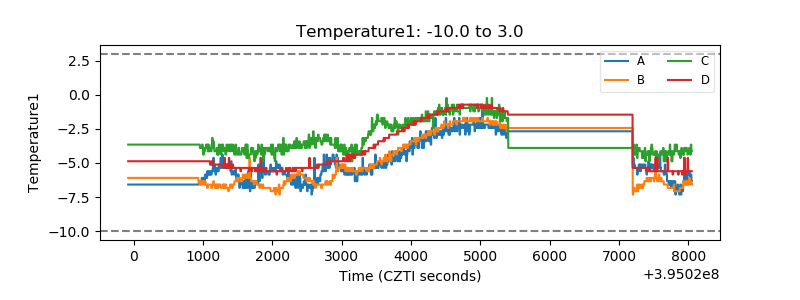 |
| Veto HV Monitor |  |
| Veto LLD | 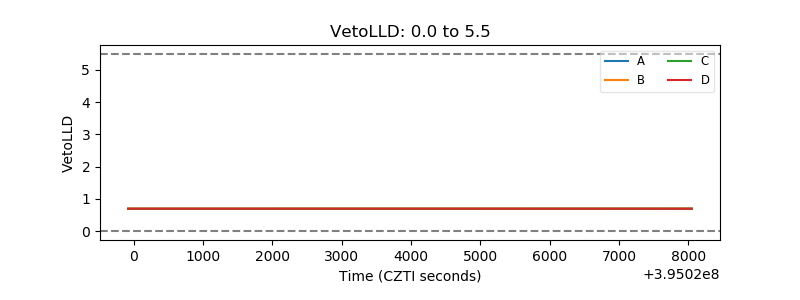 |
| Alpha Counter | 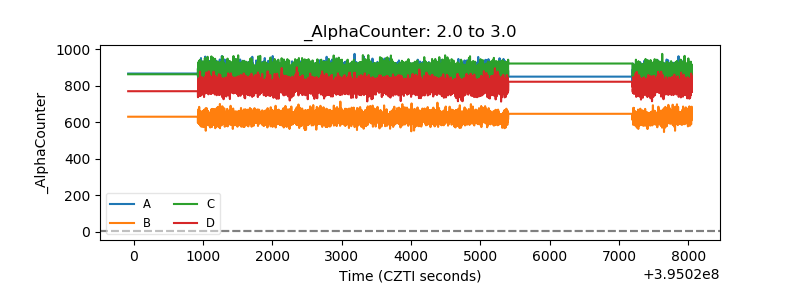 |
| _CPM_Rate |  |
| CZT Counter | 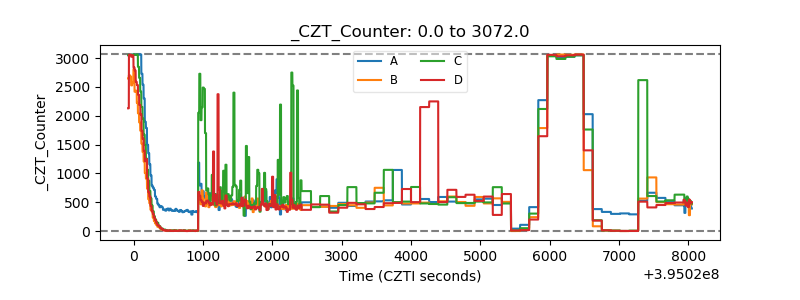 |
| +2.5 Volts monitor | 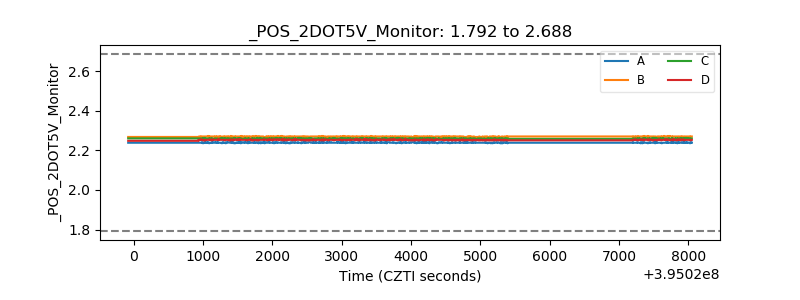 |
| +5 Volts monitor | 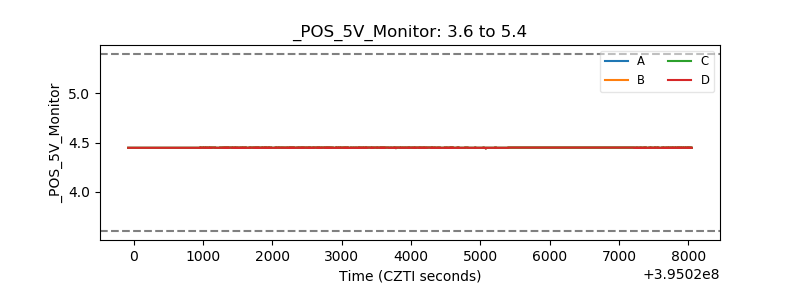 |
| _ROLL_ROT | 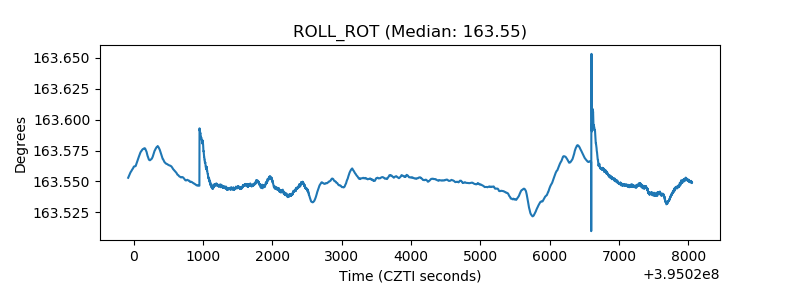 |
| _Roll_DEC | 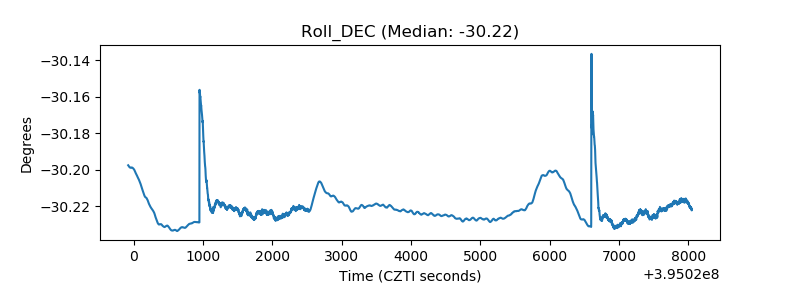 |
| _Roll_RA | 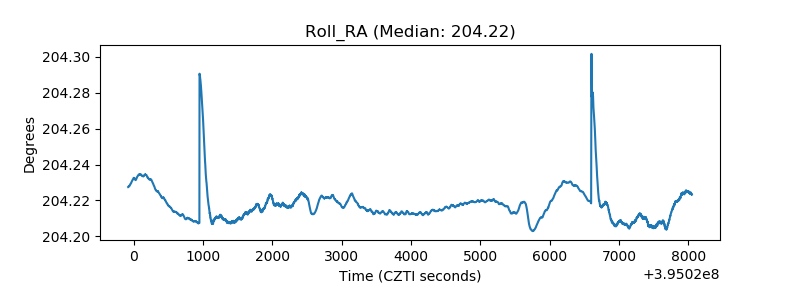 |
| Veto Counter | 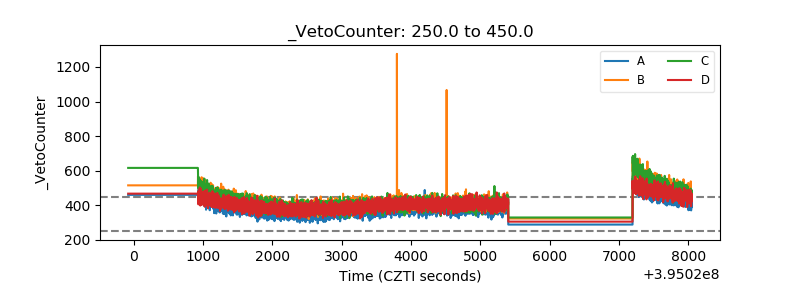 |