| Param | Original file | Final file |
|---|---|---|
| Filename | modeM0/AS1A11_049T04_9000005230_36650cztM0_level2.evt | modeM0/AS1A11_049T04_9000005230_36650cztM0_level2_quad_clean.evt |
| Size (bytes) | 431,009,280 | 51,431,040 |
| Size | 411.0 MB | 49.0 MB |
| Events in quadrant A | 2,799,710 | 307,488 |
| Events in quadrant B | 2,732,508 | 310,785 |
| Events in quadrant C | 3,845,523 | 288,715 |
| Events in quadrant D | 3,319,575 | 282,889 |
| Mode M0 | |||
|---|---|---|---|
| Quadrant | BADHDUFLAG | Total packets | Discarded packets |
| A | 0 | 11303 | 3 |
| B | 0 | 11135 | 2 |
| C | 0 | 14453 | 2 |
| D | 0 | 13123 | 2 |
| Mode M9 | |||
|---|---|---|---|
| Quadrant | BADHDUFLAG | Total packets | Discarded packets |
| A | 0 | 31 | 0 |
| B | 0 | 31 | 0 |
| C | 0 | 31 | 0 |
| D | 0 | 32 | 0 |
| Mode SS | |||
|---|---|---|---|
| Quadrant | BADHDUFLAG | Total packets | Discarded packets |
| A | 0 | 108 | 0 |
| B | 0 | 108 | 0 |
| C | 0 | 108 | 0 |
| D | 0 | 108 | 0 |
| Quadrant | Total seconds | Saturated seconds | Saturation percentage |
|---|---|---|---|
| A | 5232 | 7 | 0.133792% |
| B | 5232 | 16 | 0.305810% |
| C | 5232 | 397 | 7.587920% |
| D | 5232 | 145 | 2.771407% |
Noise dominated data is calculated using 1-second bins in cleaned event files. If a bin has >2000 counts, and if more than 50% of those come from <1% of pixels, then it is considered to be noise-dominated and hence unusable.
| Quadrant | # 1 sec bins | Bins with >0 counts | Bins with >2000 counts | High rate bins dominated by noise | Noise dominated (total time) | Noise dominated (detector-on time) | Marked lightcurve |
|---|---|---|---|---|---|---|---|
| A | 7175 | 5233 | 2 | 2 | 0.03% | 0.04% | 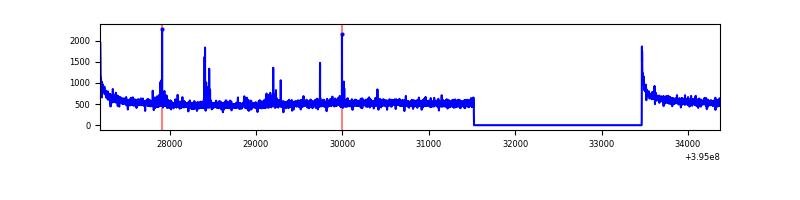 |
| B | 7175 | 5233 | 3 | 3 | 0.04% | 0.06% | 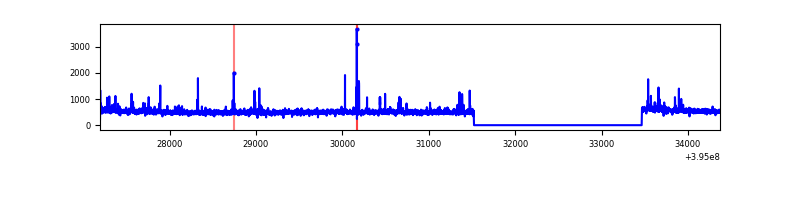 |
| C | 7175 | 5233 | 307 | 307 | 4.28% | 5.87% | 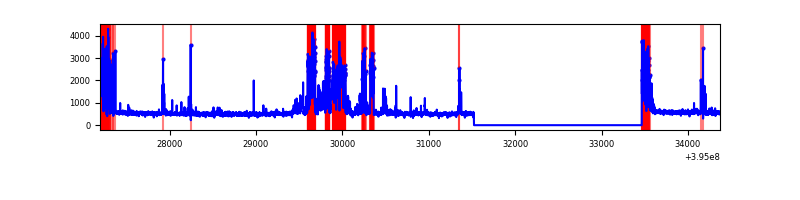 |
| D | 7175 | 5233 | 111 | 111 | 1.55% | 2.12% | 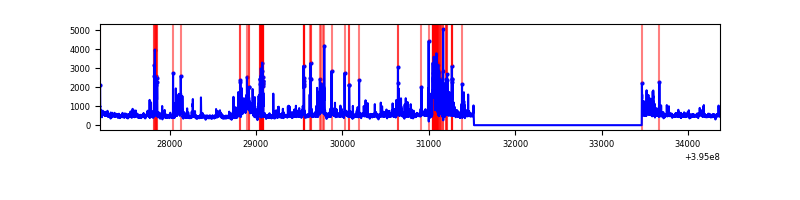 |
Top three noisy pixels from each quadrant. If the there are fewer than three noisy pixels in the level2.evt file, extra rows are filled as -1
| Pixel properties | Quadrant properties | ||||||
|---|---|---|---|---|---|---|---|
| Quadrant | DetID | PixID | Counts | Sigma | Mean | Median | Sigma |
| A | 10 | 83 | 203861 | 1543.99 | 660 | 647 | 131.6 |
| A | 9 | 143 | 32798 | 244.28 | 660 | 647 | 131.6 |
| A | 13 | 6 | 9674 | 68.59 | 660 | 647 | 131.6 |
| B | 5 | 255 | 38649 | 309.02 | 656 | 641 | 123.0 |
| B | 0 | 221 | 35442 | 282.94 | 656 | 641 | 123.0 |
| B | 0 | 199 | 35292 | 281.72 | 656 | 641 | 123.0 |
| C | 14 | 254 | 509980 | 3572.14 | 619 | 624 | 142.6 |
| C | 0 | 10 | 379006 | 2653.61 | 619 | 624 | 142.6 |
| C | 12 | 249 | 306889 | 2147.85 | 619 | 624 | 142.6 |
| D | 2 | 249 | 225656 | 1477.0 | 628 | 612 | 152.4 |
| D | 13 | 171 | 215753 | 1412.0 | 628 | 612 | 152.4 |
| D | 12 | 6 | 203894 | 1334.17 | 628 | 612 | 152.4 |
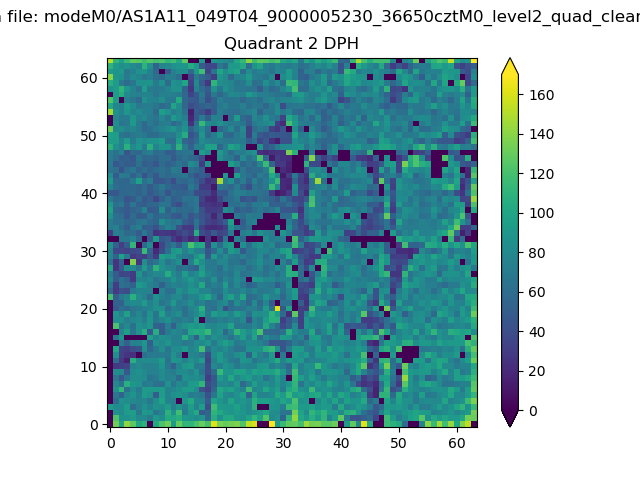
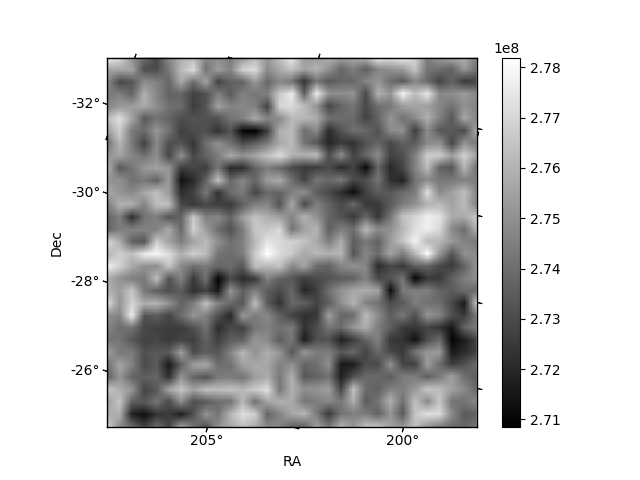
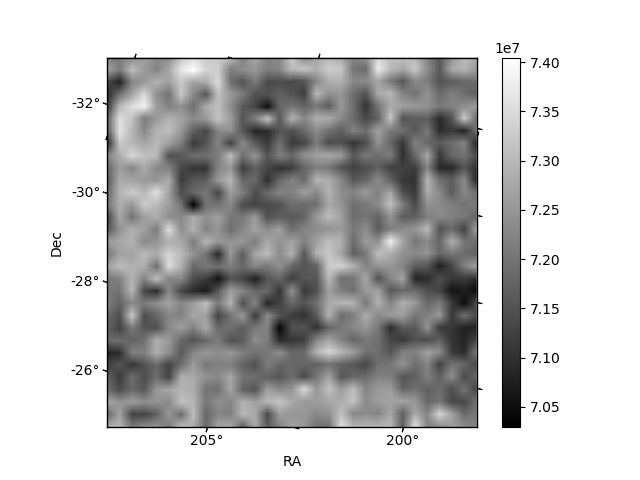
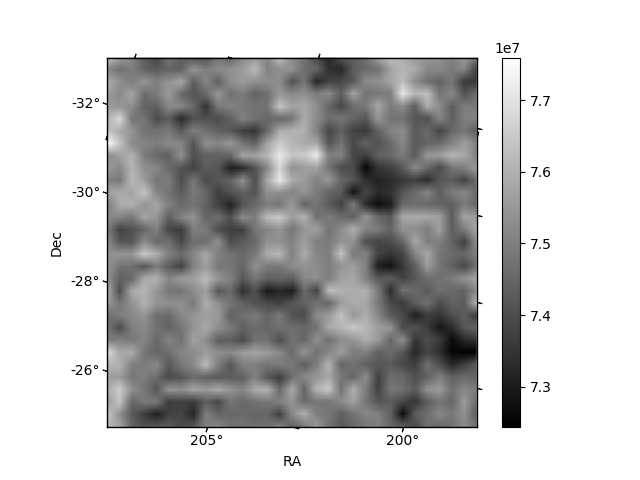
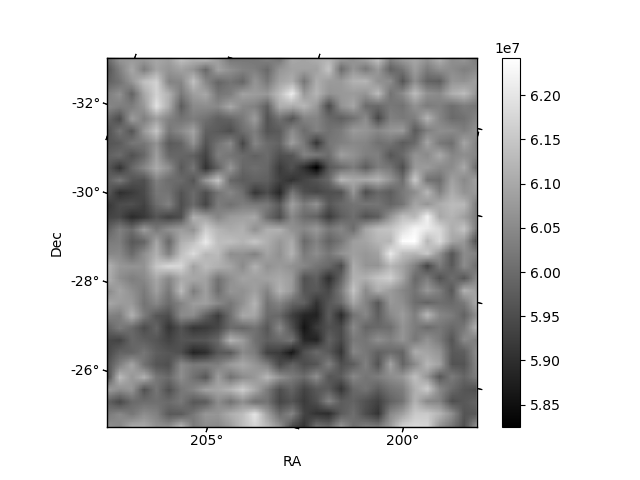
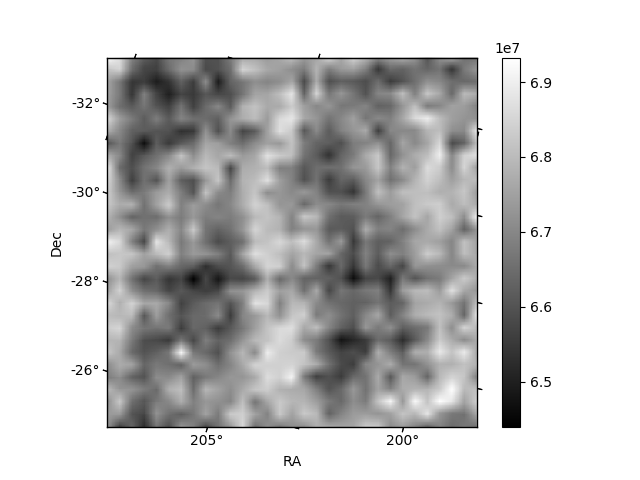
Histogram calculated using DETX and DETY for each event in the final _common_clean file
| Quadrant A | 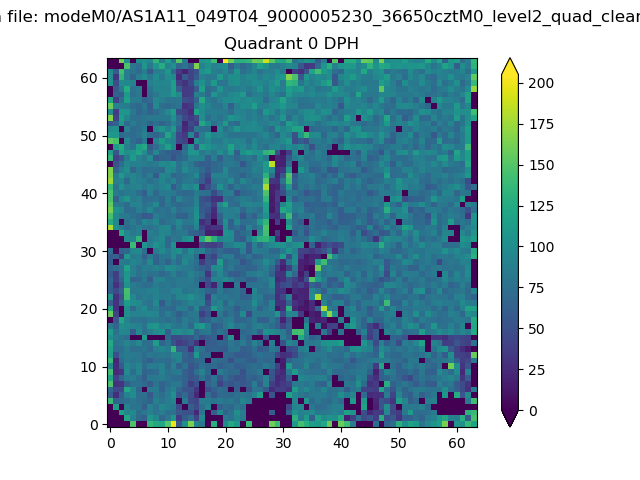 |
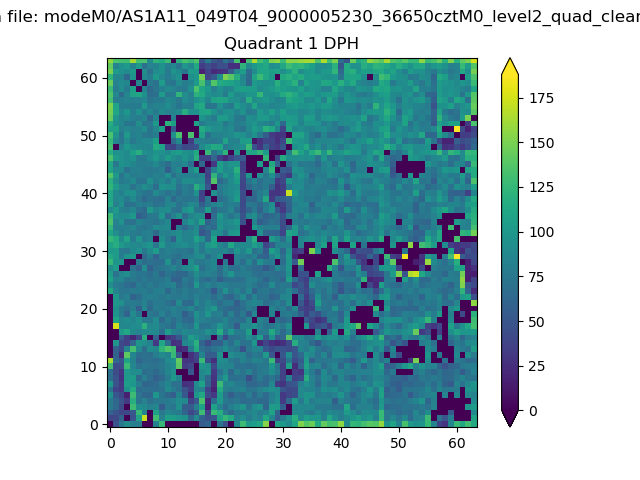 |
Quadrant B |
|---|---|---|---|
| Quadrant D | 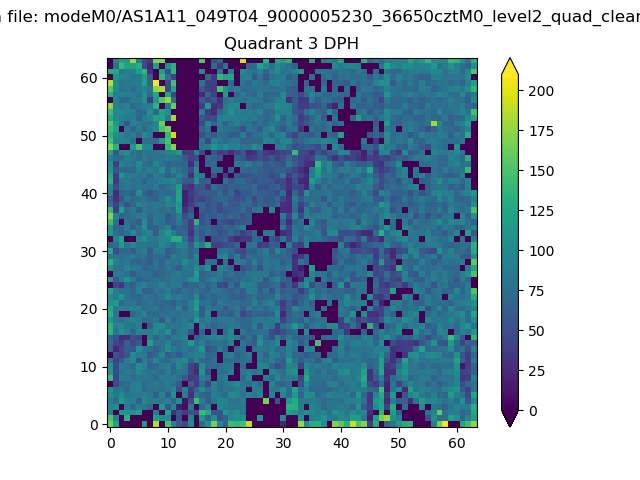 |
 |
Quadrant C |
| Plot type | Count rate plots | Images |
|---|---|---|
| Comparison with Poisson distribution Blue bars denote a histogram of data divided into 1 sec bins. Red curve is a Poisson curve with rate = median count rate of data. |
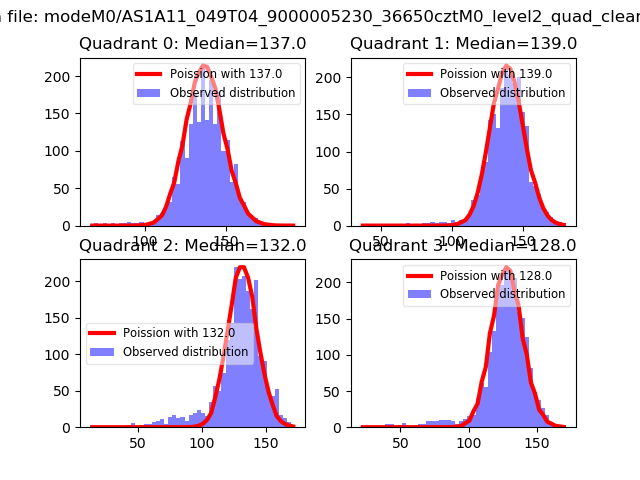 |
 |
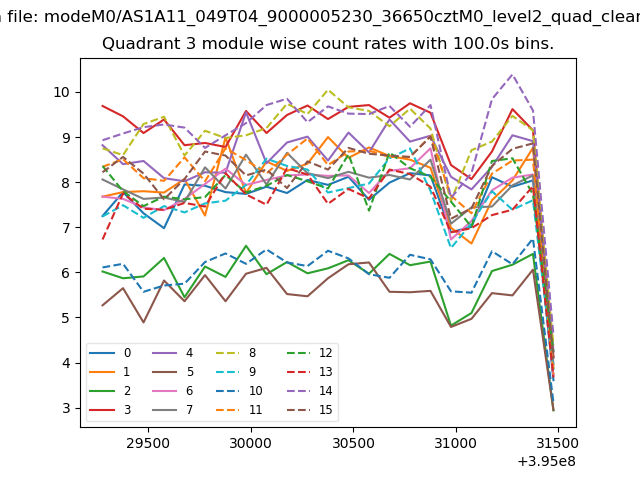
| Quadrant-wise count rates Data is divided into 100 sec bins |
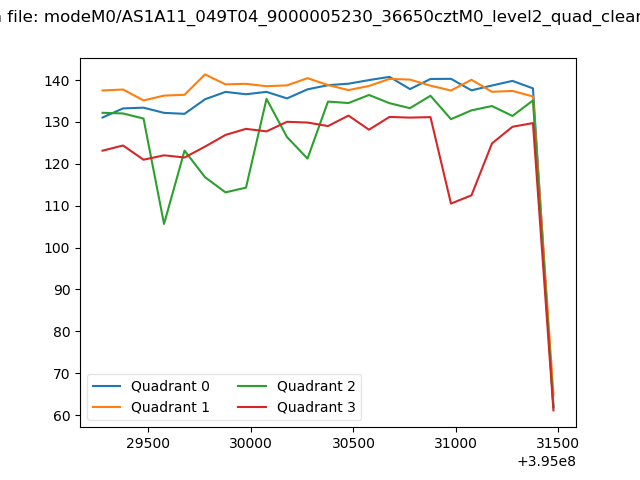 |
|
| Module-wise count rates for Quadrant A Data is divided into 100 sec bins |
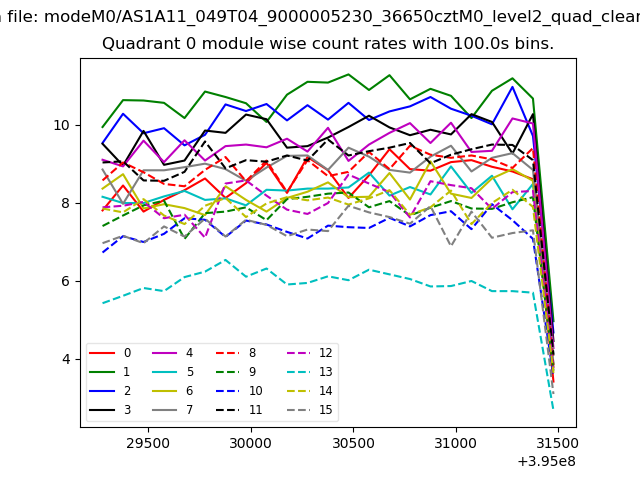 |
 |
| Module-wise count rates for Quadrant B Data is divided into 100 sec bins |
 |
 |
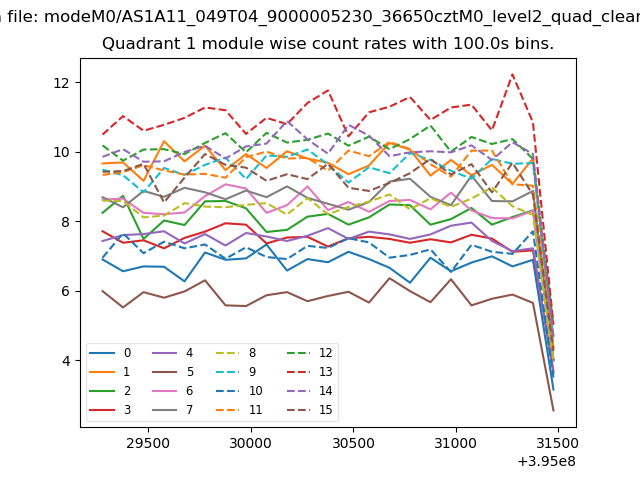
| Module-wise count rates for Quadrant C Data is divided into 100 sec bins |
 |
 |
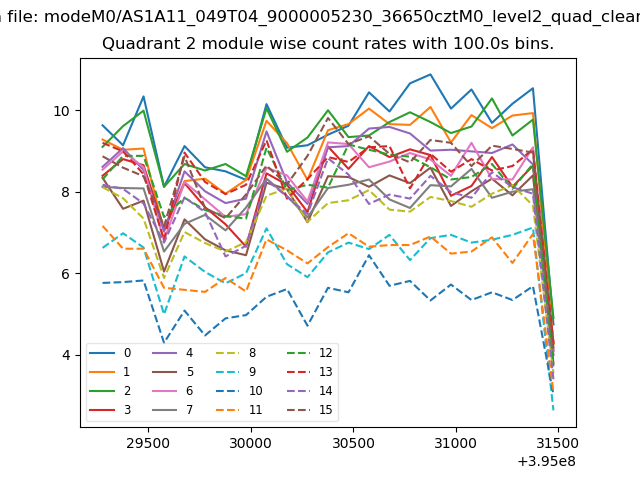
| Module-wise count rates for Quadrant D Data is divided into 100 sec bins |
 |
 |
| Parameter | Plot |
|---|---|
| CZT HV Monitor | 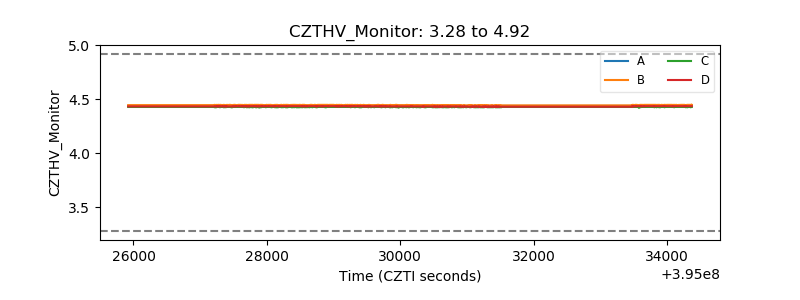 |
| D_VDD |  |
| Temperature 1 | 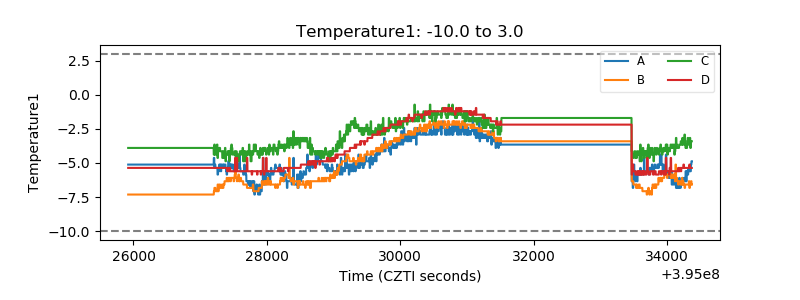 |
| Veto HV Monitor | 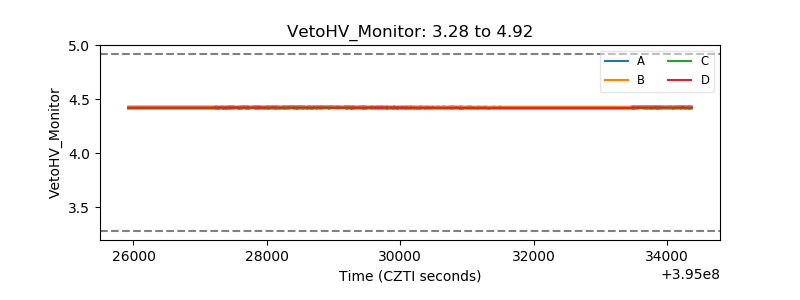 |
| Veto LLD | 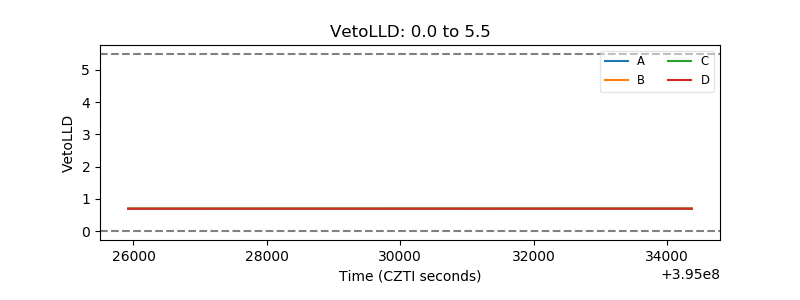 |
| Alpha Counter | 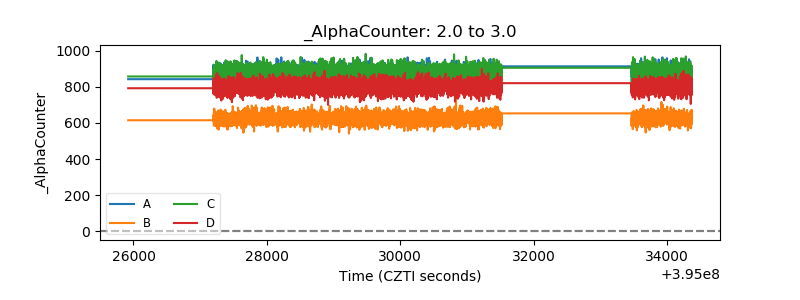 |
| _CPM_Rate | 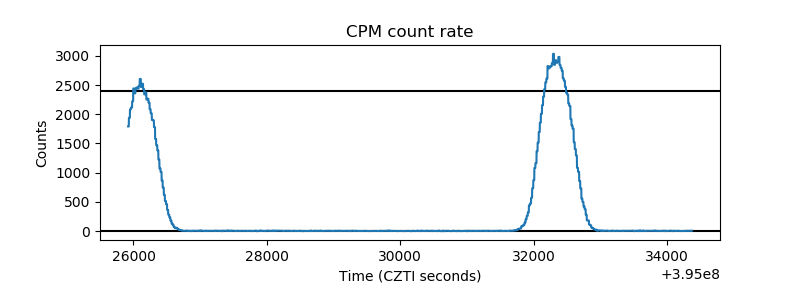 |
| CZT Counter | 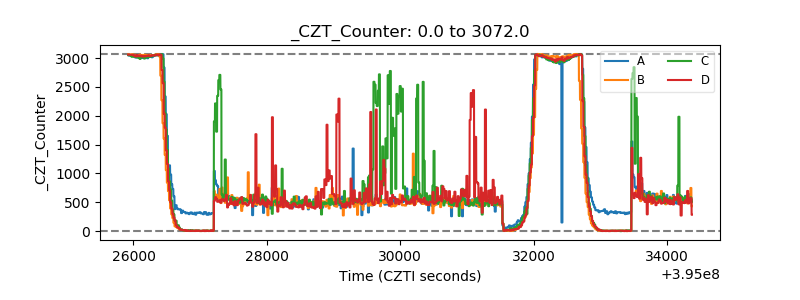 |
| +2.5 Volts monitor | 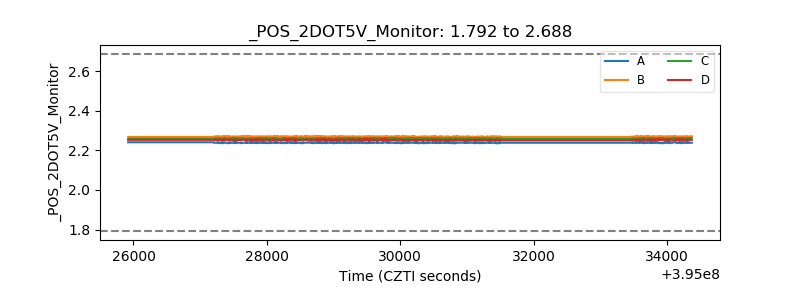 |
| +5 Volts monitor |  |
| _ROLL_ROT | 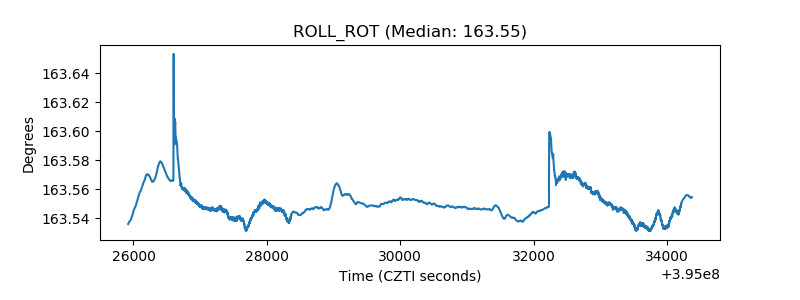 |
| _Roll_DEC | 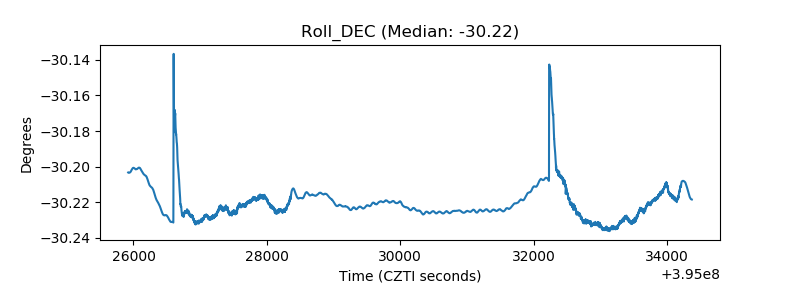 |
| _Roll_RA | 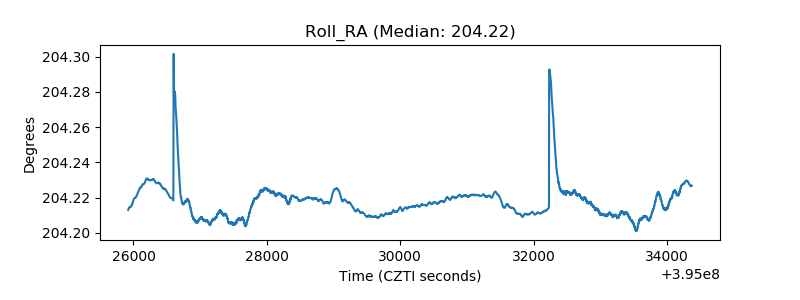 |
| Veto Counter | 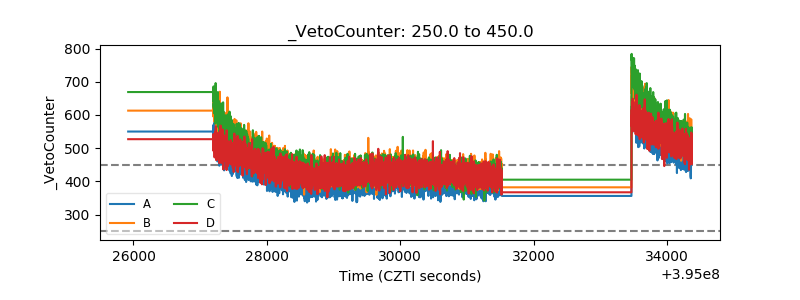 |