| Param | Original file | Final file |
|---|---|---|
| Filename | modeM0/AS1A11_049T04_9000005230_36651cztM0_level2.evt | modeM0/AS1A11_049T04_9000005230_36651cztM0_level2_quad_clean.evt |
| Size (bytes) | 429,344,640 | 59,544,000 |
| Size | 409.5 MB | 56.8 MB |
| Events in quadrant A | 2,875,334 | 369,440 |
| Events in quadrant B | 2,782,329 | 375,592 |
| Events in quadrant C | 3,415,461 | 361,501 |
| Events in quadrant D | 3,576,971 | 332,316 |
| Mode M0 | |||
|---|---|---|---|
| Quadrant | BADHDUFLAG | Total packets | Discarded packets |
| A | 0 | 11433 | 3 |
| B | 0 | 11187 | 2 |
| C | 0 | 13236 | 2 |
| D | 0 | 13739 | 2 |
| Mode M9 | |||
|---|---|---|---|
| Quadrant | BADHDUFLAG | Total packets | Discarded packets |
| A | 0 | 24 | 0 |
| B | 0 | 24 | 0 |
| C | 0 | 24 | 0 |
| D | 0 | 25 | 0 |
| Mode SS | |||
|---|---|---|---|
| Quadrant | BADHDUFLAG | Total packets | Discarded packets |
| A | 0 | 104 | 0 |
| B | 0 | 104 | 0 |
| C | 0 | 104 | 0 |
| D | 0 | 104 | 0 |
| Quadrant | Total seconds | Saturated seconds | Saturation percentage |
|---|---|---|---|
| A | 5198 | 12 | 0.230858% |
| B | 5198 | 15 | 0.288573% |
| C | 5198 | 179 | 3.443632% |
| D | 5198 | 254 | 4.886495% |
Noise dominated data is calculated using 1-second bins in cleaned event files. If a bin has >2000 counts, and if more than 50% of those come from <1% of pixels, then it is considered to be noise-dominated and hence unusable.
| Quadrant | # 1 sec bins | Bins with >0 counts | Bins with >2000 counts | High rate bins dominated by noise | Noise dominated (total time) | Noise dominated (detector-on time) | Marked lightcurve |
|---|---|---|---|---|---|---|---|
| A | 7231 | 5199 | 0 | 0 | 0.00% | 0.00% | 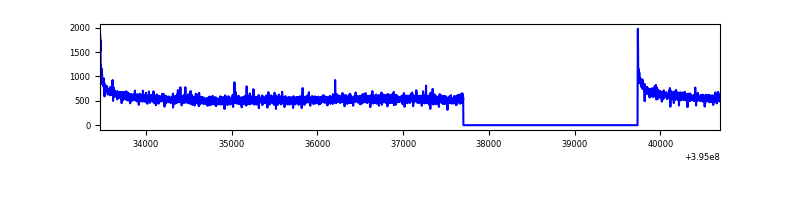 |
| B | 7231 | 5199 | 4 | 4 | 0.06% | 0.08% | 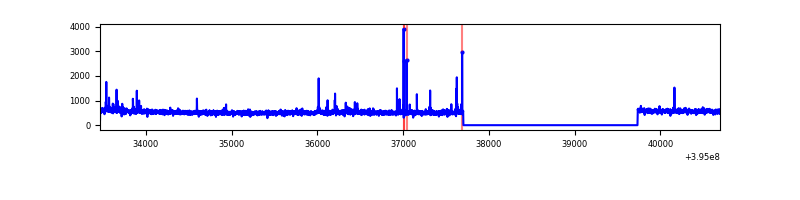 |
| C | 7231 | 5199 | 123 | 123 | 1.70% | 2.37% | 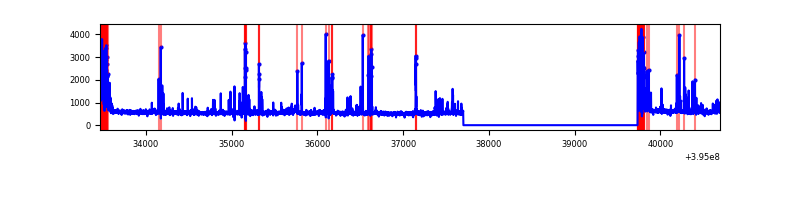 |
| D | 7231 | 5199 | 194 | 194 | 2.68% | 3.73% | 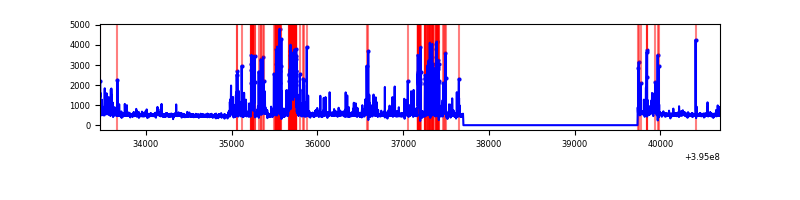 |
Top three noisy pixels from each quadrant. If the there are fewer than three noisy pixels in the level2.evt file, extra rows are filled as -1
| Pixel properties | Quadrant properties | ||||||
|---|---|---|---|---|---|---|---|
| Quadrant | DetID | PixID | Counts | Sigma | Mean | Median | Sigma |
| A | 10 | 83 | 202574 | 1478.02 | 684 | 673 | 136.6 |
| A | 7 | 192 | 15146 | 105.95 | 684 | 673 | 136.6 |
| A | 13 | 6 | 8865 | 59.97 | 684 | 673 | 136.6 |
| B | 0 | 190 | 28833 | 221.34 | 680 | 664 | 127.3 |
| B | 0 | 221 | 28306 | 217.2 | 680 | 664 | 127.3 |
| B | 5 | 255 | 23745 | 181.36 | 680 | 664 | 127.3 |
| C | 0 | 10 | 353104 | 2346.7 | 653 | 658 | 150.2 |
| C | 14 | 254 | 279302 | 1855.3 | 653 | 658 | 150.2 |
| C | 15 | 214 | 222549 | 1477.42 | 653 | 658 | 150.2 |
| D | 12 | 6 | 379178 | 2392.82 | 649 | 633 | 158.2 |
| D | 2 | 249 | 290074 | 1829.59 | 649 | 633 | 158.2 |
| D | 2 | 153 | 158800 | 999.79 | 649 | 633 | 158.2 |
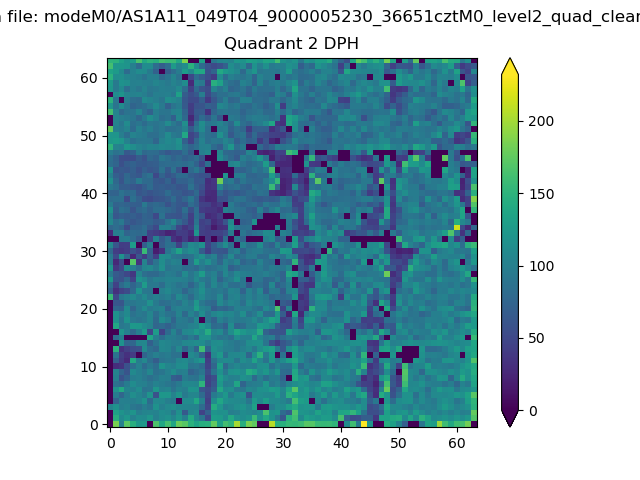
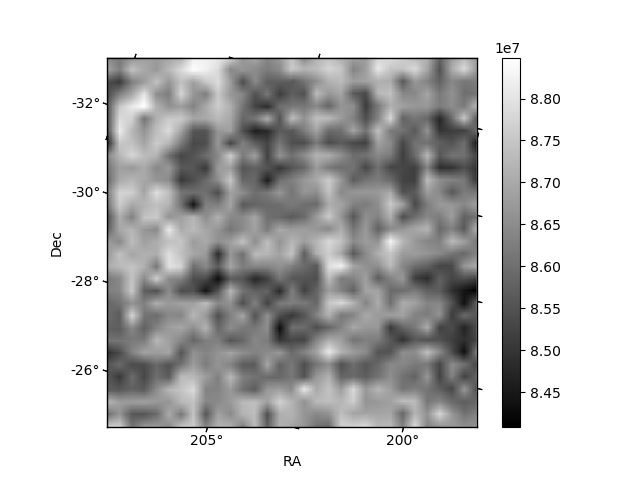
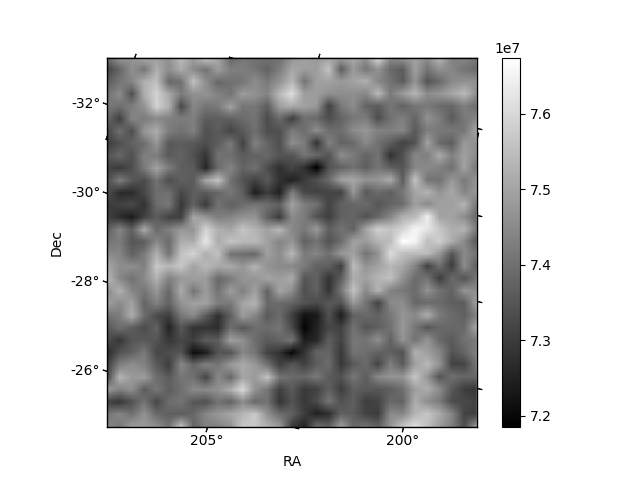
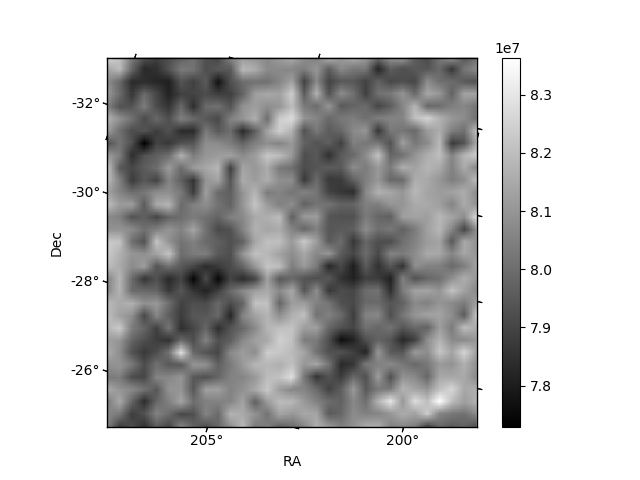
Histogram calculated using DETX and DETY for each event in the final _common_clean file
| Quadrant A | 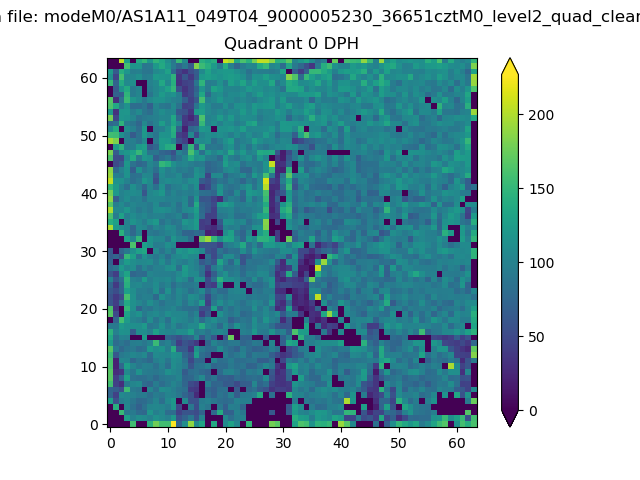 |
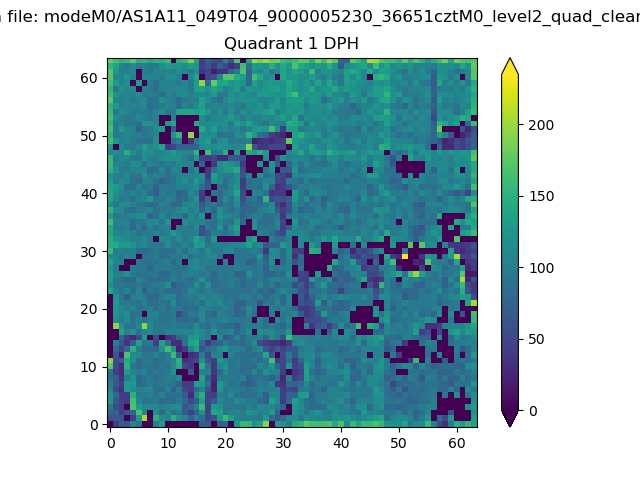 |
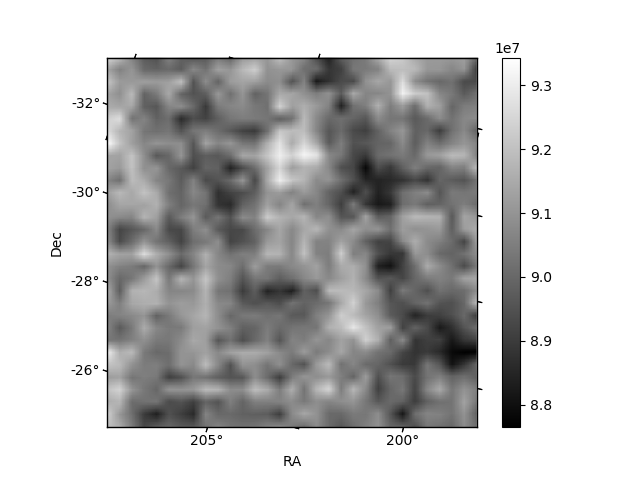
Quadrant B |
|---|---|---|---|
| Quadrant D | 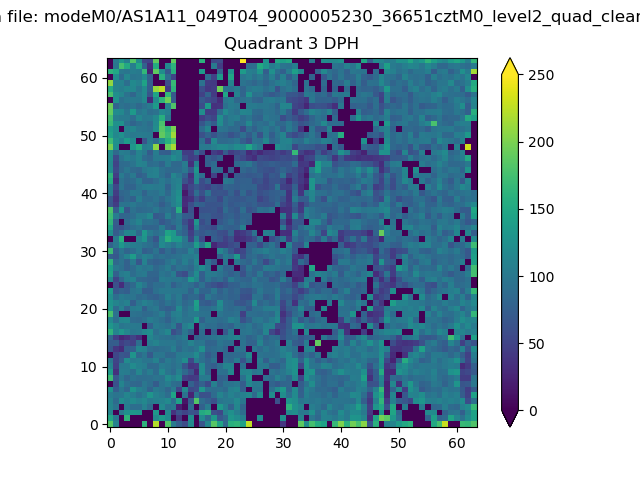 |
 |
Quadrant C |
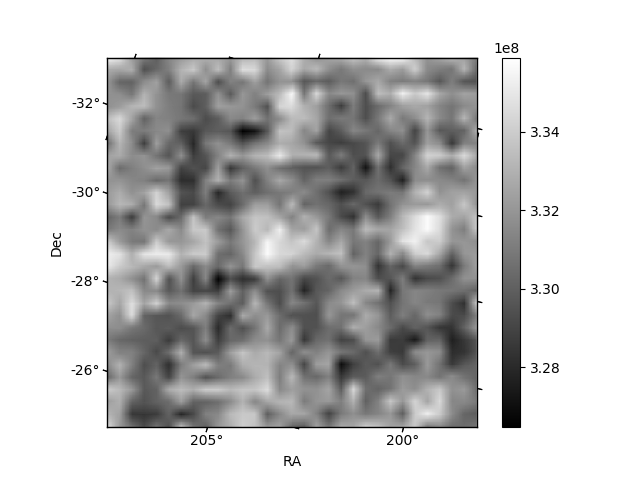
| Plot type | Count rate plots | Images |
|---|---|---|
| Comparison with Poisson distribution Blue bars denote a histogram of data divided into 1 sec bins. Red curve is a Poisson curve with rate = median count rate of data. |
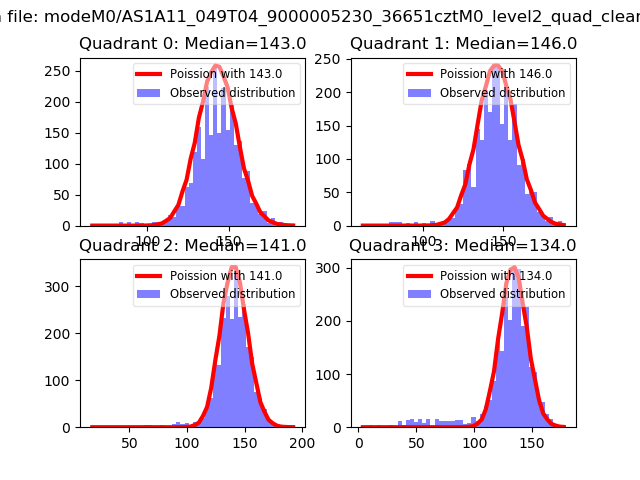 |
 |
| Quadrant-wise count rates Data is divided into 100 sec bins |
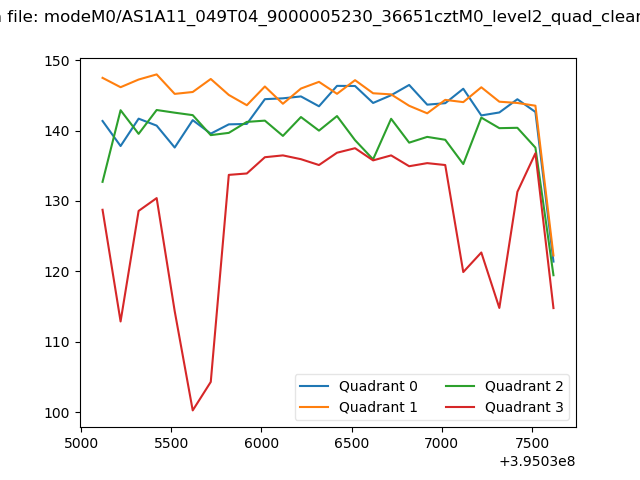 |
|
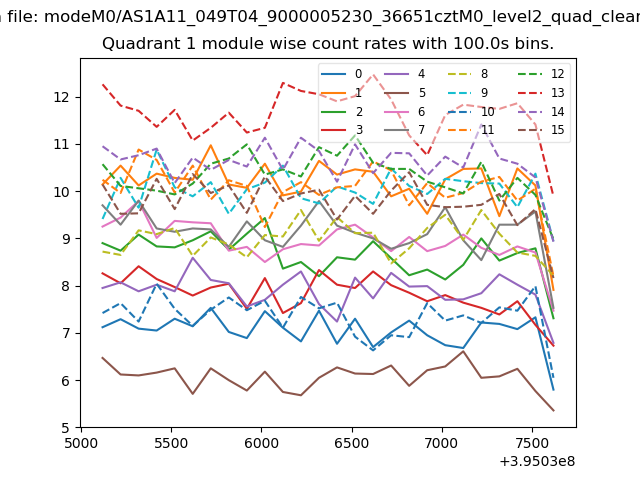
| Module-wise count rates for Quadrant A Data is divided into 100 sec bins |
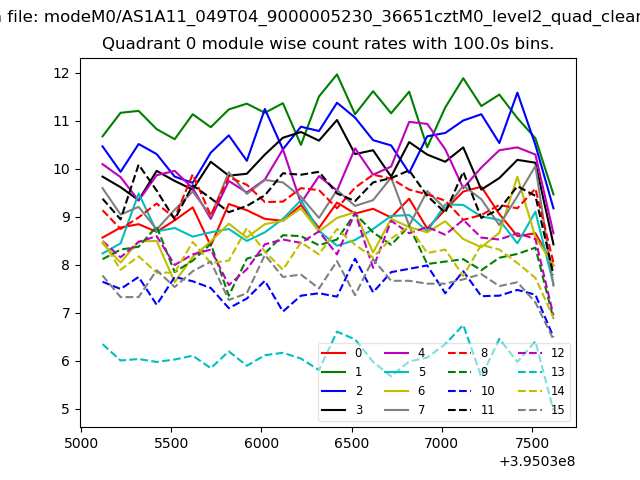 |
 |
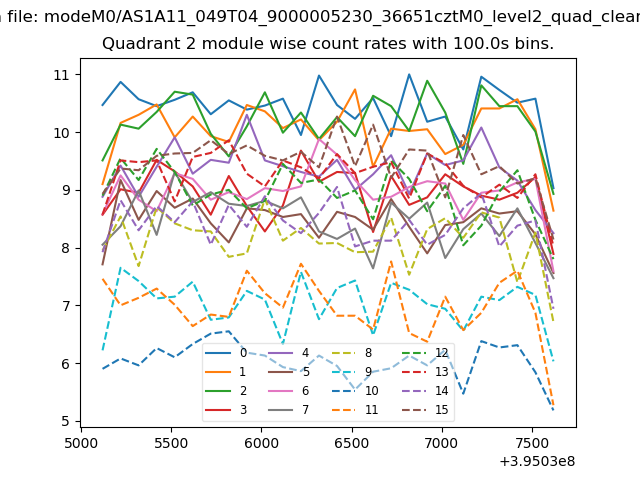
| Module-wise count rates for Quadrant B Data is divided into 100 sec bins |
 |
 |
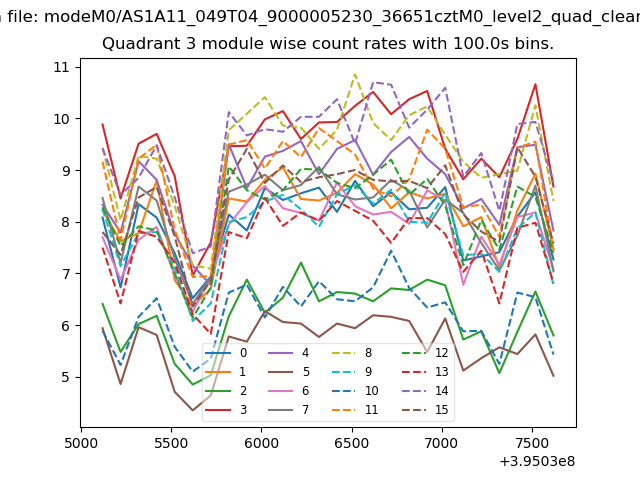
| Module-wise count rates for Quadrant C Data is divided into 100 sec bins |
 |
 |
| Module-wise count rates for Quadrant D Data is divided into 100 sec bins |
 |
 |
| Parameter | Plot |
|---|---|
| CZT HV Monitor | 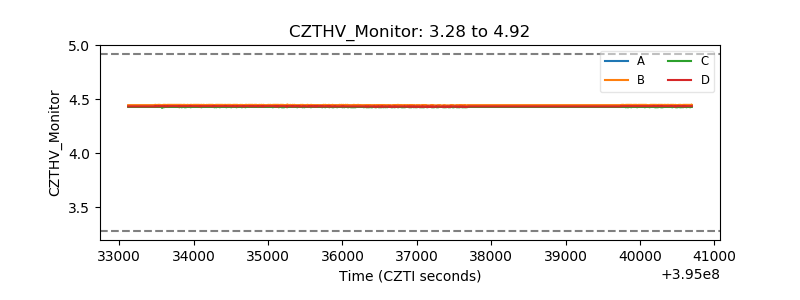 |
| D_VDD | 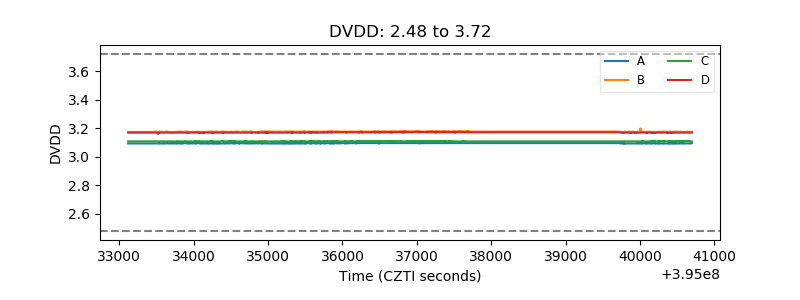 |
| Temperature 1 | 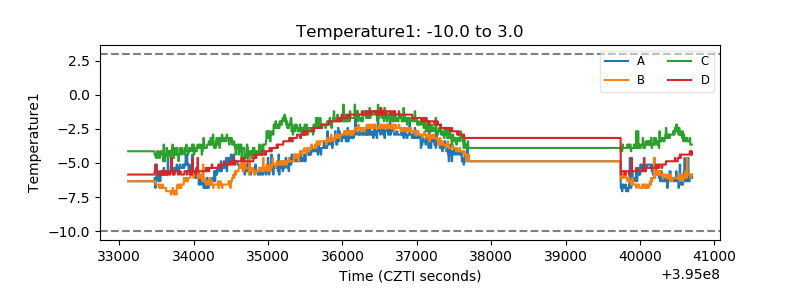 |
| Veto HV Monitor |  |
| Veto LLD | 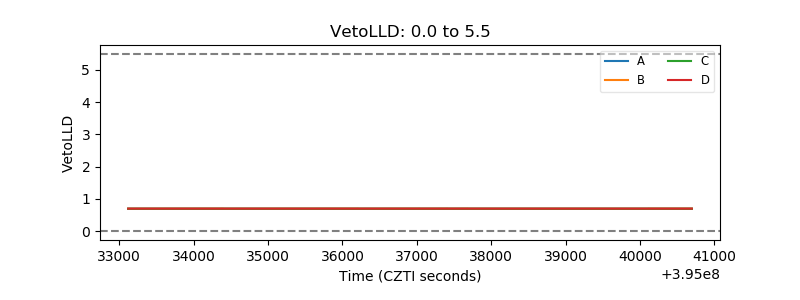 |
| Alpha Counter | 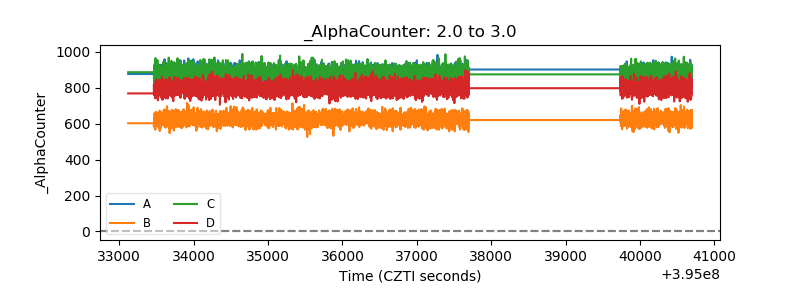 |
| _CPM_Rate | 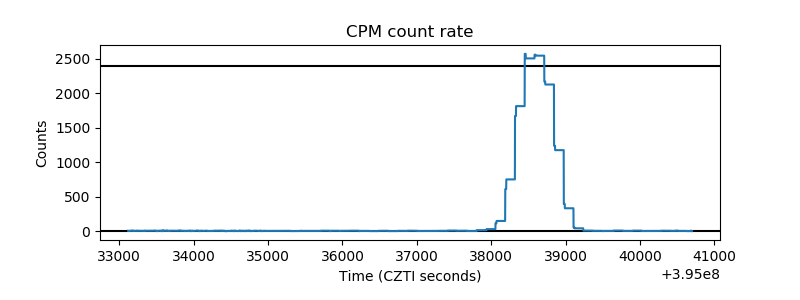 |
| CZT Counter | 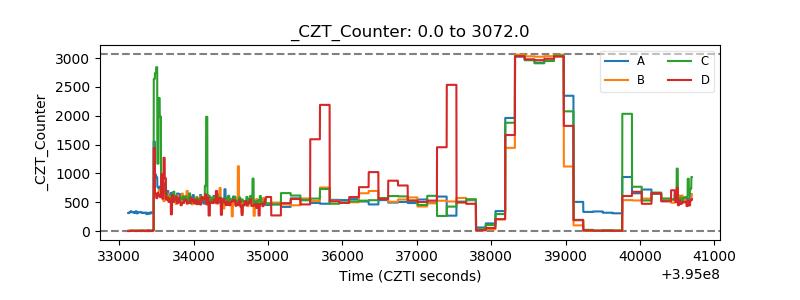 |
| +2.5 Volts monitor | 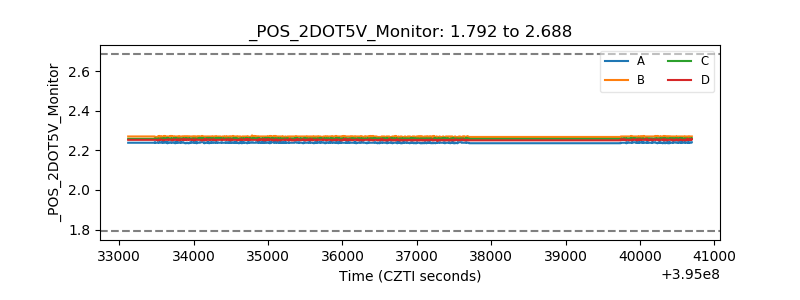 |
| +5 Volts monitor |  |
| _ROLL_ROT | 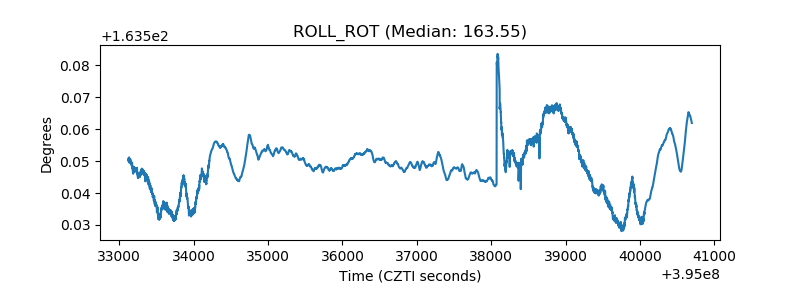 |
| _Roll_DEC | 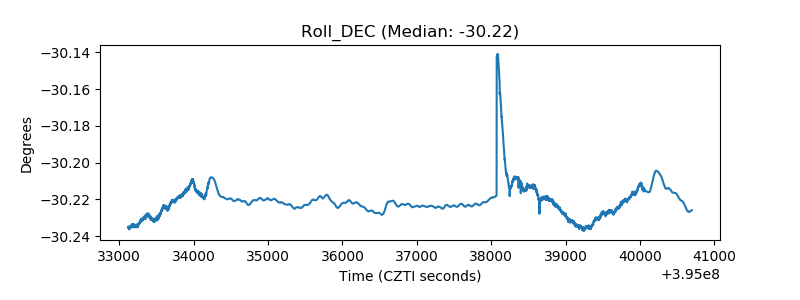 |
| _Roll_RA | 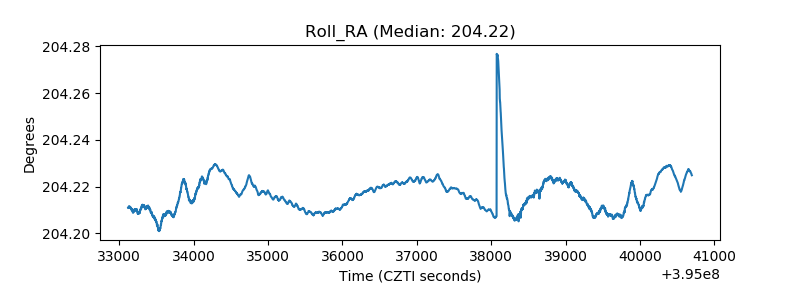 |
| Veto Counter | 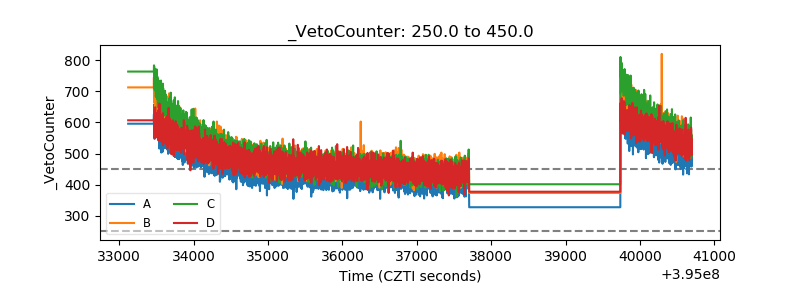 |