| Param | Original file | Final file |
|---|---|---|
| Filename | modeM0/AS1A11_049T05_9000005232cztM0_level2.fits | modeM0/AS1A11_049T05_9000005232cztM0_level2_quad_clean.evt |
| Size (bytes) | 887,094,720 | 902,810,880 |
| Size | 846.0 MB | 861.0 MB |
| Events in quadrant A | 5,526,832 | 5,649,530 |
| Events in quadrant B | 5,215,420 | 5,525,421 |
| Events in quadrant C | 5,303,576 | 5,215,414 |
| Events in quadrant D | 4,492,638 | 4,625,770 |
| Mode M9 | |||
|---|---|---|---|
| Quadrant | BADHDUFLAG | Total packets | Discarded packets |
| A | 0 | 360 | 0 |
| B | 0 | 360 | 0 |
| C | 0 | 360 | 0 |
| D | 0 | 360 | 0 |
| Mode M0 | |||
|---|---|---|---|
| Quadrant | BADHDUFLAG | Total packets | Discarded packets |
| A | 0 | 194450 | 0 |
| B | 0 | 204338 | 0 |
| C | 0 | 213304 | 0 |
| D | 0 | 271096 | 0 |
| Mode SS | |||
|---|---|---|---|
| Quadrant | BADHDUFLAG | Total packets | Discarded packets |
| A | 0 | 1888 | 0 |
| B | 0 | 1888 | 0 |
| C | 0 | 1888 | 0 |
| D | 0 | 1888 | 0 |
| Quadrant | Total seconds | Saturated seconds | Saturation percentage |
|---|---|---|---|
| A | 92276 | 235 | 0.254671% |
| B | 92276 | 1044 | 1.131388% |
| C | 92276 | 2090 | 2.264944% |
| D | 92276 | 5565 | 6.030821% |
Noise dominated data is calculated using 1-second bins in cleaned event files. If a bin has >2000 counts, and if more than 50% of those come from <1% of pixels, then it is considered to be noise-dominated and hence unusable.
| Quadrant | # 1 sec bins | Bins with >0 counts | Bins with >2000 counts | High rate bins dominated by noise | Noise dominated (total time) | Noise dominated (detector-on time) | Marked lightcurve |
|---|---|---|---|---|---|---|---|
| A | 126212 | 92275 | 0 | 0 | 0.00% | 0.00% | 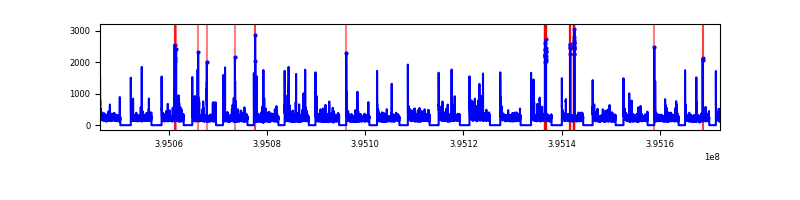 |
| B | 126212 | 92265 | 0 | 0 | 0.00% | 0.00% | 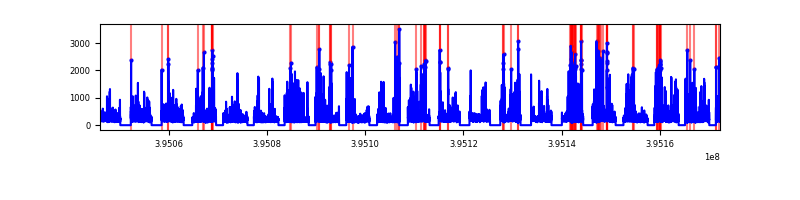 |
| C | 126212 | 92241 | 0 | 0 | 0.00% | 0.00% | 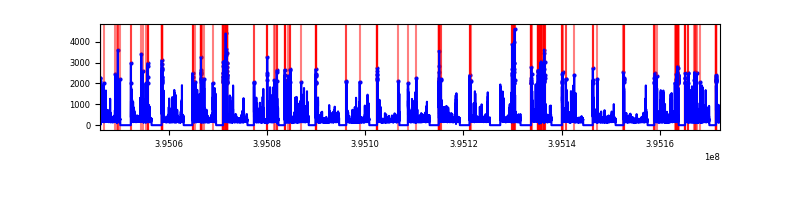 |
| D | 126212 | 92146 | 0 | 0 | 0.00% | 0.00% | 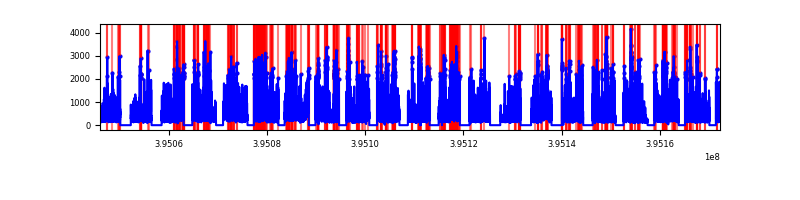 |
Top three noisy pixels from each quadrant. If the there are fewer than three noisy pixels in the level2.evt file, extra rows are filled as -1
| Pixel properties | Quadrant properties | ||||||
|---|---|---|---|---|---|---|---|
| Quadrant | DetID | PixID | Counts | Sigma | Mean | Median | Sigma |
| A | 9 | 19 | 4487 | 8.74 | 1443 | 1357 | 358.0 |
| A | 7 | 110 | 4456 | 8.66 | 1443 | 1357 | 358.0 |
| A | 0 | 29 | 4390 | 8.47 | 1443 | 1357 | 358.0 |
| B | 2 | 9 | 4504 | 12.0 | 1382 | 1325 | 264.9 |
| B | 3 | 80 | 4032 | 10.22 | 1382 | 1325 | 264.9 |
| B | 2 | 8 | 3626 | 8.69 | 1382 | 1325 | 264.9 |
| C | 1 | 81 | 4285 | 8.38 | 1400 | 1314 | 354.3 |
| C | 3 | 202 | 4185 | 8.1 | 1400 | 1314 | 354.3 |
| C | 1 | 80 | 4159 | 8.03 | 1400 | 1314 | 354.3 |
| D | 7 | 3 | 3389 | 6.44 | 1290 | 1176 | 343.4 |
| D | 4 | 160 | 3275 | 6.11 | 1290 | 1176 | 343.4 |
| D | 10 | 113 | 3242 | 6.02 | 1290 | 1176 | 343.4 |
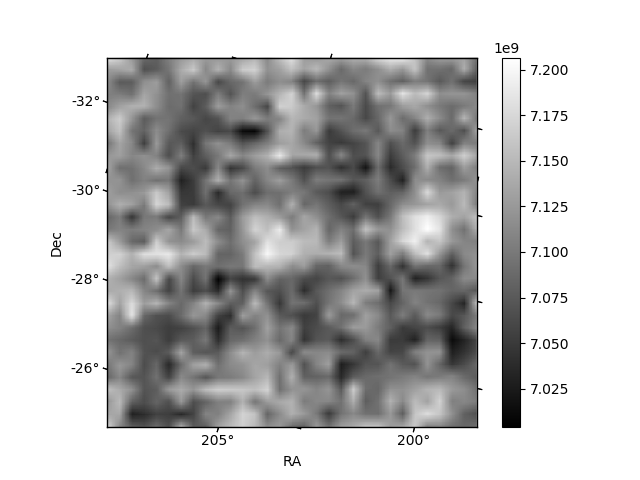
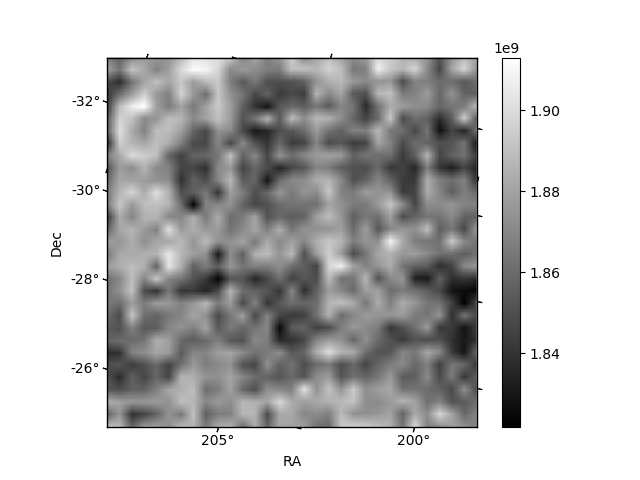
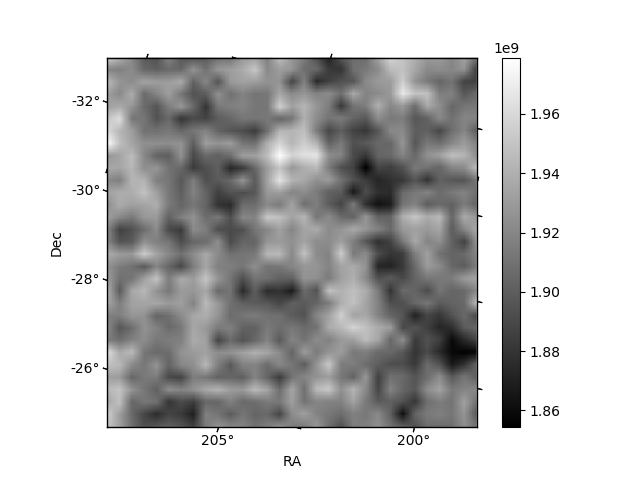
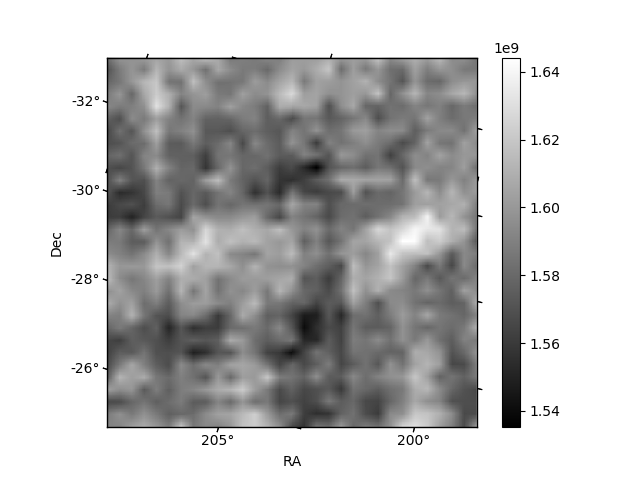
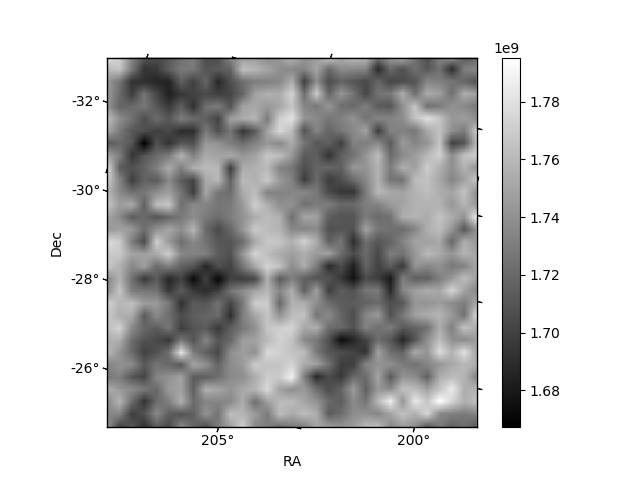
Histogram calculated using DETX and DETY for each event in the final _common_clean file
| Quadrant A | 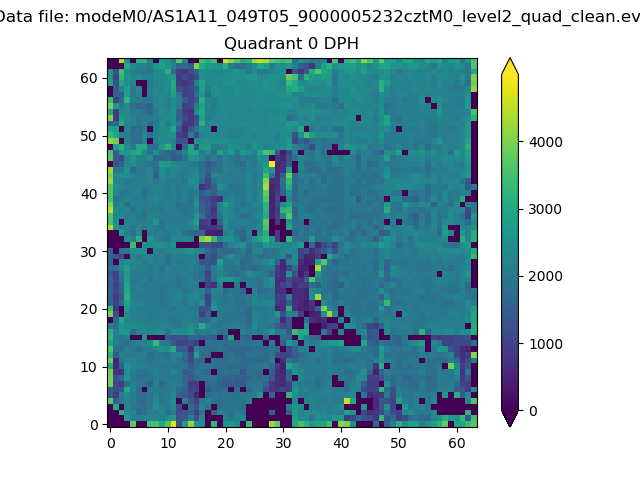 |
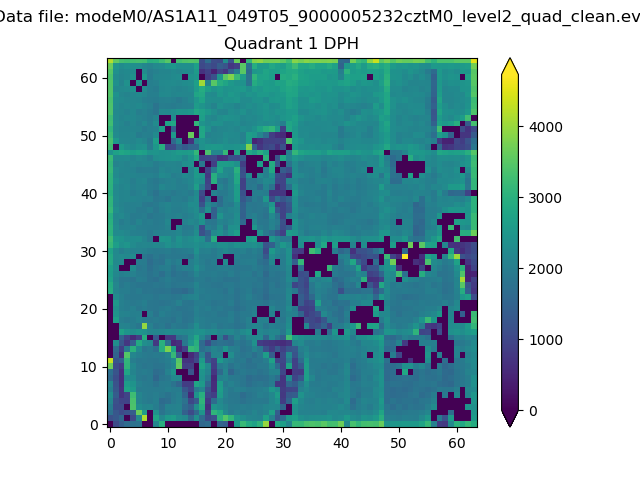 |
Quadrant B |
|---|---|---|---|
| Quadrant D | 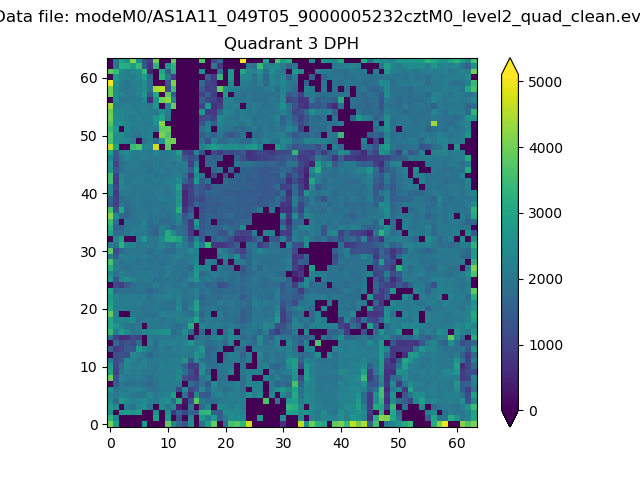 |
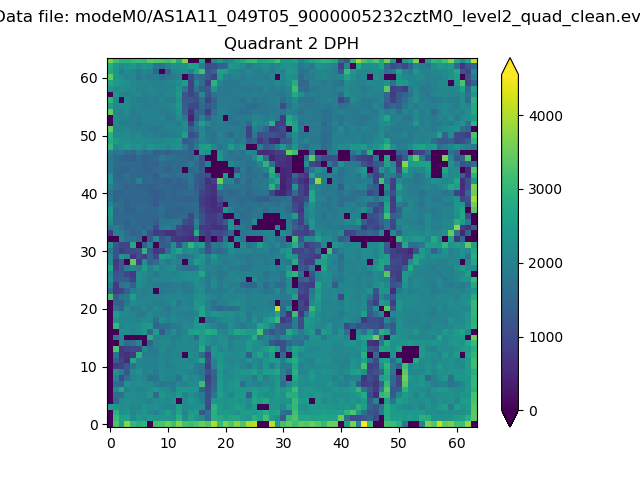 |
Quadrant C |
| Plot type | Count rate plots | Images |
|---|---|---|
| Comparison with Poisson distribution Blue bars denote a histogram of data divided into 1 sec bins. Red curve is a Poisson curve with rate = median count rate of data. |
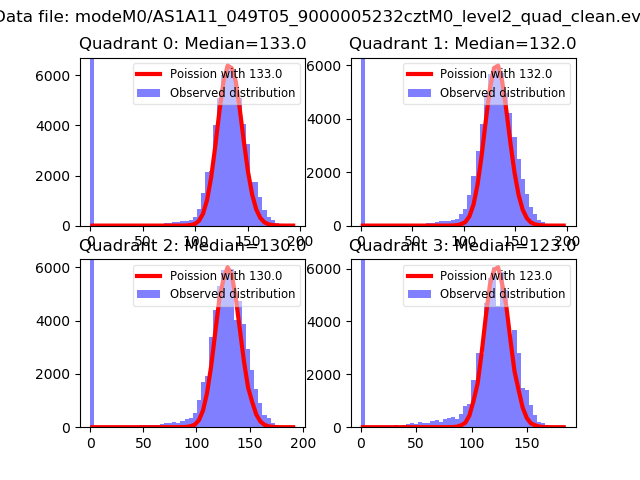 |
 |
| Quadrant-wise count rates Data is divided into 100 sec bins |
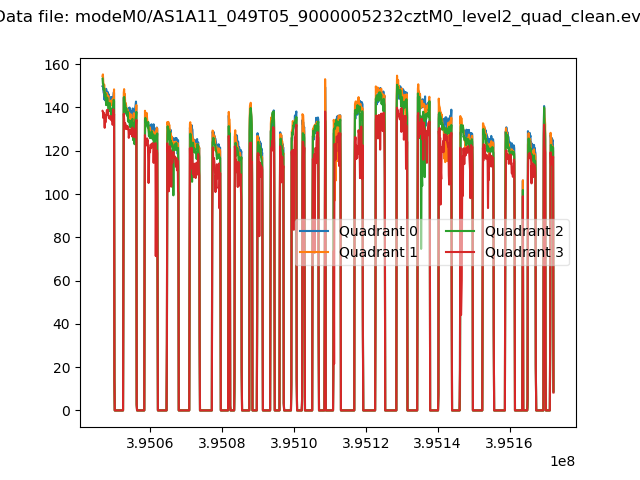 |
|
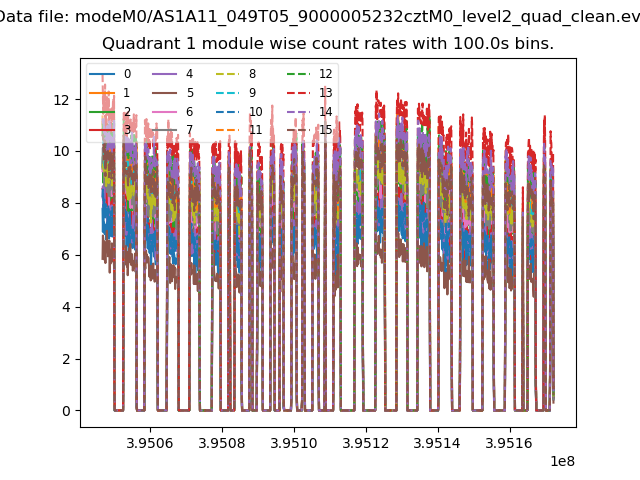
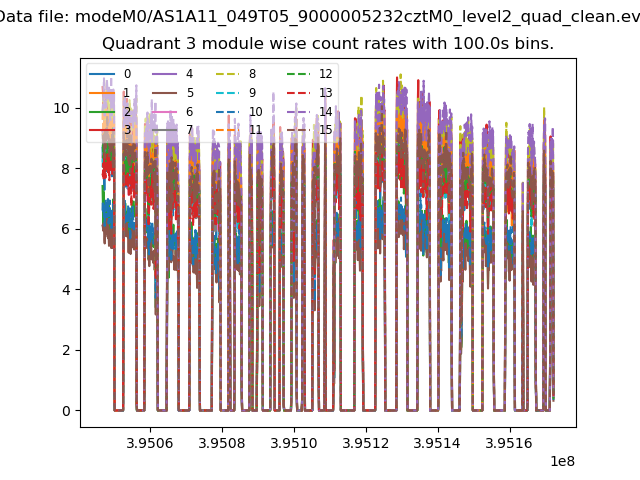
| Module-wise count rates for Quadrant A Data is divided into 100 sec bins |
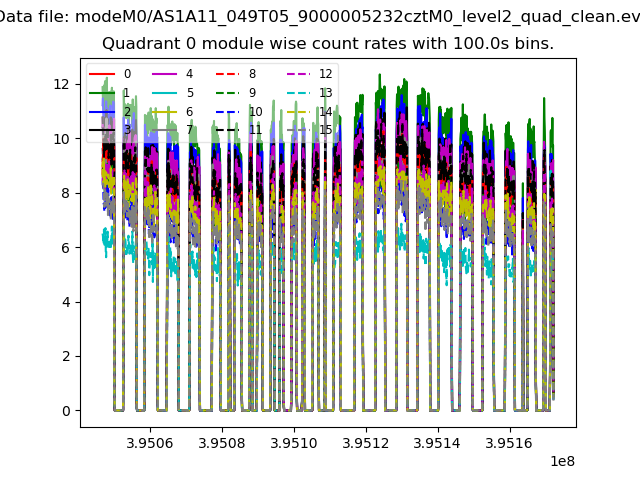 |
 |
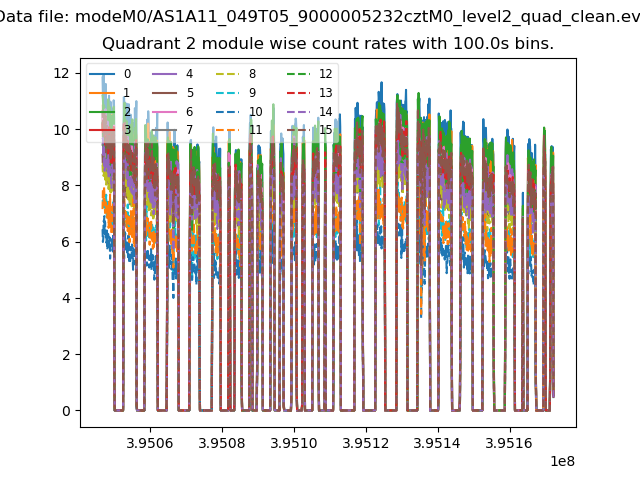
| Module-wise count rates for Quadrant B Data is divided into 100 sec bins |
 |
 |
| Module-wise count rates for Quadrant C Data is divided into 100 sec bins |
 |
 |
| Module-wise count rates for Quadrant D Data is divided into 100 sec bins |
 |
 |
| Parameter | Plot |
|---|---|
| CZT HV Monitor | 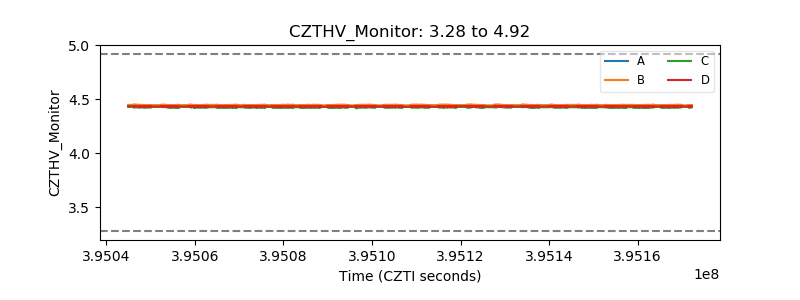 |
| D_VDD | 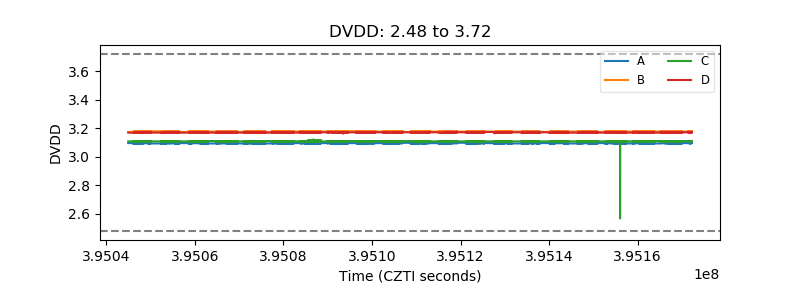 |
| Temperature 1 | 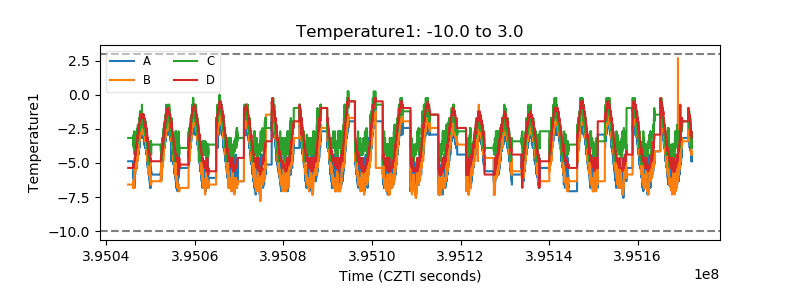 |
| Veto HV Monitor | 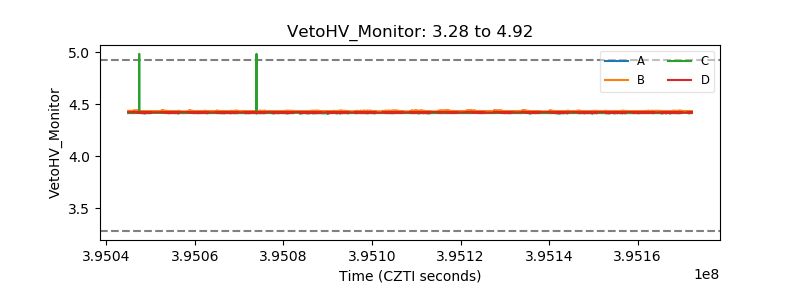 |
| Veto LLD | 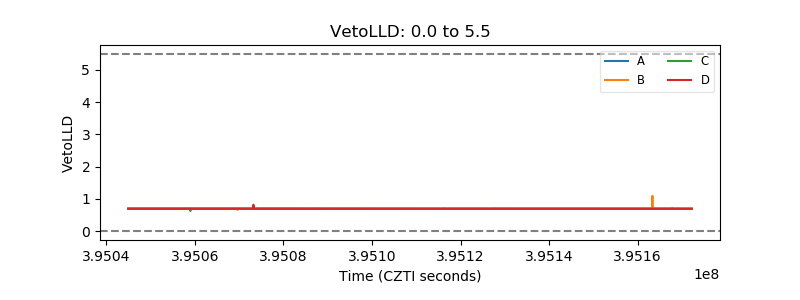 |
| Alpha Counter | 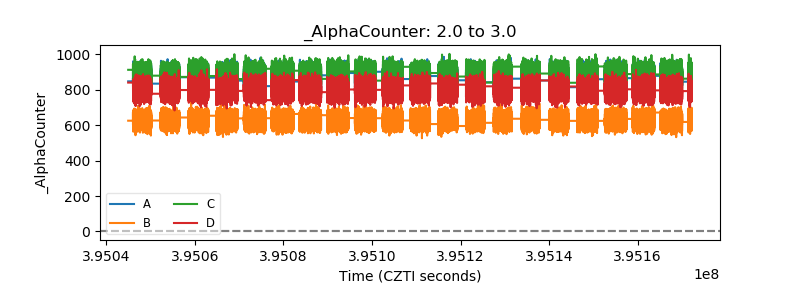 |
| _CPM_Rate | 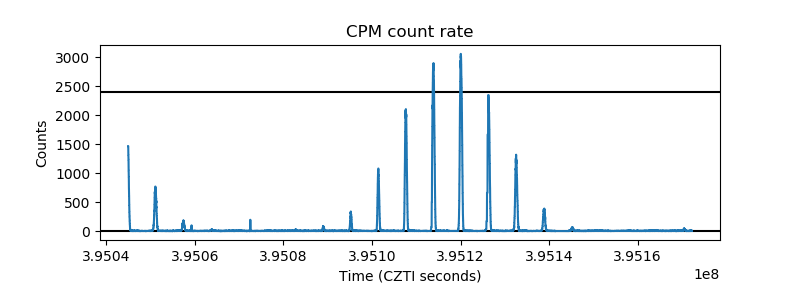 |
| CZT Counter | 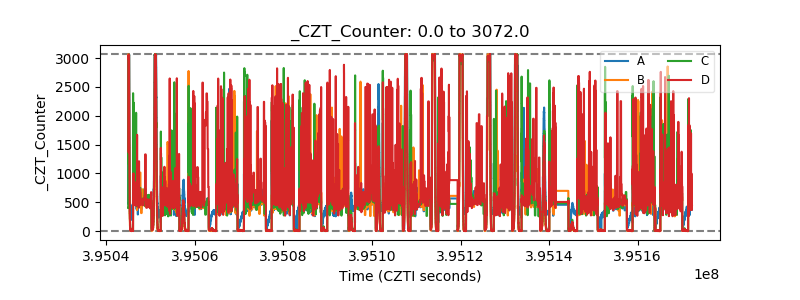 |
| +2.5 Volts monitor | 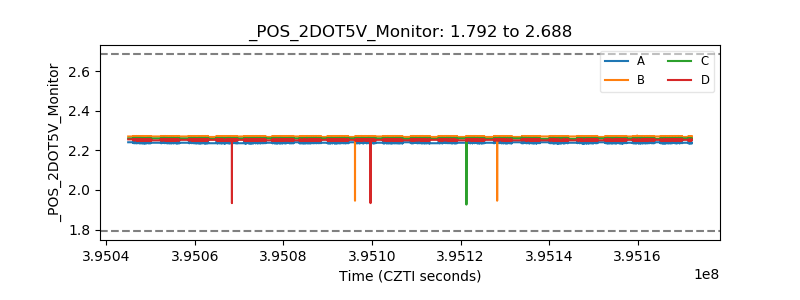 |
| +5 Volts monitor | 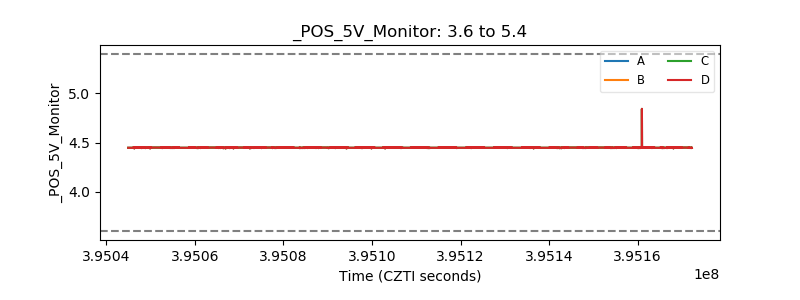 |
| _ROLL_ROT | 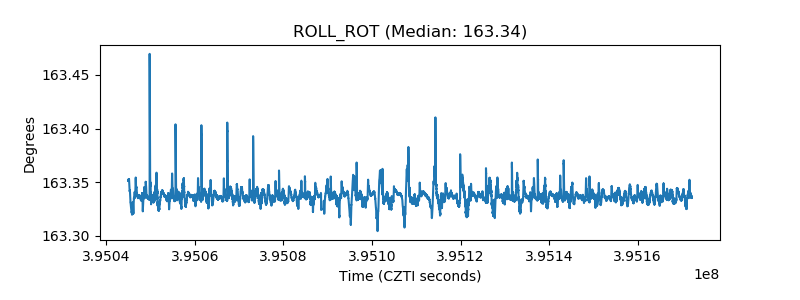 |
| _Roll_DEC | 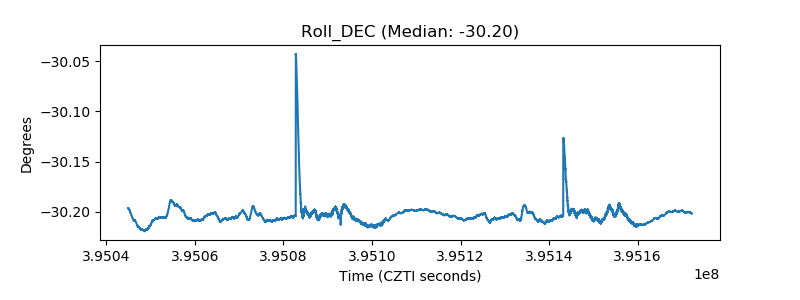 |
| _Roll_RA | 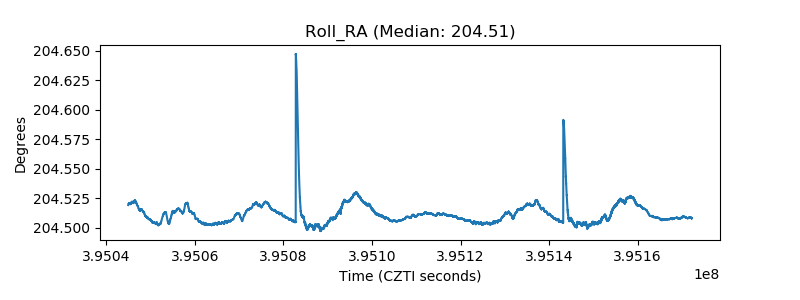 |
| Veto Counter | 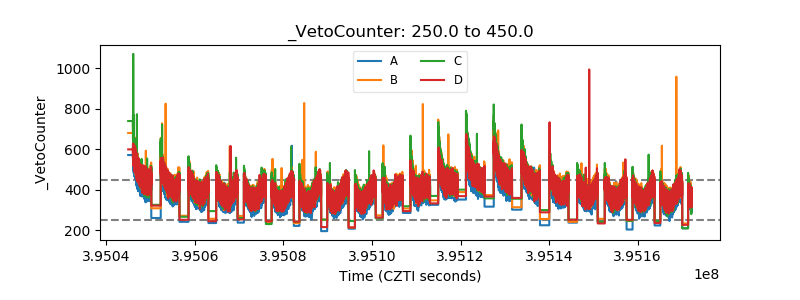 |