| Param | Original file | Final file |
|---|---|---|
| Filename | modeM0/AS1A11_049T05_9000005232_36653cztM0_level2.evt | modeM0/AS1A11_049T05_9000005232_36653cztM0_level2_quad_clean.evt |
| Size (bytes) | 379,416,960 | 80,372,160 |
| Size | 361.8 MB | 76.6 MB |
| Events in quadrant A | 2,653,010 | 532,010 |
| Events in quadrant B | 2,587,886 | 537,257 |
| Events in quadrant C | 3,017,103 | 524,861 |
| Events in quadrant D | 2,902,604 | 499,225 |
| Mode M9 | |||
|---|---|---|---|
| Quadrant | BADHDUFLAG | Total packets | Discarded packets |
| A | 0 | 31 | 0 |
| B | 0 | 31 | 0 |
| C | 0 | 31 | 0 |
| D | 0 | 32 | 0 |
| Mode M0 | |||
|---|---|---|---|
| Quadrant | BADHDUFLAG | Total packets | Discarded packets |
| A | 0 | 10621 | 3 |
| B | 0 | 10426 | 2 |
| C | 0 | 11815 | 2 |
| D | 0 | 11537 | 2 |
| Mode SS | |||
|---|---|---|---|
| Quadrant | BADHDUFLAG | Total packets | Discarded packets |
| A | 0 | 100 | 0 |
| B | 0 | 100 | 0 |
| C | 0 | 100 | 0 |
| D | 0 | 100 | 0 |
| Quadrant | Total seconds | Saturated seconds | Saturation percentage |
|---|---|---|---|
| A | 4849 | 10 | 0.206228% |
| B | 4849 | 13 | 0.268097% |
| C | 4849 | 148 | 3.052176% |
| D | 4849 | 64 | 1.319860% |
Noise dominated data is calculated using 1-second bins in cleaned event files. If a bin has >2000 counts, and if more than 50% of those come from <1% of pixels, then it is considered to be noise-dominated and hence unusable.
| Quadrant | # 1 sec bins | Bins with >0 counts | Bins with >2000 counts | High rate bins dominated by noise | Noise dominated (total time) | Noise dominated (detector-on time) | Marked lightcurve |
|---|---|---|---|---|---|---|---|
| A | 7003 | 4850 | 0 | 0 | 0.00% | 0.00% | 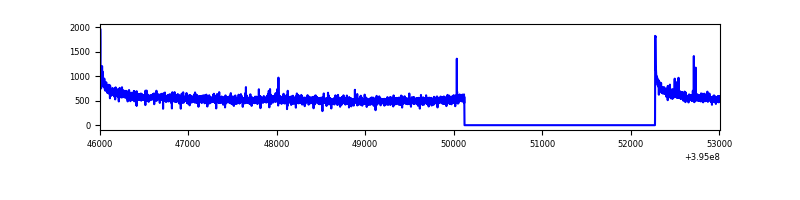 |
| B | 7003 | 4850 | 2 | 2 | 0.03% | 0.04% | 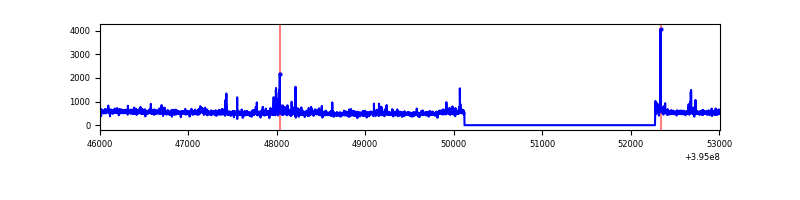 |
| C | 7003 | 4850 | 97 | 97 | 1.39% | 2.00% | 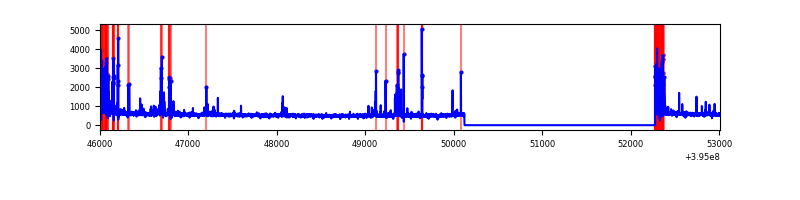 |
| D | 7003 | 4850 | 48 | 48 | 0.69% | 0.99% | 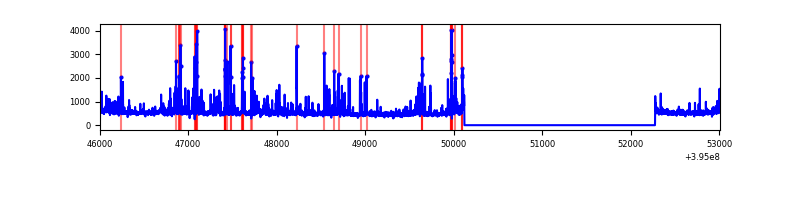 |
Top three noisy pixels from each quadrant. If the there are fewer than three noisy pixels in the level2.evt file, extra rows are filled as -1
| Pixel properties | Quadrant properties | ||||||
|---|---|---|---|---|---|---|---|
| Quadrant | DetID | PixID | Counts | Sigma | Mean | Median | Sigma |
| A | 10 | 83 | 195036 | 1557.28 | 628 | 618 | 124.8 |
| A | 13 | 6 | 12666 | 96.5 | 628 | 618 | 124.8 |
| A | 9 | 143 | 9381 | 70.19 | 628 | 618 | 124.8 |
| B | 5 | 255 | 59918 | 511.02 | 618 | 603 | 116.1 |
| B | 0 | 221 | 39184 | 332.39 | 618 | 603 | 116.1 |
| B | 0 | 199 | 31110 | 262.83 | 618 | 603 | 116.1 |
| C | 0 | 10 | 258128 | 1859.1 | 598 | 604 | 138.5 |
| C | 15 | 214 | 212272 | 1528.06 | 598 | 604 | 138.5 |
| C | 14 | 254 | 210967 | 1518.64 | 598 | 604 | 138.5 |
| D | 2 | 153 | 139945 | 946.62 | 607 | 592 | 147.2 |
| D | 12 | 6 | 133005 | 899.48 | 607 | 592 | 147.2 |
| D | 13 | 171 | 93768 | 632.94 | 607 | 592 | 147.2 |
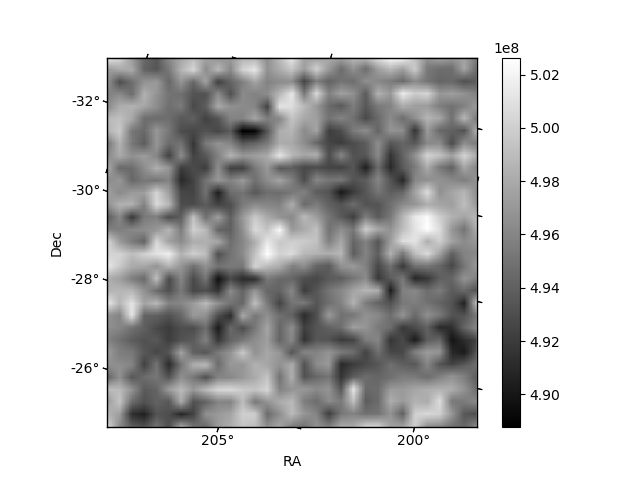
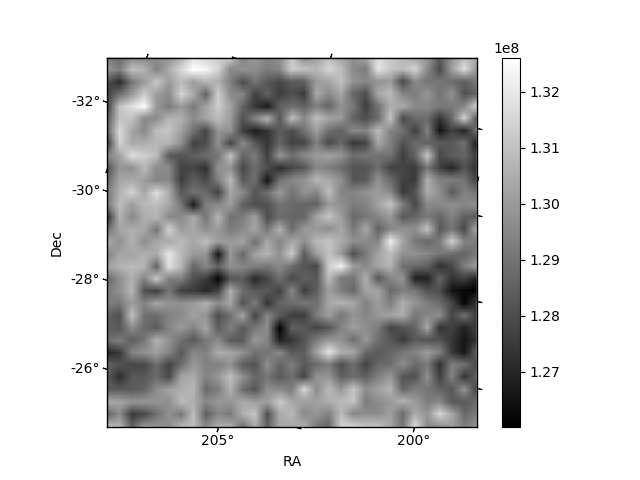
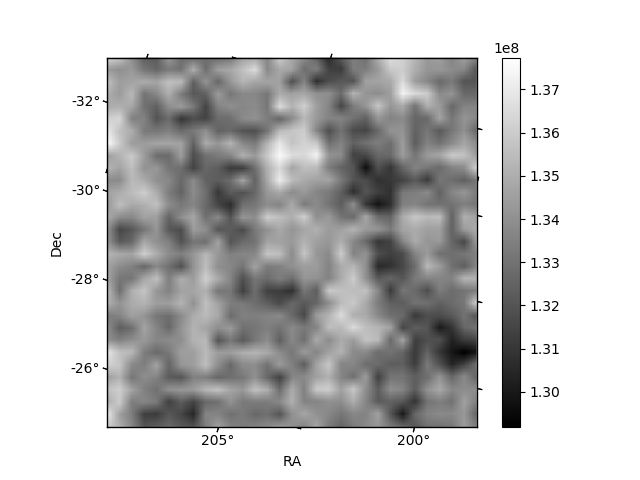
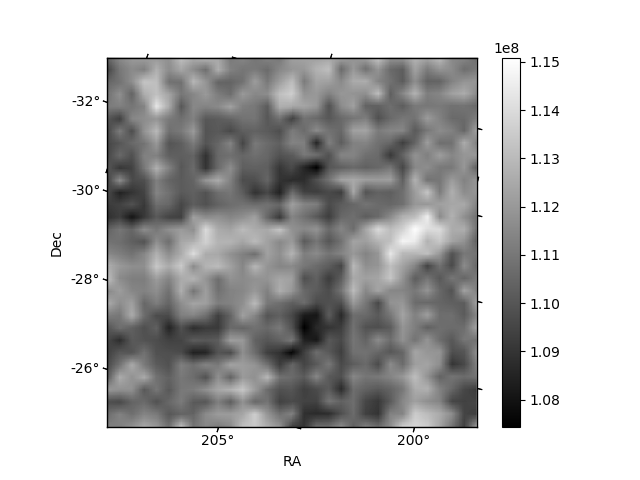
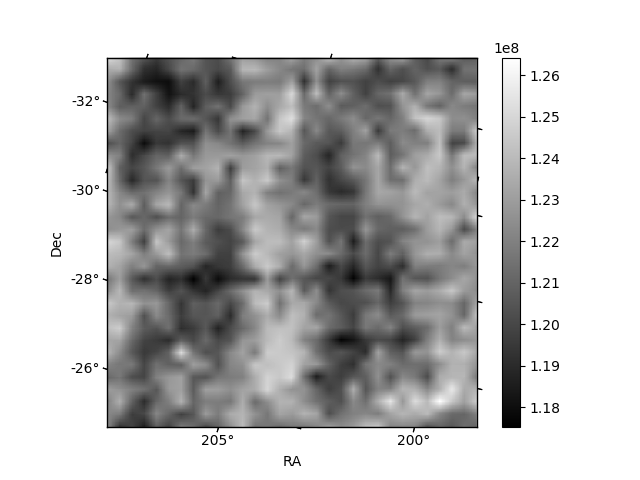
Histogram calculated using DETX and DETY for each event in the final _common_clean file
| Quadrant A | 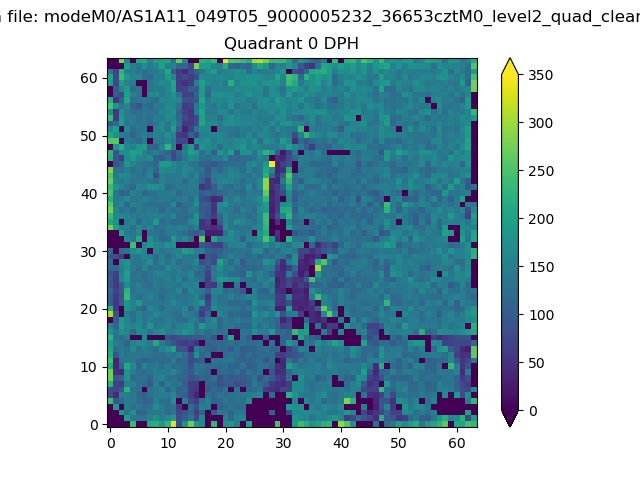 |
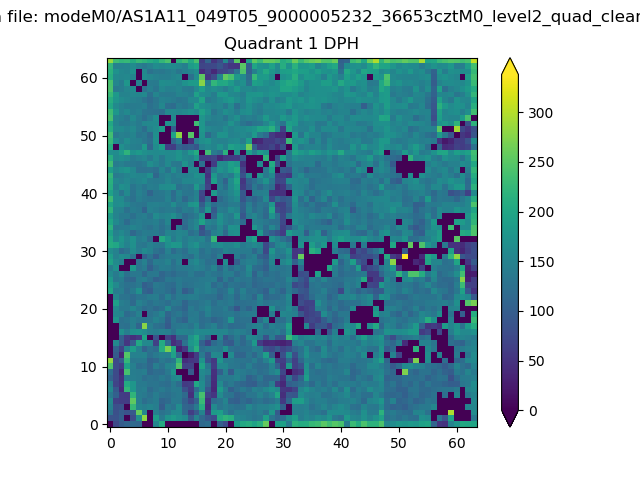 |
Quadrant B |
|---|---|---|---|
| Quadrant D | 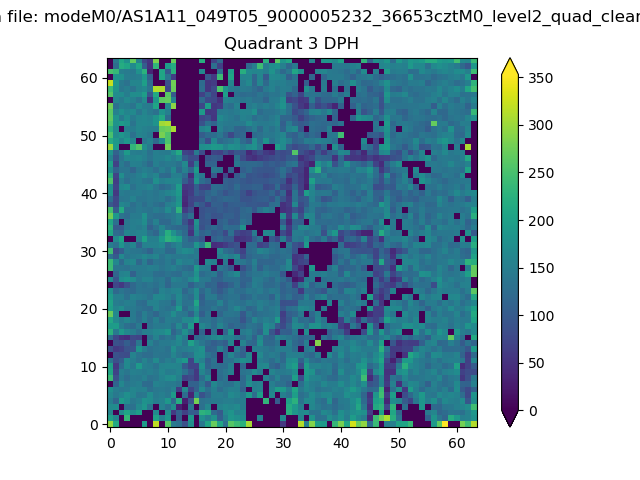 |
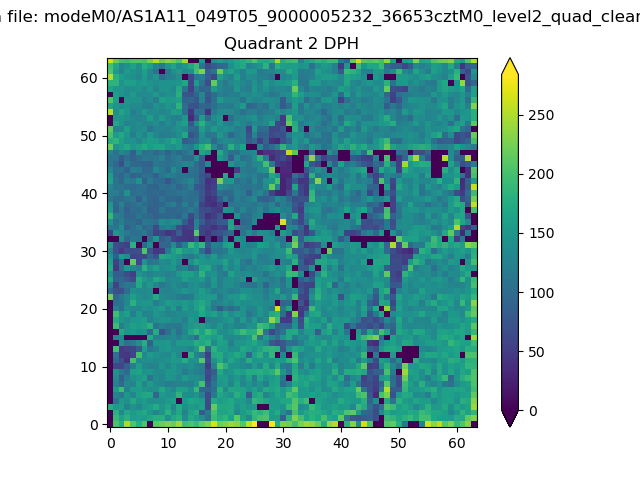 |
Quadrant C |
| Plot type | Count rate plots | Images |
|---|---|---|
| Comparison with Poisson distribution Blue bars denote a histogram of data divided into 1 sec bins. Red curve is a Poisson curve with rate = median count rate of data. |
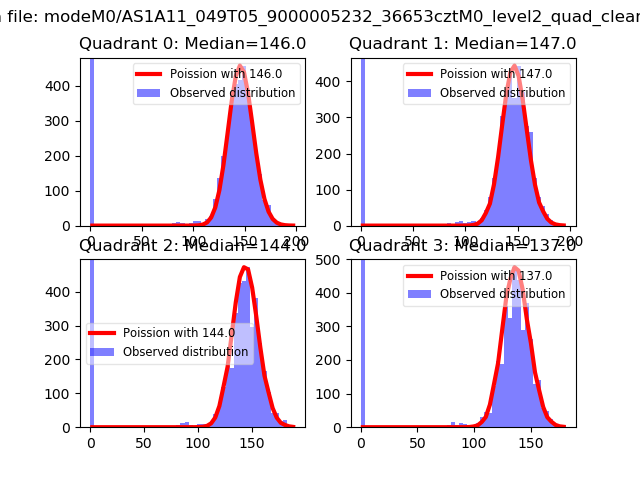 |
 |
| Quadrant-wise count rates Data is divided into 100 sec bins |
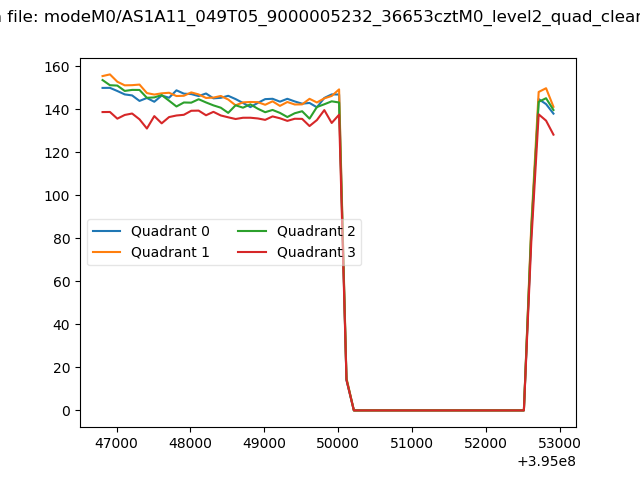 |
|
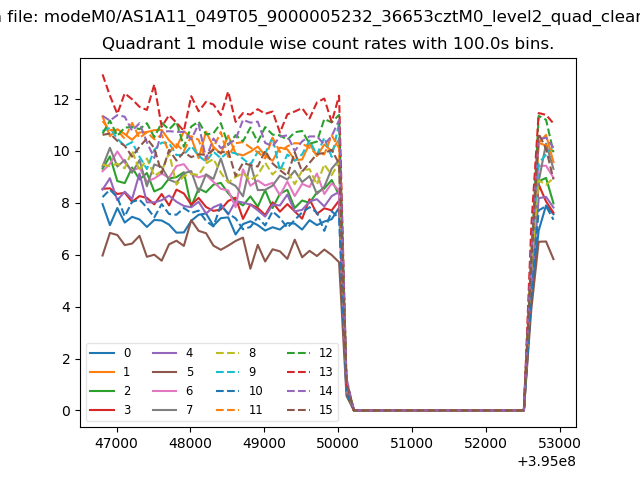
| Module-wise count rates for Quadrant A Data is divided into 100 sec bins |
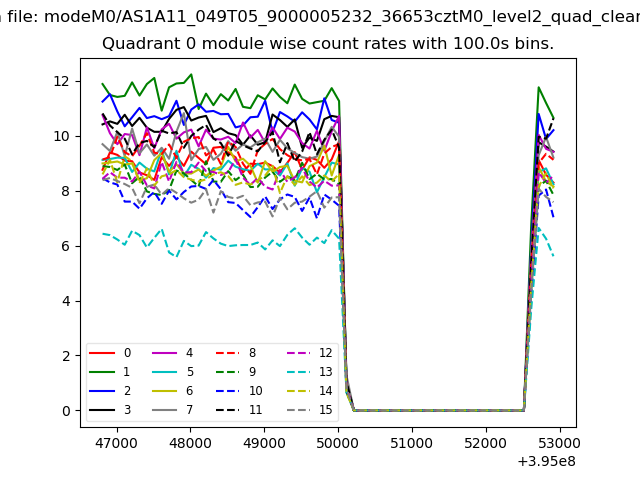 |
 |
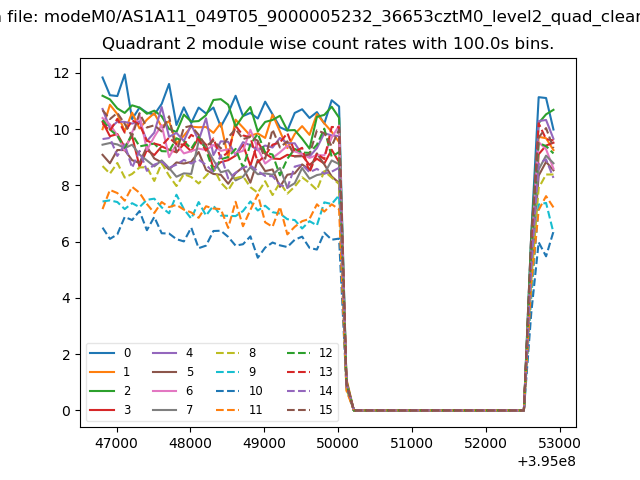
| Module-wise count rates for Quadrant B Data is divided into 100 sec bins |
 |
 |
| Module-wise count rates for Quadrant C Data is divided into 100 sec bins |
 |
 |
| Module-wise count rates for Quadrant D Data is divided into 100 sec bins |
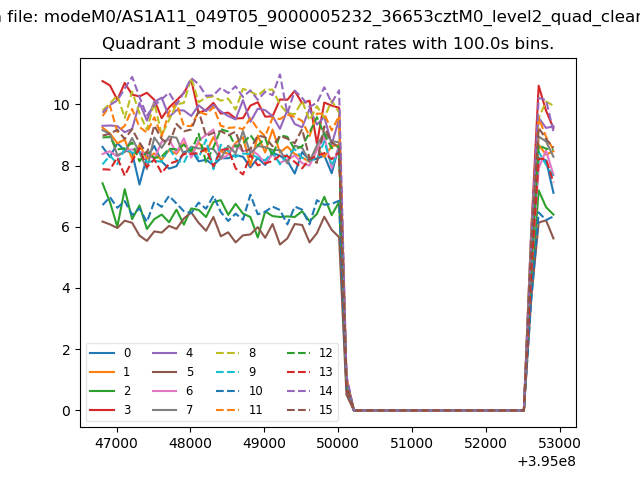 |
 |
| Parameter | Plot |
|---|---|
| CZT HV Monitor | 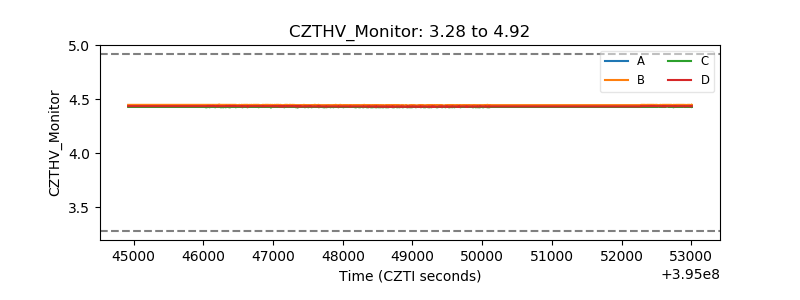 |
| D_VDD | 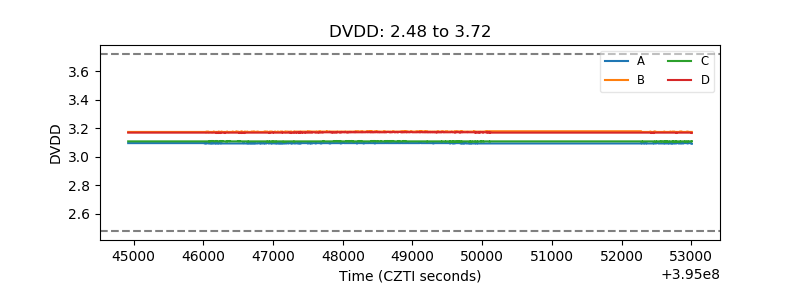 |
| Temperature 1 | 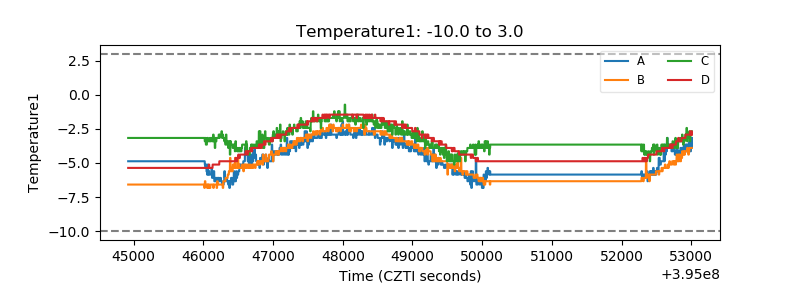 |
| Veto HV Monitor | 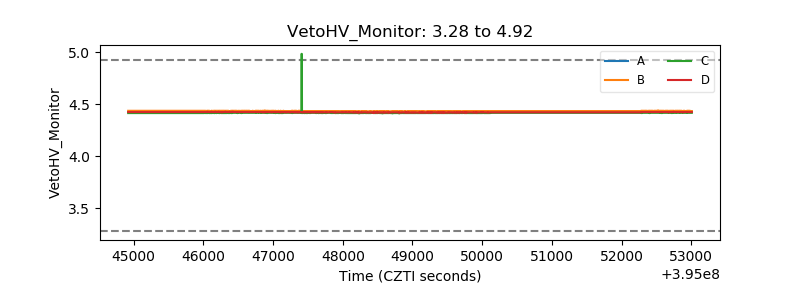 |
| Veto LLD | 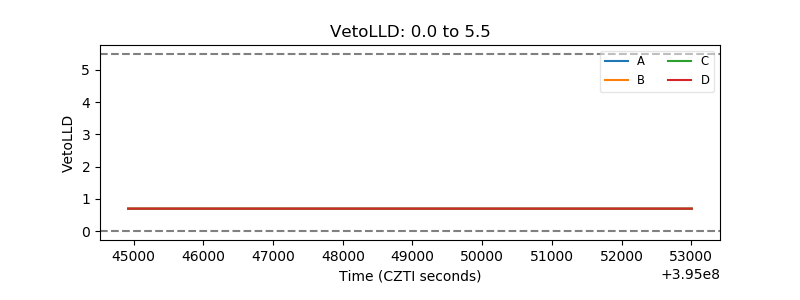 |
| Alpha Counter | 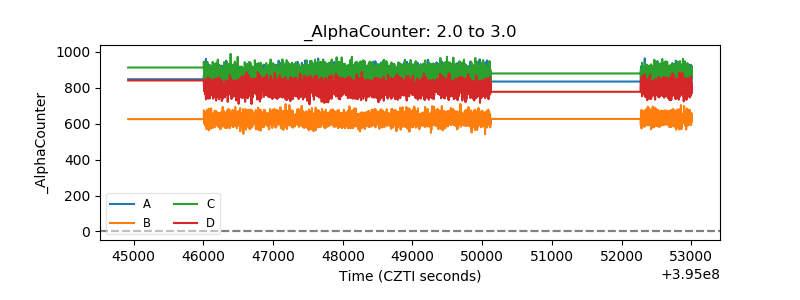 |
| _CPM_Rate | 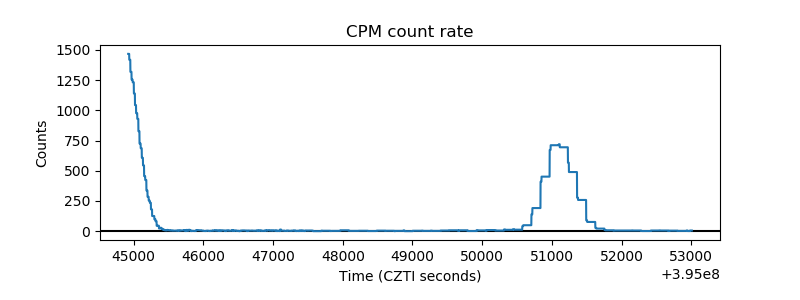 |
| CZT Counter | 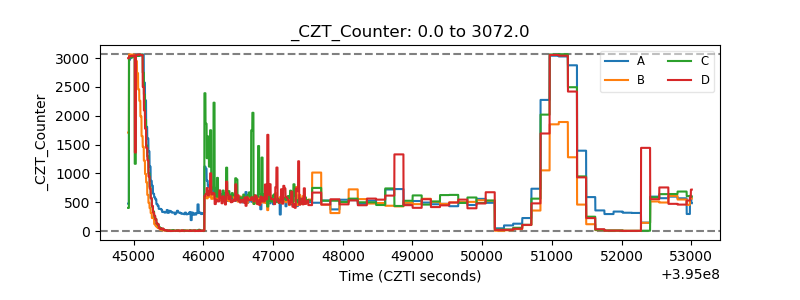 |
| +2.5 Volts monitor | 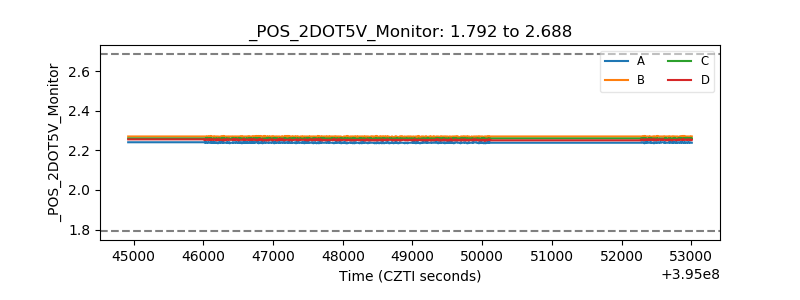 |
| +5 Volts monitor |  |
| _ROLL_ROT | 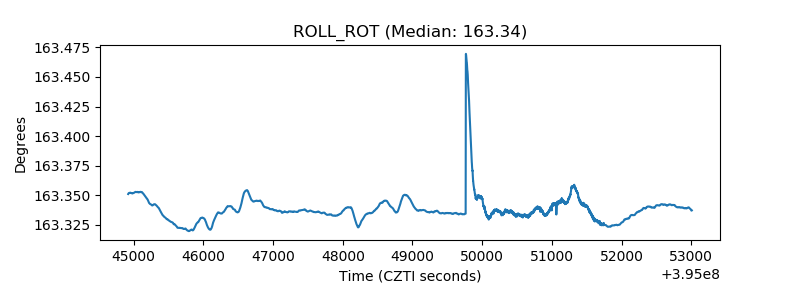 |
| _Roll_DEC | 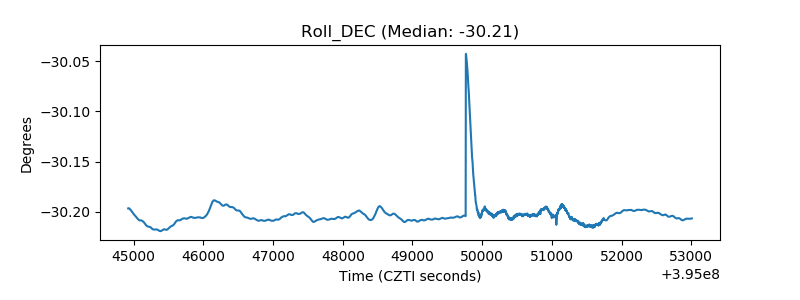 |
| _Roll_RA | 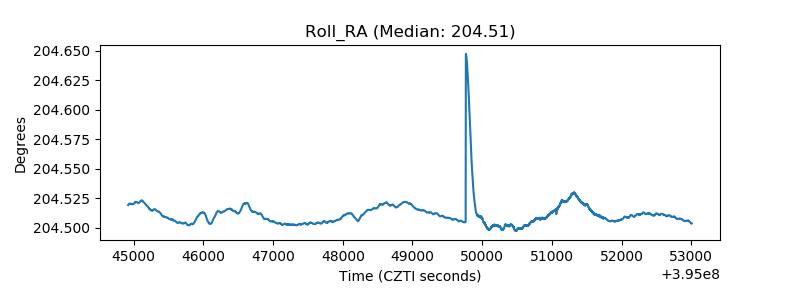 |
| Veto Counter | 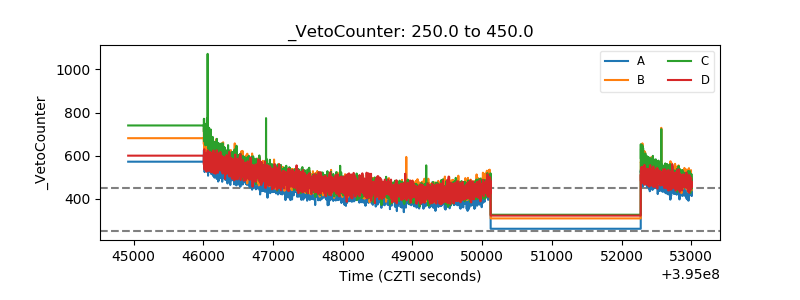 |