| Param | Original file | Final file |
|---|---|---|
| Filename | modeM0/AS1A11_049T05_9000005232_36655cztM0_level2.evt | modeM0/AS1A11_049T05_9000005232_36655cztM0_level2_quad_clean.evt |
| Size (bytes) | 448,407,360 | 86,817,600 |
| Size | 427.6 MB | 82.8 MB |
| Events in quadrant A | 2,713,797 | 580,871 |
| Events in quadrant B | 2,718,394 | 582,179 |
| Events in quadrant C | 3,084,747 | 564,347 |
| Events in quadrant D | 4,701,693 | 529,229 |
| Mode M9 | |||
|---|---|---|---|
| Quadrant | BADHDUFLAG | Total packets | Discarded packets |
| A | 0 | 28 | 0 |
| B | 0 | 28 | 0 |
| C | 0 | 28 | 0 |
| D | 0 | 29 | 0 |
| Mode M0 | |||
|---|---|---|---|
| Quadrant | BADHDUFLAG | Total packets | Discarded packets |
| A | 0 | 11285 | 3 |
| B | 0 | 11232 | 2 |
| C | 0 | 12359 | 2 |
| D | 0 | 17519 | 2 |
| Mode SS | |||
|---|---|---|---|
| Quadrant | BADHDUFLAG | Total packets | Discarded packets |
| A | 0 | 110 | 0 |
| B | 0 | 110 | 0 |
| C | 0 | 110 | 0 |
| D | 0 | 110 | 0 |
| Quadrant | Total seconds | Saturated seconds | Saturation percentage |
|---|---|---|---|
| A | 5313 | 19 | 0.357613% |
| B | 5313 | 15 | 0.282326% |
| C | 5313 | 135 | 2.540937% |
| D | 5313 | 566 | 10.653115% |
Noise dominated data is calculated using 1-second bins in cleaned event files. If a bin has >2000 counts, and if more than 50% of those come from <1% of pixels, then it is considered to be noise-dominated and hence unusable.
| Quadrant | # 1 sec bins | Bins with >0 counts | Bins with >2000 counts | High rate bins dominated by noise | Noise dominated (total time) | Noise dominated (detector-on time) | Marked lightcurve |
|---|---|---|---|---|---|---|---|
| A | 7076 | 5314 | 6 | 6 | 0.08% | 0.11% | 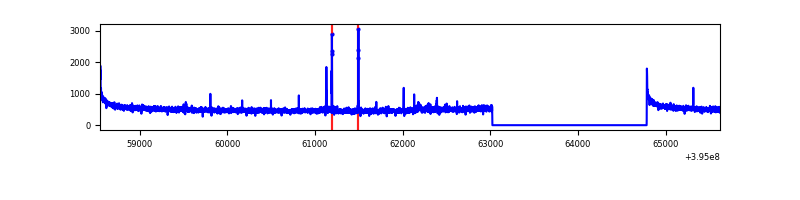 |
| B | 7076 | 5314 | 7 | 7 | 0.10% | 0.13% | 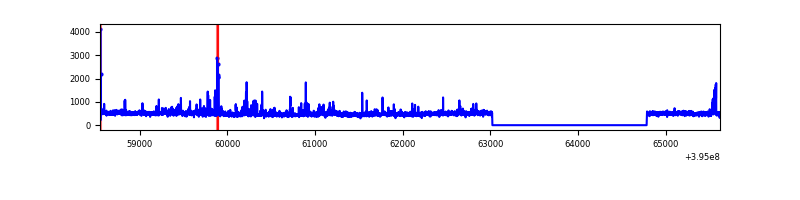 |
| C | 7076 | 5314 | 93 | 93 | 1.31% | 1.75% | 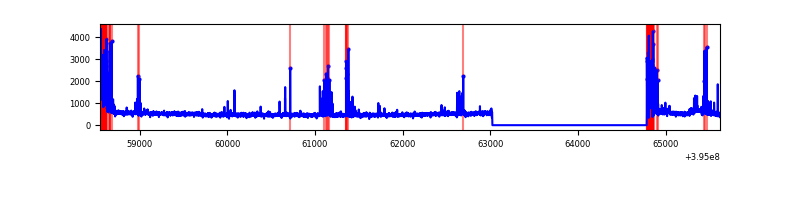 |
| D | 7076 | 5314 | 484 | 484 | 6.84% | 9.11% | 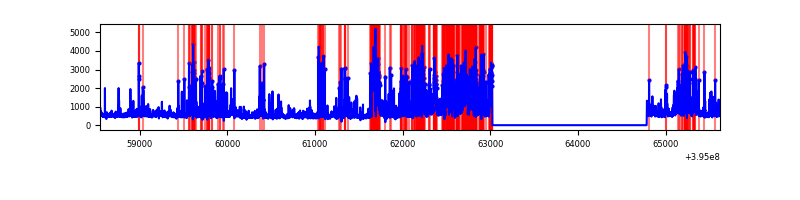 |
Top three noisy pixels from each quadrant. If the there are fewer than three noisy pixels in the level2.evt file, extra rows are filled as -1
| Pixel properties | Quadrant properties | ||||||
|---|---|---|---|---|---|---|---|
| Quadrant | DetID | PixID | Counts | Sigma | Mean | Median | Sigma |
| A | 10 | 83 | 214702 | 1691.91 | 630 | 618 | 126.5 |
| A | 9 | 143 | 22282 | 171.21 | 630 | 618 | 126.5 |
| A | 10 | 255 | 14276 | 107.94 | 630 | 618 | 126.5 |
| B | 0 | 221 | 116899 | 978.17 | 621 | 607 | 118.9 |
| B | 5 | 255 | 43250 | 358.68 | 621 | 607 | 118.9 |
| B | 0 | 190 | 33292 | 274.92 | 621 | 607 | 118.9 |
| C | 0 | 10 | 304521 | 2192.48 | 599 | 605 | 138.6 |
| C | 15 | 214 | 243239 | 1750.38 | 599 | 605 | 138.6 |
| C | 14 | 254 | 149921 | 1077.18 | 599 | 605 | 138.6 |
| D | 2 | 250 | 944421 | 6653.44 | 584 | 569 | 141.9 |
| D | 2 | 249 | 643673 | 4533.39 | 584 | 569 | 141.9 |
| D | 7 | 38 | 192805 | 1355.12 | 584 | 569 | 141.9 |
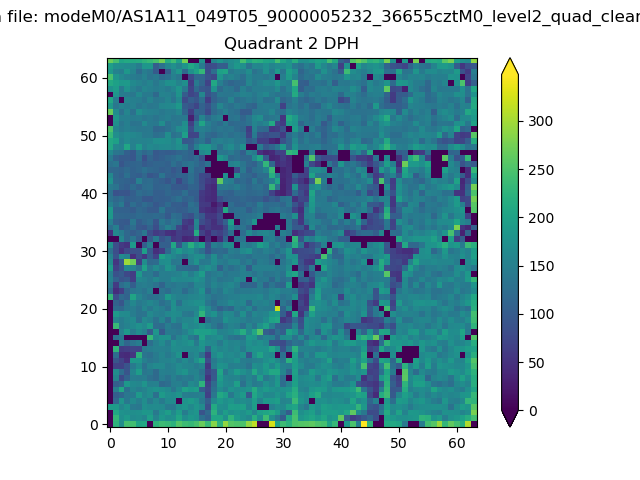
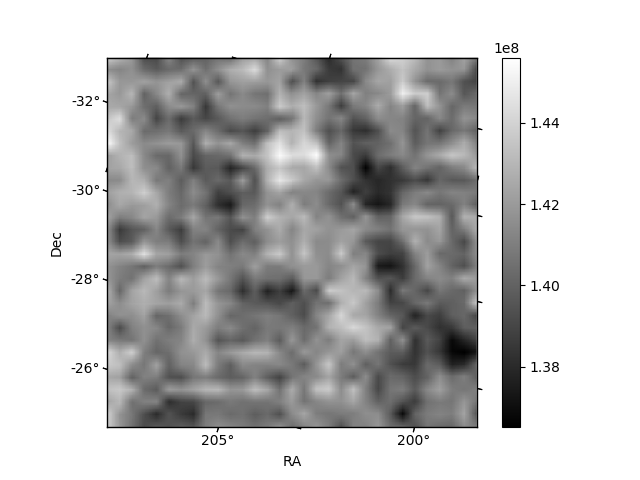
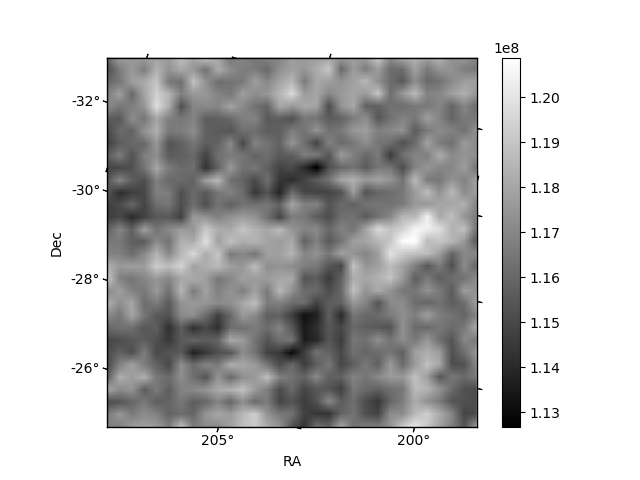
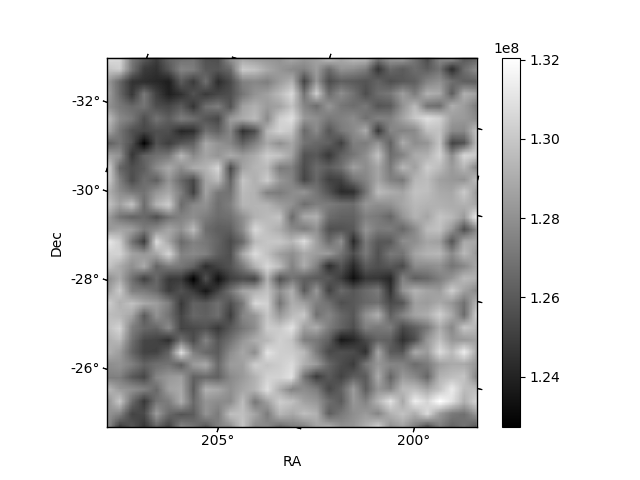
Histogram calculated using DETX and DETY for each event in the final _common_clean file
| Quadrant A |  |
 |
Quadrant B |
|---|---|---|---|
| Quadrant D | 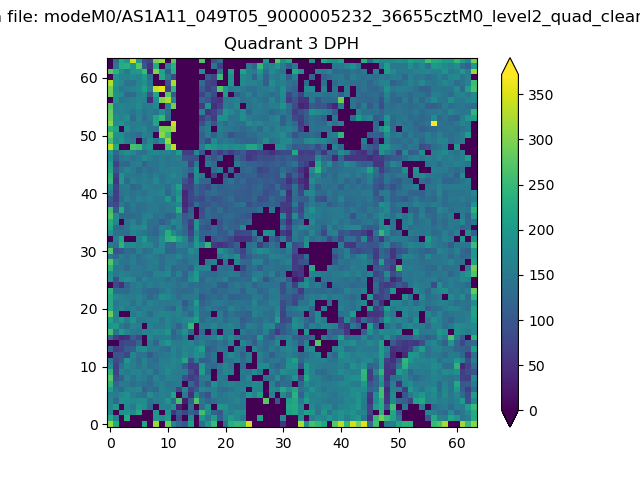 |
 |
Quadrant C |
| Plot type | Count rate plots | Images |
|---|---|---|
| Comparison with Poisson distribution Blue bars denote a histogram of data divided into 1 sec bins. Red curve is a Poisson curve with rate = median count rate of data. |
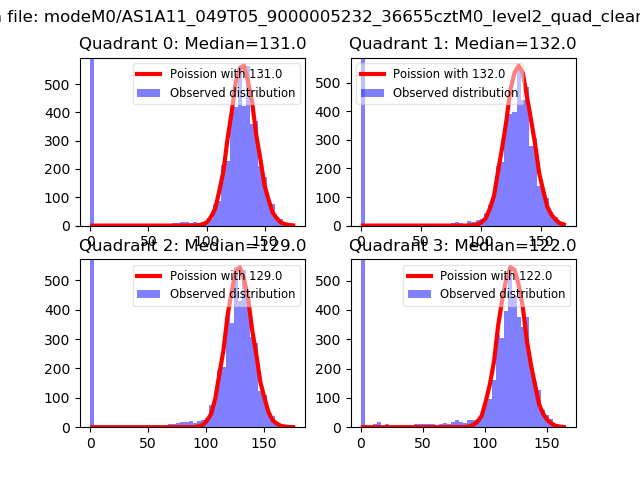 |
 |
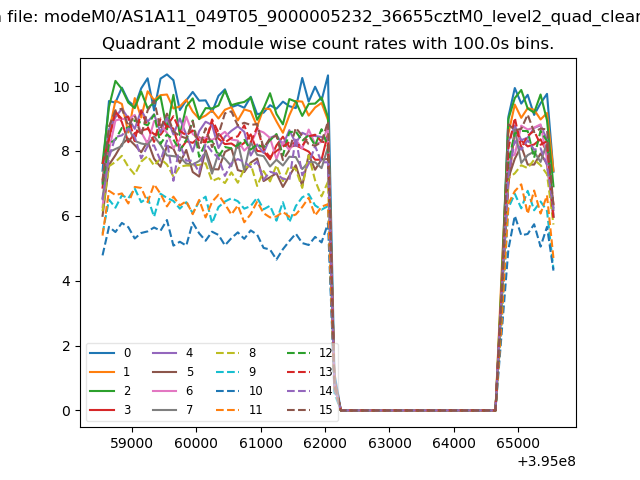
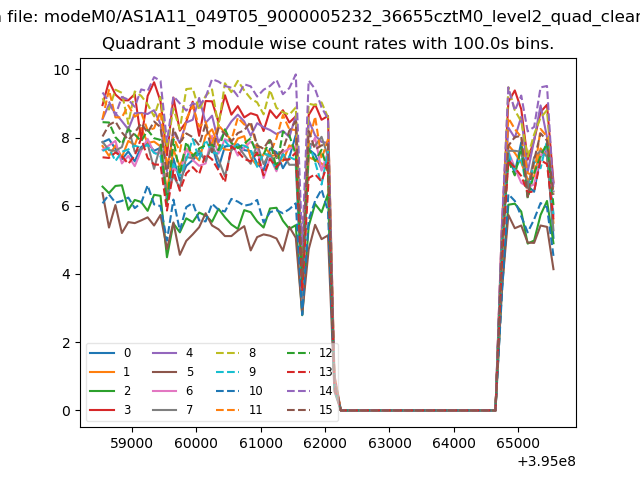
| Quadrant-wise count rates Data is divided into 100 sec bins |
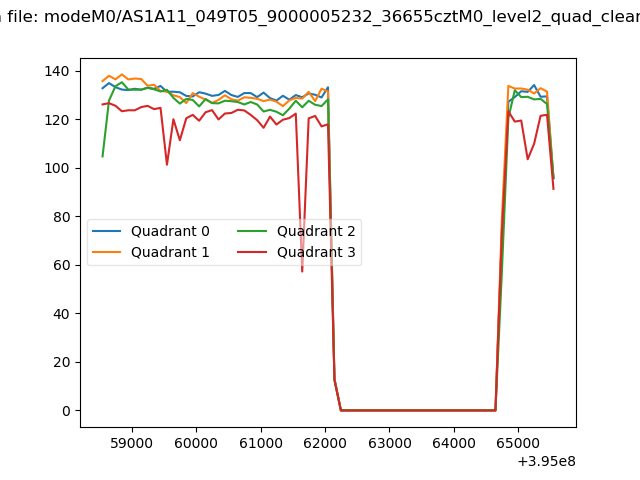 |
|
| Module-wise count rates for Quadrant A Data is divided into 100 sec bins |
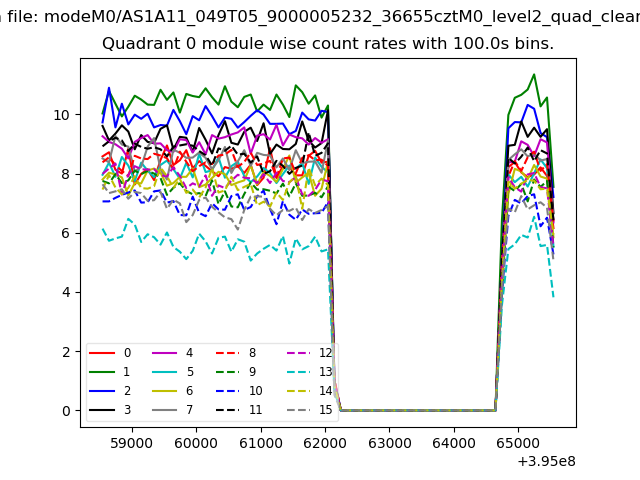 |
 |
| Module-wise count rates for Quadrant B Data is divided into 100 sec bins |
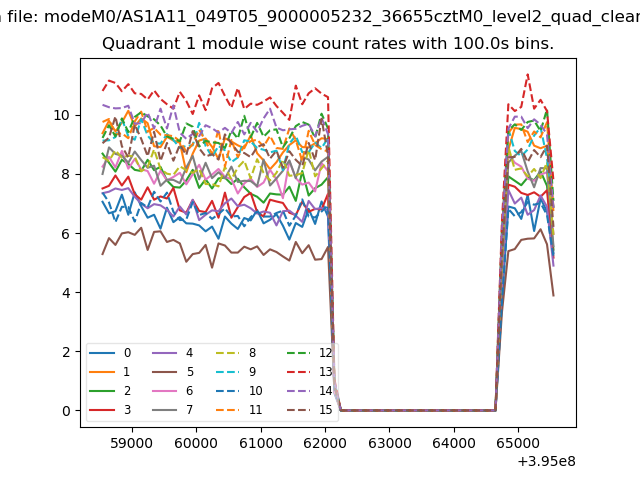 |
 |
| Module-wise count rates for Quadrant C Data is divided into 100 sec bins |
 |
 |
| Module-wise count rates for Quadrant D Data is divided into 100 sec bins |
 |
 |
| Parameter | Plot |
|---|---|
| CZT HV Monitor | 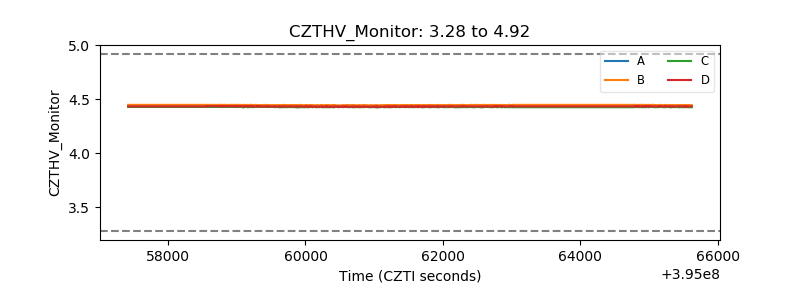 |
| D_VDD | 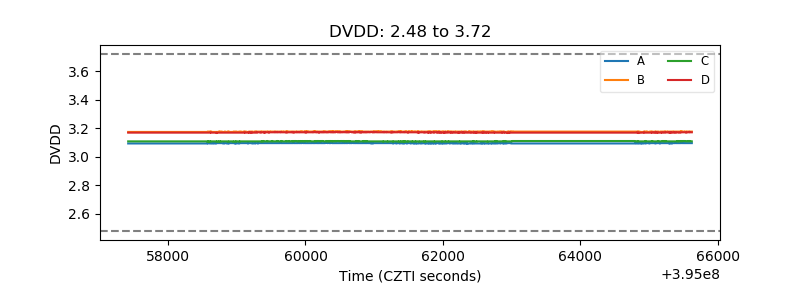 |
| Temperature 1 | 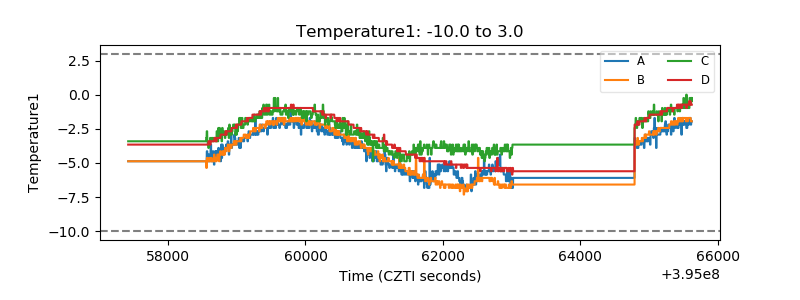 |
| Veto HV Monitor | 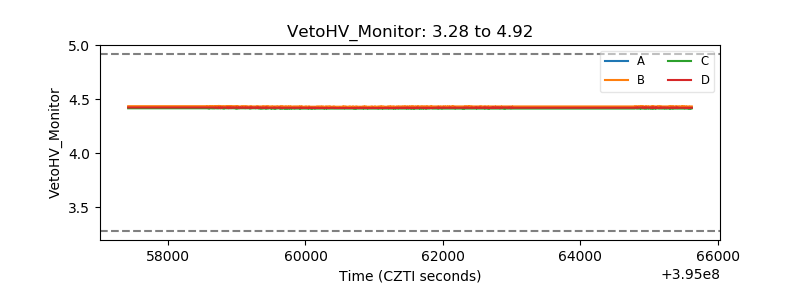 |
| Veto LLD | 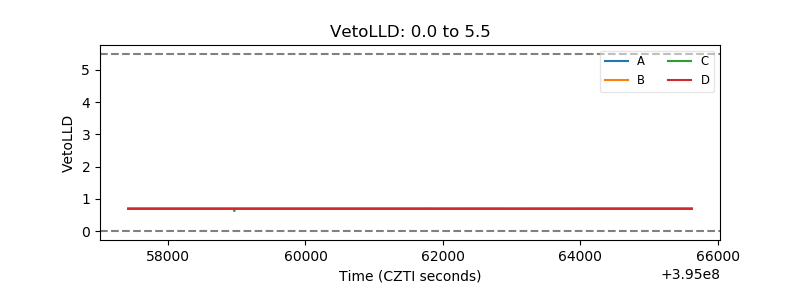 |
| Alpha Counter | 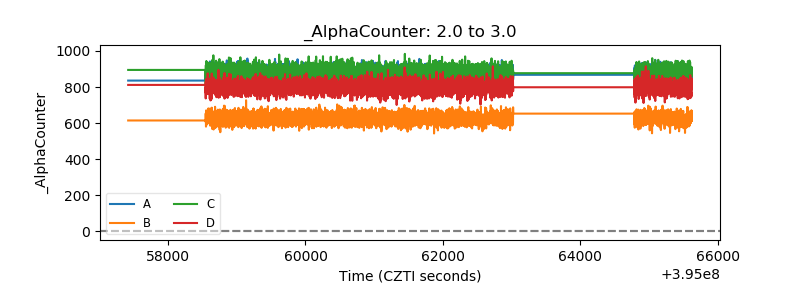 |
| _CPM_Rate | 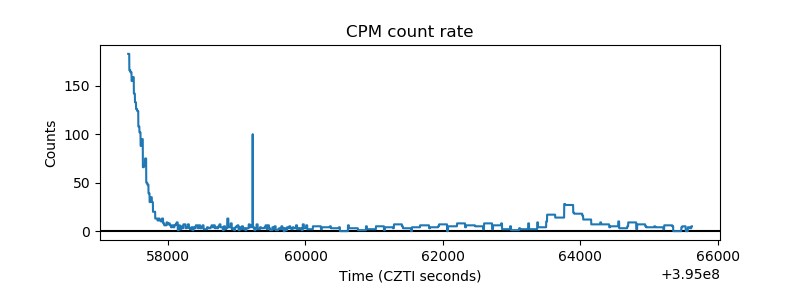 |
| CZT Counter | 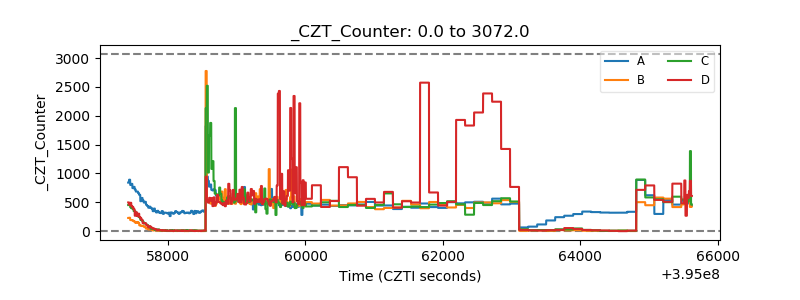 |
| +2.5 Volts monitor |  |
| +5 Volts monitor | 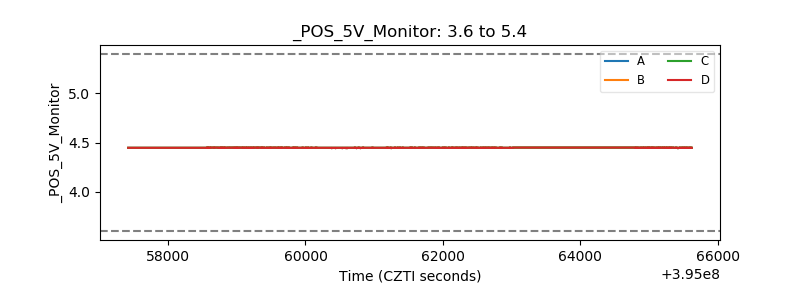 |
| _ROLL_ROT | 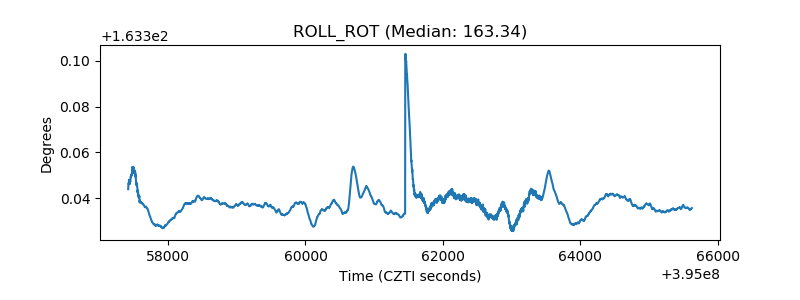 |
| _Roll_DEC | 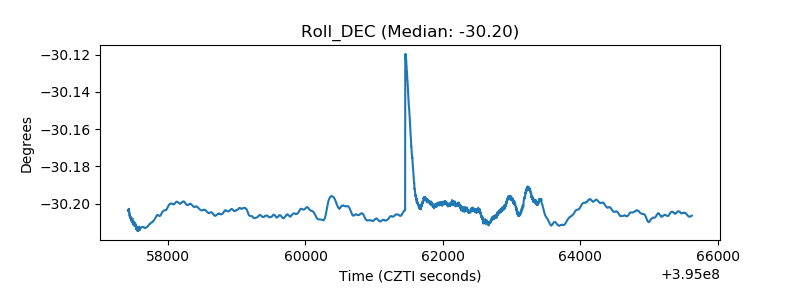 |
| _Roll_RA | 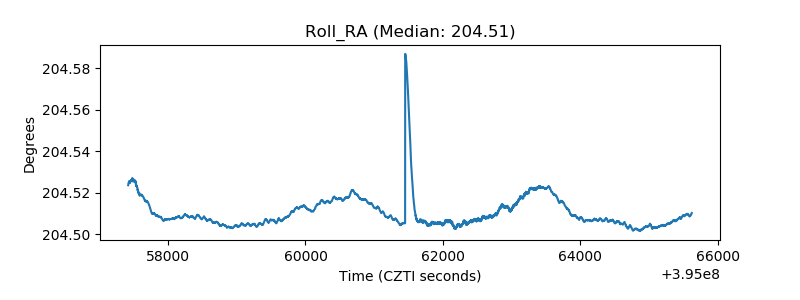 |
| Veto Counter | 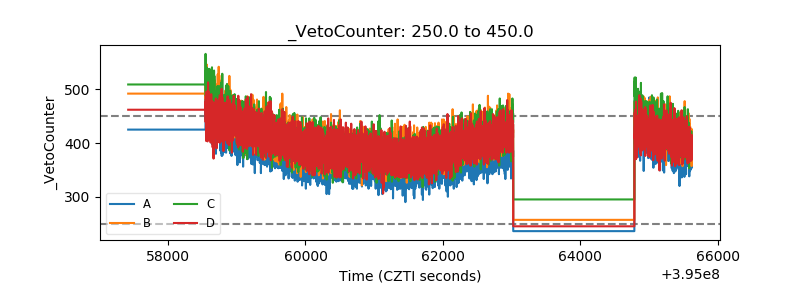 |