| Param | Original file | Final file |
|---|---|---|
| Filename | modeM0/AS1A11_049T05_9000005232_36656cztM0_level2.evt | modeM0/AS1A11_049T05_9000005232_36656cztM0_level2_quad_clean.evt |
| Size (bytes) | 490,631,040 | 80,997,120 |
| Size | 467.9 MB | 77.2 MB |
| Events in quadrant A | 2,952,889 | 530,579 |
| Events in quadrant B | 3,139,158 | 529,971 |
| Events in quadrant C | 3,723,673 | 503,774 |
| Events in quadrant D | 4,649,930 | 483,264 |
| Mode M9 | |||
|---|---|---|---|
| Quadrant | BADHDUFLAG | Total packets | Discarded packets |
| A | 0 | 18 | 0 |
| B | 0 | 18 | 0 |
| C | 0 | 18 | 0 |
| D | 0 | 19 | 0 |
| Mode M0 | |||
|---|---|---|---|
| Quadrant | BADHDUFLAG | Total packets | Discarded packets |
| A | 0 | 12368 | 3 |
| B | 0 | 12959 | 2 |
| C | 0 | 14650 | 2 |
| D | 0 | 17756 | 2 |
| Mode SS | |||
|---|---|---|---|
| Quadrant | BADHDUFLAG | Total packets | Discarded packets |
| A | 0 | 118 | 0 |
| B | 0 | 118 | 0 |
| C | 0 | 118 | 0 |
| D | 0 | 118 | 0 |
| Quadrant | Total seconds | Saturated seconds | Saturation percentage |
|---|---|---|---|
| A | 5793 | 24 | 0.414293% |
| B | 5793 | 77 | 1.329190% |
| C | 5793 | 262 | 4.522700% |
| D | 5793 | 329 | 5.679268% |
Noise dominated data is calculated using 1-second bins in cleaned event files. If a bin has >2000 counts, and if more than 50% of those come from <1% of pixels, then it is considered to be noise-dominated and hence unusable.
| Quadrant | # 1 sec bins | Bins with >0 counts | Bins with >2000 counts | High rate bins dominated by noise | Noise dominated (total time) | Noise dominated (detector-on time) | Marked lightcurve |
|---|---|---|---|---|---|---|---|
| A | 7226 | 5794 | 15 | 15 | 0.21% | 0.26% | 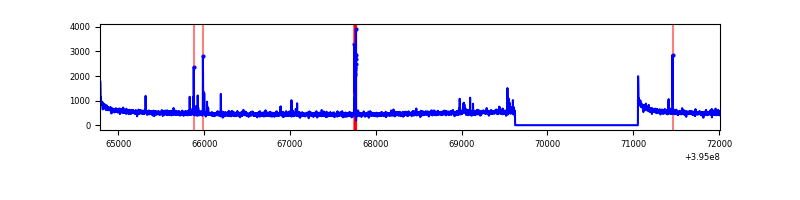 |
| B | 7226 | 5794 | 41 | 41 | 0.57% | 0.71% | 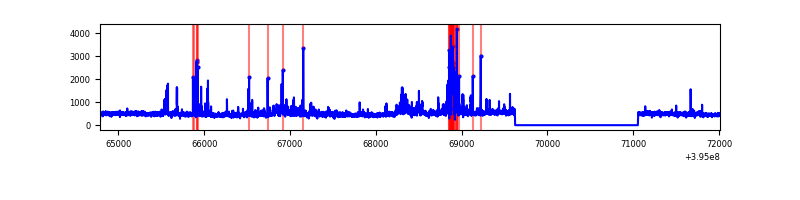 |
| C | 7226 | 5794 | 201 | 201 | 2.78% | 3.47% | 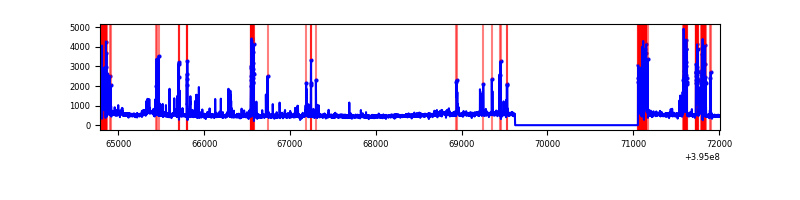 |
| D | 7226 | 5794 | 250 | 250 | 3.46% | 4.31% | 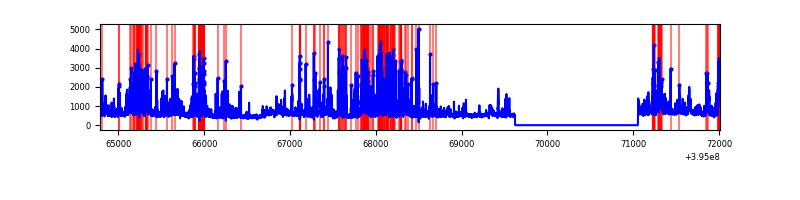 |
Top three noisy pixels from each quadrant. If the there are fewer than three noisy pixels in the level2.evt file, extra rows are filled as -1
| Pixel properties | Quadrant properties | ||||||
|---|---|---|---|---|---|---|---|
| Quadrant | DetID | PixID | Counts | Sigma | Mean | Median | Sigma |
| A | 10 | 83 | 225092 | 1643.63 | 677 | 664 | 136.5 |
| A | 9 | 143 | 80912 | 587.71 | 677 | 664 | 136.5 |
| A | 13 | 6 | 14478 | 101.17 | 677 | 664 | 136.5 |
| B | 4 | 171 | 132304 | 1020.06 | 667 | 649 | 129.1 |
| B | 5 | 255 | 131977 | 1017.53 | 667 | 649 | 129.1 |
| B | 0 | 190 | 56327 | 431.39 | 667 | 649 | 129.1 |
| C | 0 | 10 | 322040 | 2161.69 | 639 | 644 | 148.7 |
| C | 15 | 159 | 262696 | 1762.54 | 639 | 644 | 148.7 |
| C | 15 | 214 | 261280 | 1753.02 | 639 | 644 | 148.7 |
| D | 2 | 249 | 560983 | 3572.29 | 643 | 626 | 156.9 |
| D | 2 | 250 | 431801 | 2748.75 | 643 | 626 | 156.9 |
| D | 12 | 235 | 415020 | 2641.77 | 643 | 626 | 156.9 |
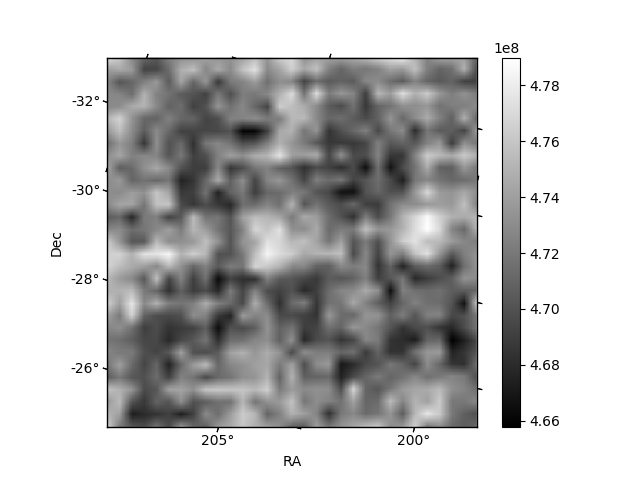
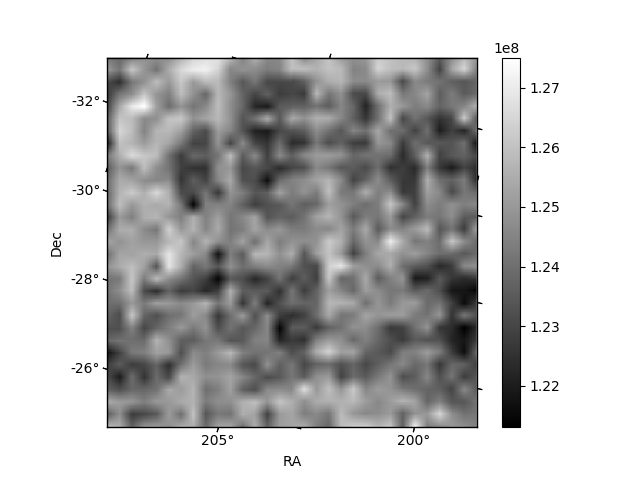
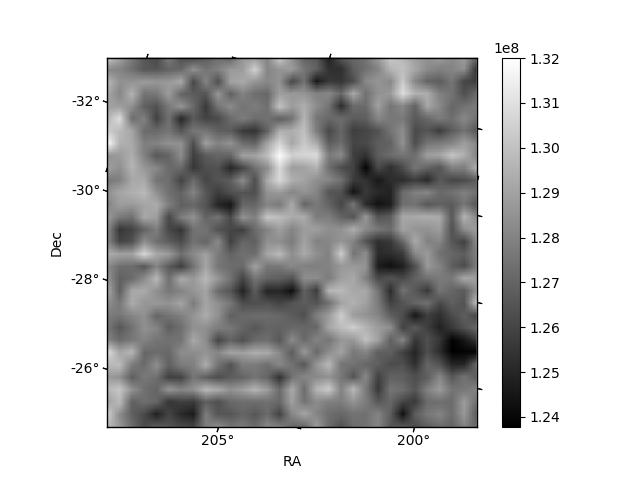
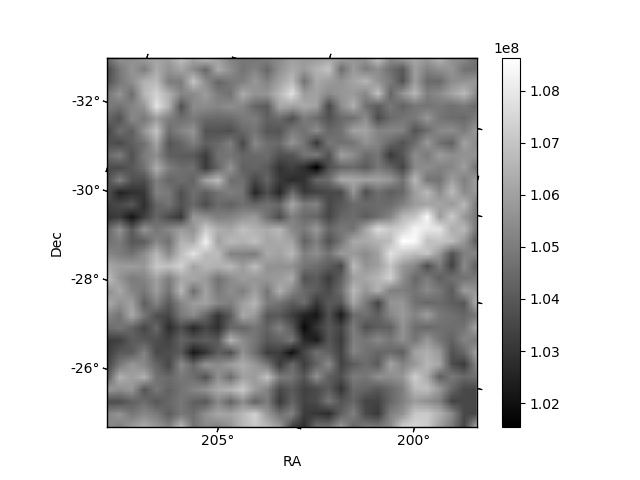
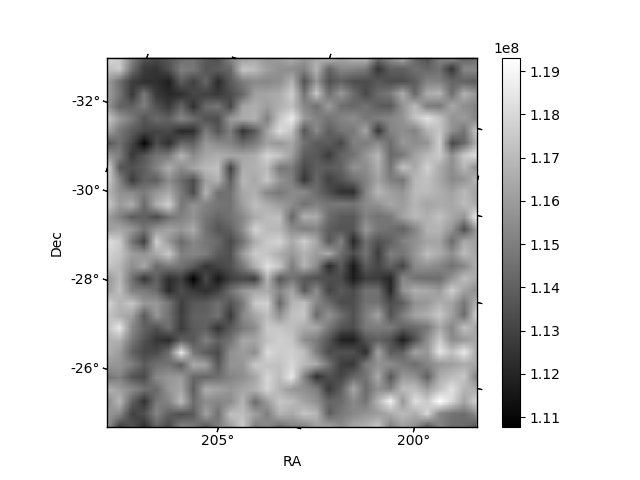
Histogram calculated using DETX and DETY for each event in the final _common_clean file
| Quadrant A | 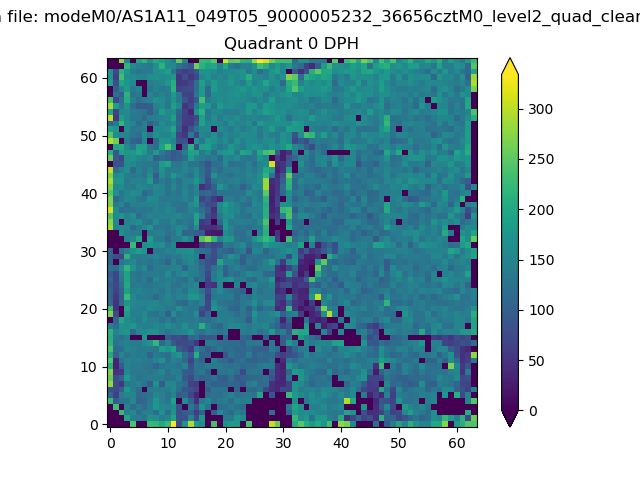 |
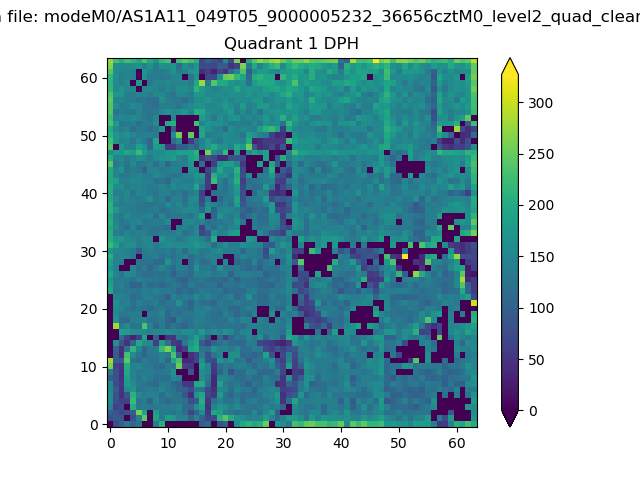 |
Quadrant B |
|---|---|---|---|
| Quadrant D |  |
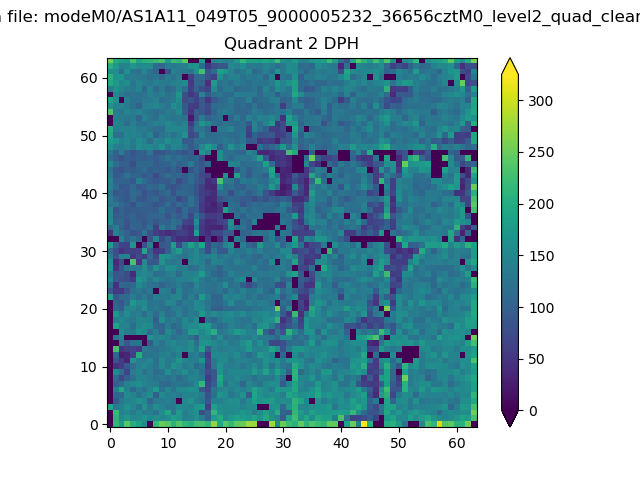 |
Quadrant C |
| Plot type | Count rate plots | Images |
|---|---|---|
| Comparison with Poisson distribution Blue bars denote a histogram of data divided into 1 sec bins. Red curve is a Poisson curve with rate = median count rate of data. |
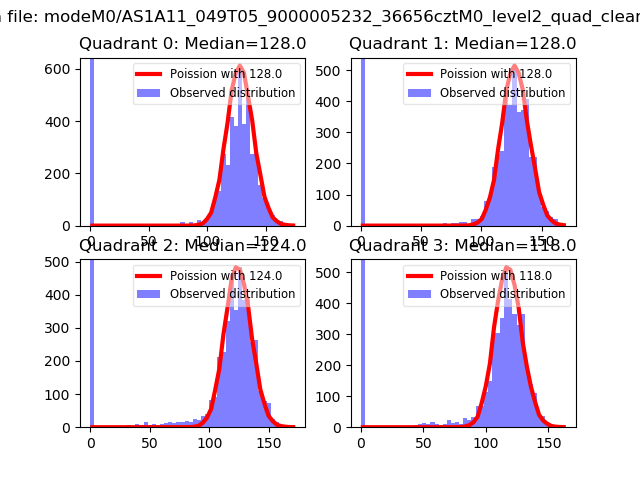 |
 |
| Quadrant-wise count rates Data is divided into 100 sec bins |
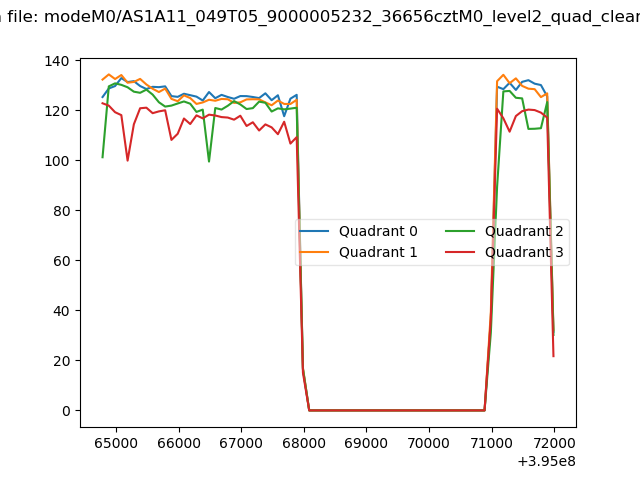 |
|
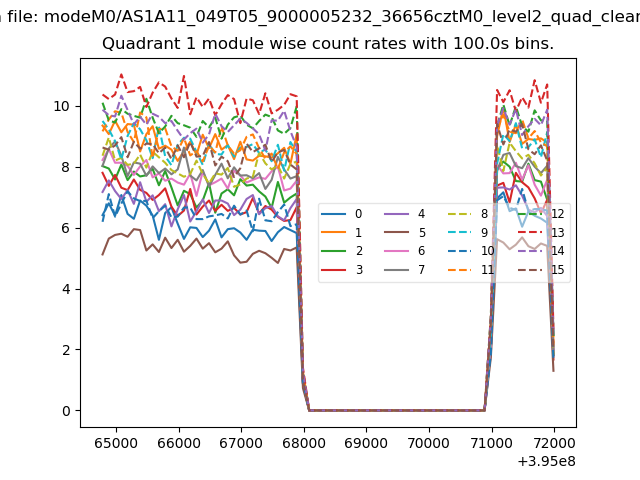
| Module-wise count rates for Quadrant A Data is divided into 100 sec bins |
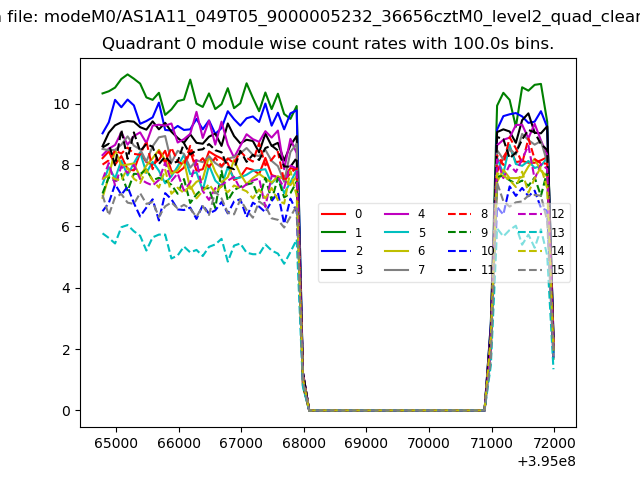 |
 |
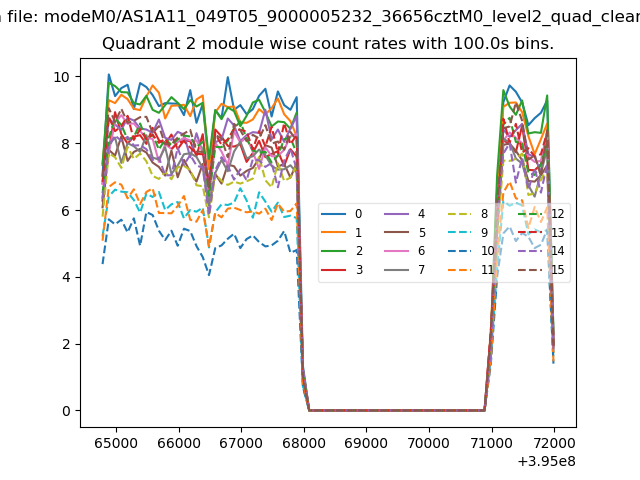
| Module-wise count rates for Quadrant B Data is divided into 100 sec bins |
 |
 |
| Module-wise count rates for Quadrant C Data is divided into 100 sec bins |
 |
 |
| Module-wise count rates for Quadrant D Data is divided into 100 sec bins |
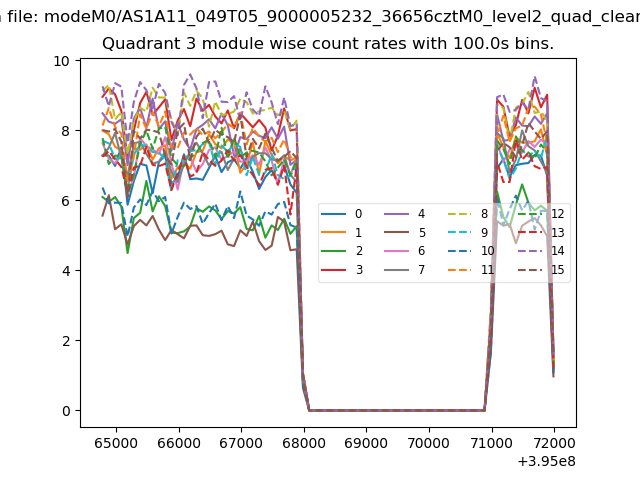 |
 |
| Parameter | Plot |
|---|---|
| CZT HV Monitor | 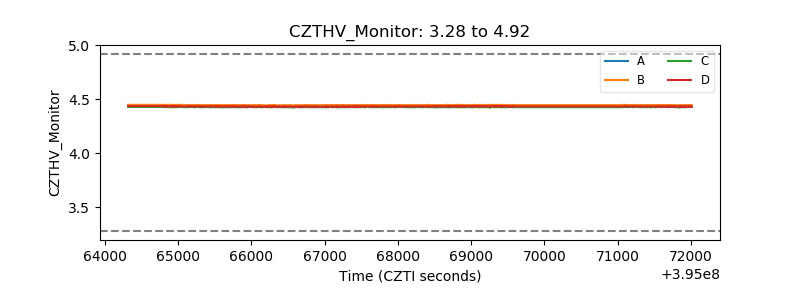 |
| D_VDD | 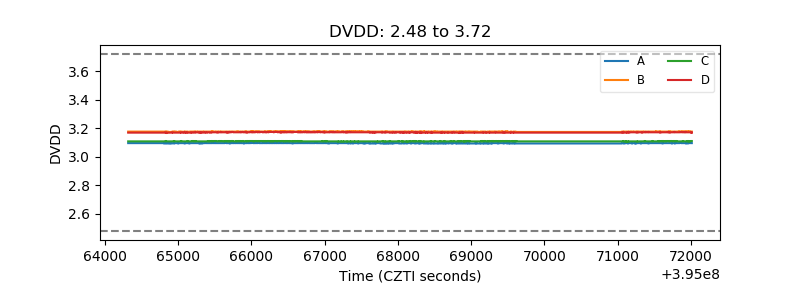 |
| Temperature 1 | 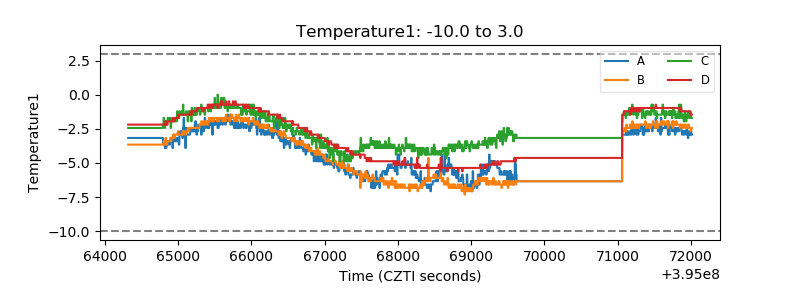 |
| Veto HV Monitor | 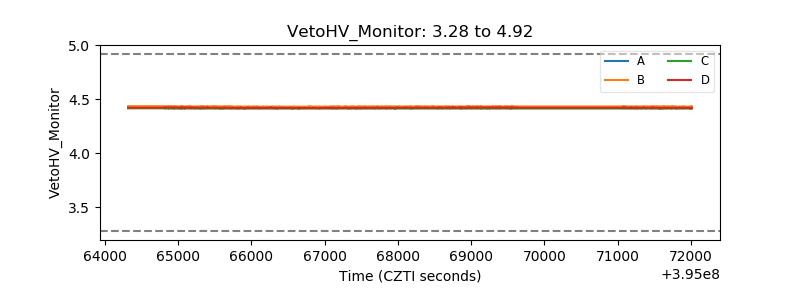 |
| Veto LLD | 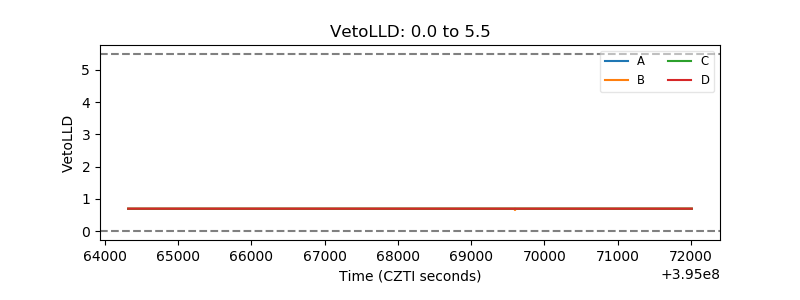 |
| Alpha Counter | 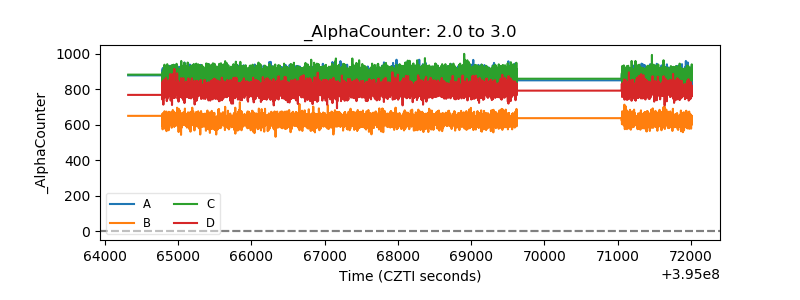 |
| _CPM_Rate | 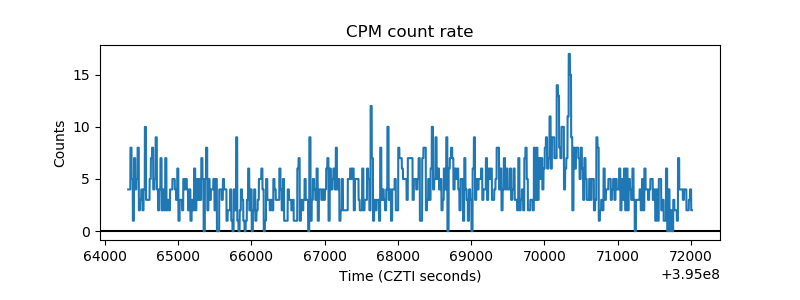 |
| CZT Counter |  |
| +2.5 Volts monitor |  |
| +5 Volts monitor |  |
| _ROLL_ROT | 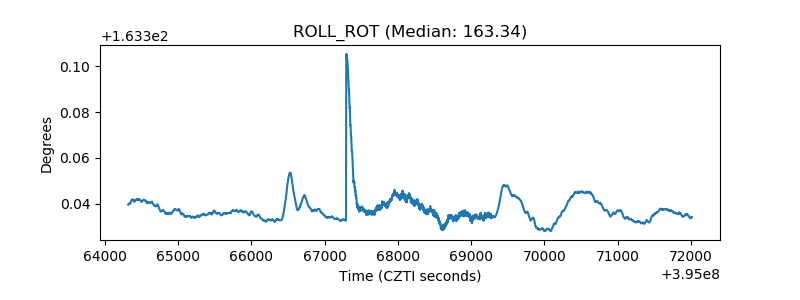 |
| _Roll_DEC | 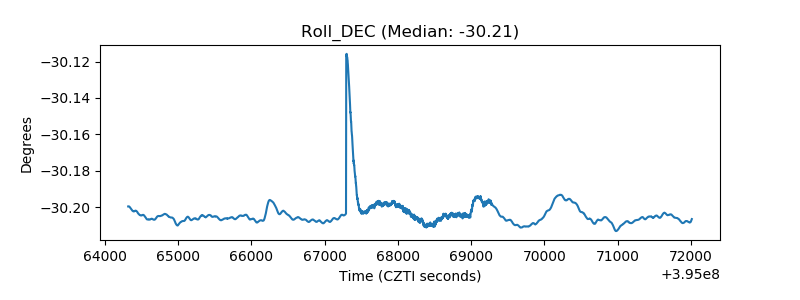 |
| _Roll_RA |  |
| Veto Counter | 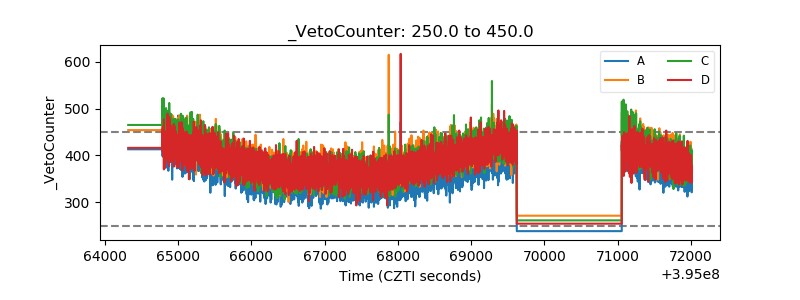 |