| Param | Original file | Final file |
|---|---|---|
| Filename | modeM0/AS1A11_049T05_9000005232_36657cztM0_level2.evt | modeM0/AS1A11_049T05_9000005232_36657cztM0_level2_quad_clean.evt |
| Size (bytes) | 477,607,680 | 72,299,520 |
| Size | 455.5 MB | 69.0 MB |
| Events in quadrant A | 2,938,818 | 462,245 |
| Events in quadrant B | 2,847,996 | 461,902 |
| Events in quadrant C | 3,439,916 | 439,332 |
| Events in quadrant D | 4,841,708 | 417,609 |
| Mode M9 | |||
|---|---|---|---|
| Quadrant | BADHDUFLAG | Total packets | Discarded packets |
| A | 0 | 21 | 0 |
| B | 0 | 21 | 0 |
| C | 0 | 21 | 0 |
| D | 0 | 22 | 0 |
| Mode M0 | |||
|---|---|---|---|
| Quadrant | BADHDUFLAG | Total packets | Discarded packets |
| A | 0 | 12393 | 3 |
| B | 0 | 12128 | 2 |
| C | 0 | 13834 | 2 |
| D | 0 | 18365 | 2 |
| Mode SS | |||
|---|---|---|---|
| Quadrant | BADHDUFLAG | Total packets | Discarded packets |
| A | 0 | 116 | 0 |
| B | 0 | 116 | 0 |
| C | 0 | 116 | 0 |
| D | 0 | 116 | 0 |
| Quadrant | Total seconds | Saturated seconds | Saturation percentage |
|---|---|---|---|
| A | 5845 | 20 | 0.342173% |
| B | 5845 | 11 | 0.188195% |
| C | 5845 | 180 | 3.079555% |
| D | 5845 | 300 | 5.132592% |
Noise dominated data is calculated using 1-second bins in cleaned event files. If a bin has >2000 counts, and if more than 50% of those come from <1% of pixels, then it is considered to be noise-dominated and hence unusable.
| Quadrant | # 1 sec bins | Bins with >0 counts | Bins with >2000 counts | High rate bins dominated by noise | Noise dominated (total time) | Noise dominated (detector-on time) | Marked lightcurve |
|---|---|---|---|---|---|---|---|
| A | 7158 | 5846 | 6 | 6 | 0.08% | 0.10% | 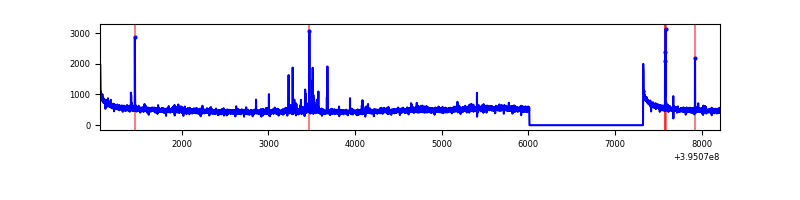 |
| B | 7158 | 5846 | 1 | 1 | 0.01% | 0.02% | 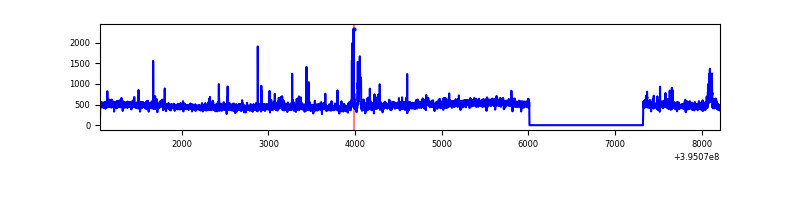 |
| C | 7158 | 5846 | 143 | 143 | 2.00% | 2.45% | 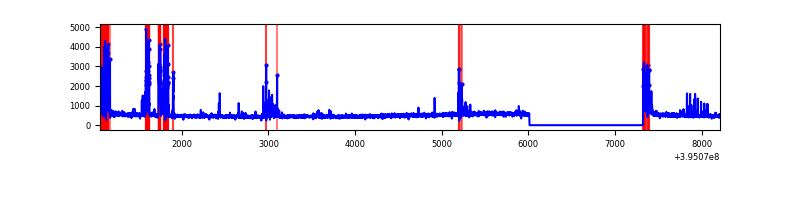 |
| D | 7158 | 5846 | 270 | 270 | 3.77% | 4.62% | 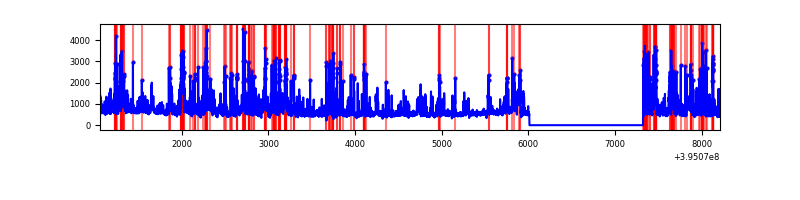 |
Top three noisy pixels from each quadrant. If the there are fewer than three noisy pixels in the level2.evt file, extra rows are filled as -1
| Pixel properties | Quadrant properties | ||||||
|---|---|---|---|---|---|---|---|
| Quadrant | DetID | PixID | Counts | Sigma | Mean | Median | Sigma |
| A | 10 | 83 | 220745 | 1606.2 | 680 | 667 | 137.0 |
| A | 9 | 143 | 50805 | 365.92 | 680 | 667 | 137.0 |
| A | 2 | 247 | 13358 | 92.62 | 680 | 667 | 137.0 |
| B | 0 | 221 | 40891 | 310.7 | 674 | 658 | 129.5 |
| B | 5 | 255 | 39339 | 298.71 | 674 | 658 | 129.5 |
| B | 0 | 190 | 39266 | 298.15 | 674 | 658 | 129.5 |
| C | 0 | 10 | 283126 | 1875.6 | 647 | 651 | 150.6 |
| C | 15 | 214 | 264871 | 1754.39 | 647 | 651 | 150.6 |
| C | 15 | 159 | 253565 | 1679.32 | 647 | 651 | 150.6 |
| D | 7 | 223 | 1032259 | 6563.39 | 647 | 630 | 157.2 |
| D | 12 | 235 | 510839 | 3246.03 | 647 | 630 | 157.2 |
| D | 2 | 250 | 227064 | 1440.61 | 647 | 630 | 157.2 |
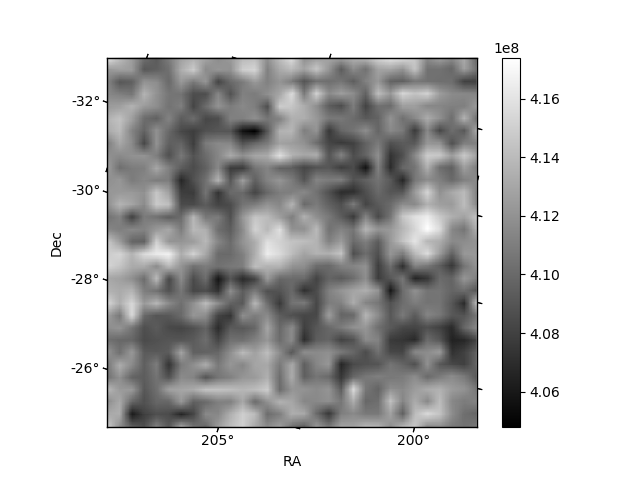
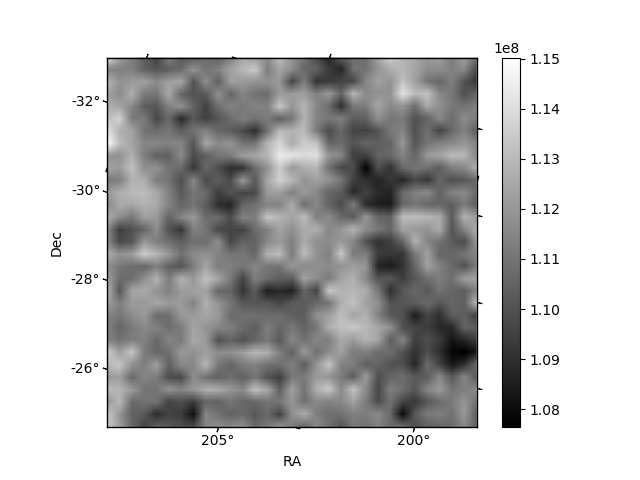
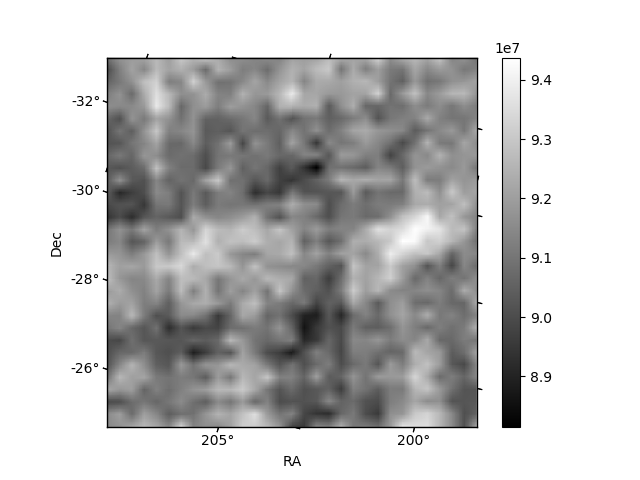
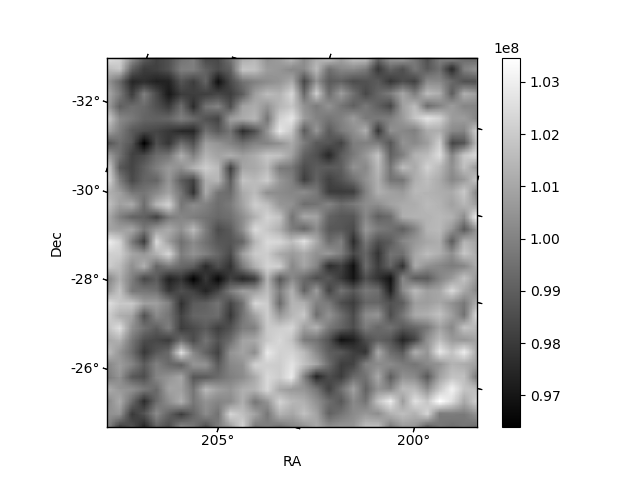
Histogram calculated using DETX and DETY for each event in the final _common_clean file
| Quadrant A | 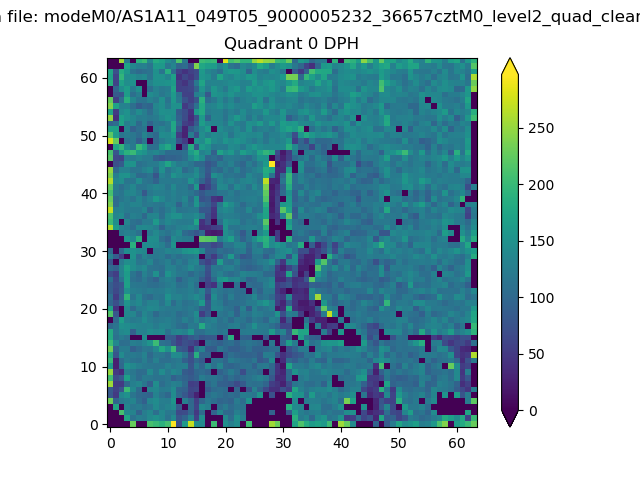 |
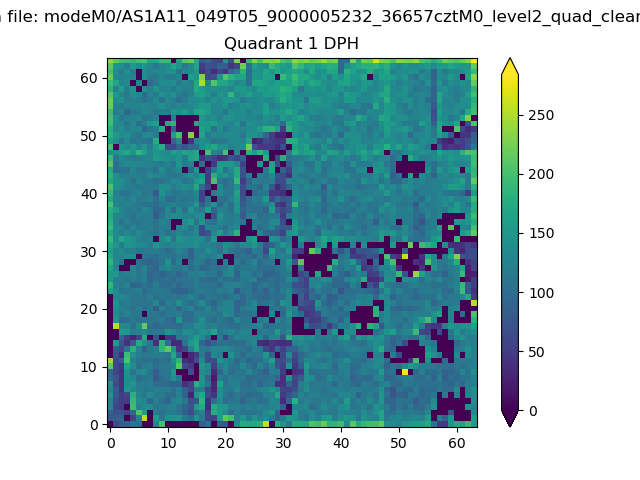 |
Quadrant B |
|---|---|---|---|
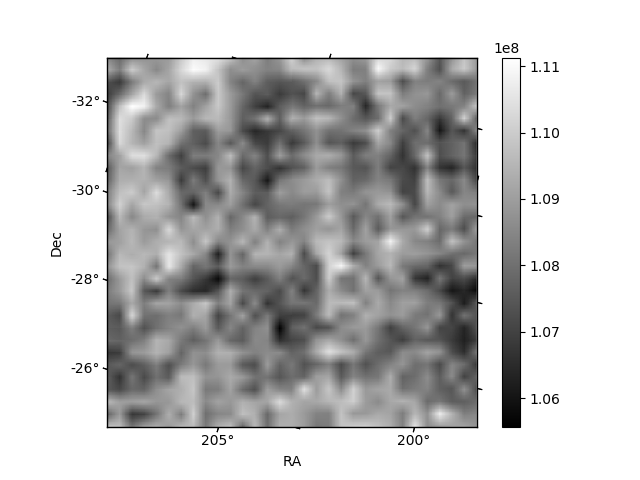
| Quadrant D | 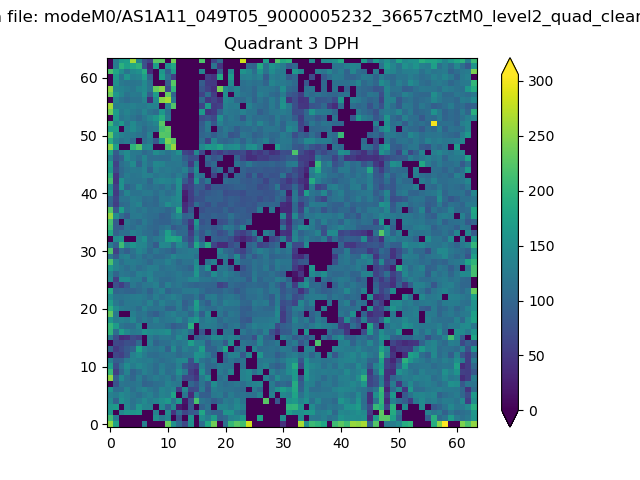 |
 |
Quadrant C |
| Plot type | Count rate plots | Images |
|---|---|---|
| Comparison with Poisson distribution Blue bars denote a histogram of data divided into 1 sec bins. Red curve is a Poisson curve with rate = median count rate of data. |
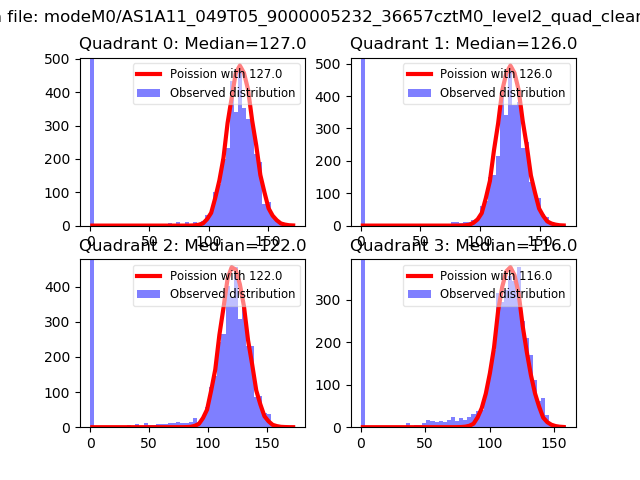 |
 |
| Quadrant-wise count rates Data is divided into 100 sec bins |
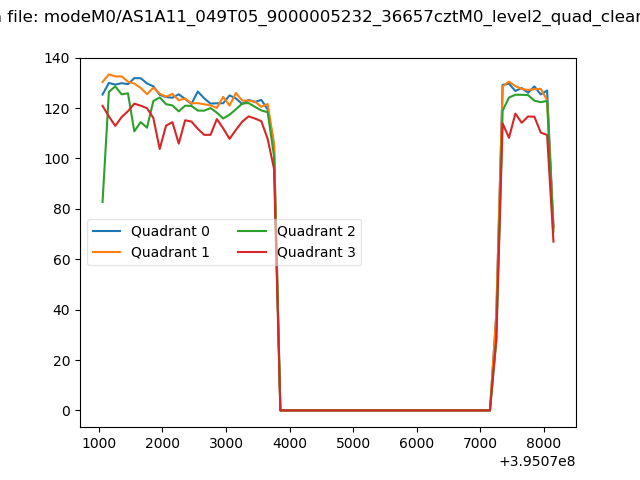 |
|
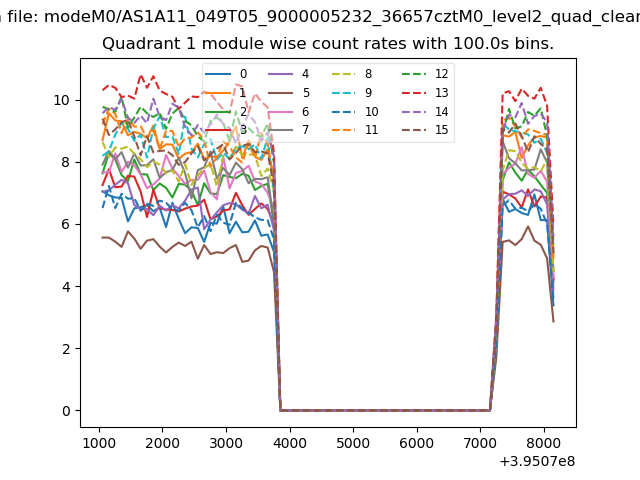
| Module-wise count rates for Quadrant A Data is divided into 100 sec bins |
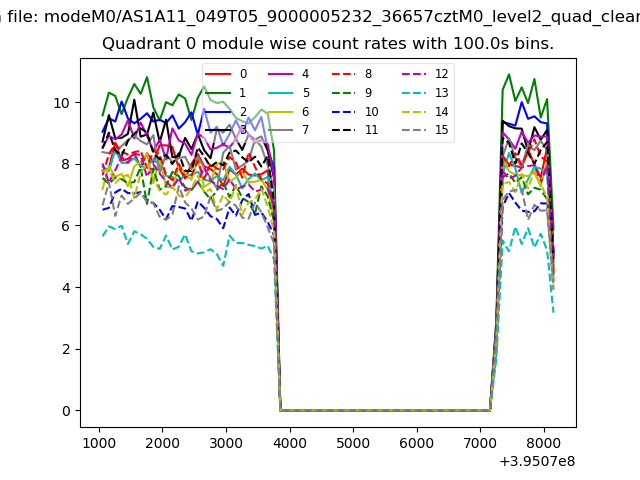 |
 |
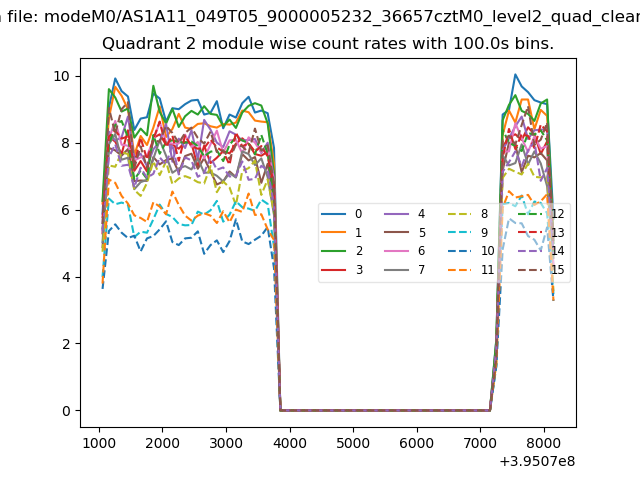
| Module-wise count rates for Quadrant B Data is divided into 100 sec bins |
 |
 |
| Module-wise count rates for Quadrant C Data is divided into 100 sec bins |
 |
 |
| Module-wise count rates for Quadrant D Data is divided into 100 sec bins |
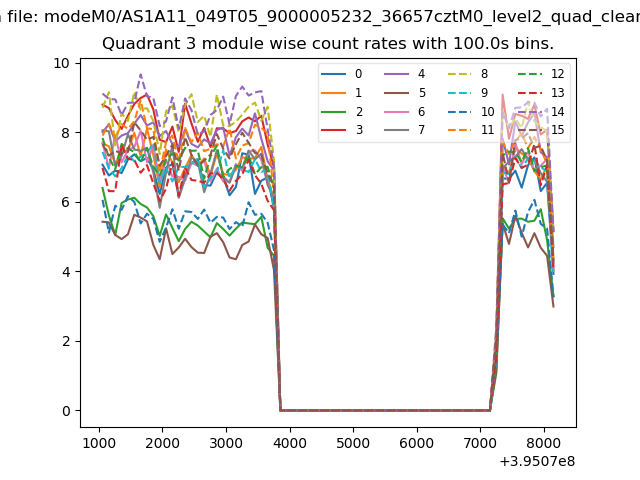 |
 |
| Parameter | Plot |
|---|---|
| CZT HV Monitor | 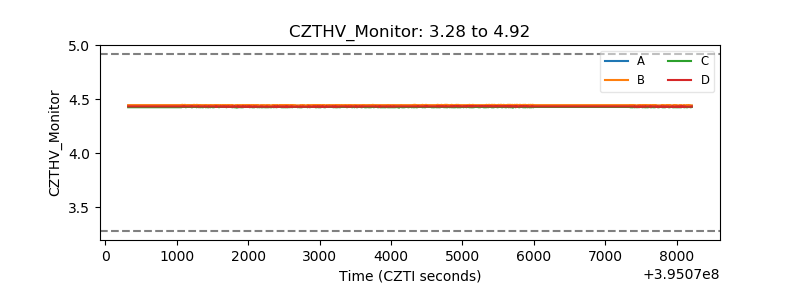 |
| D_VDD | 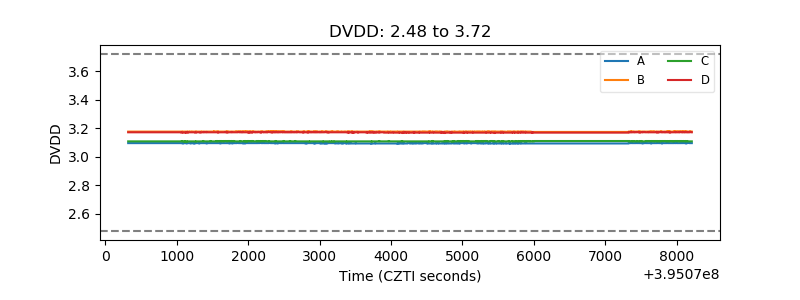 |
| Temperature 1 | 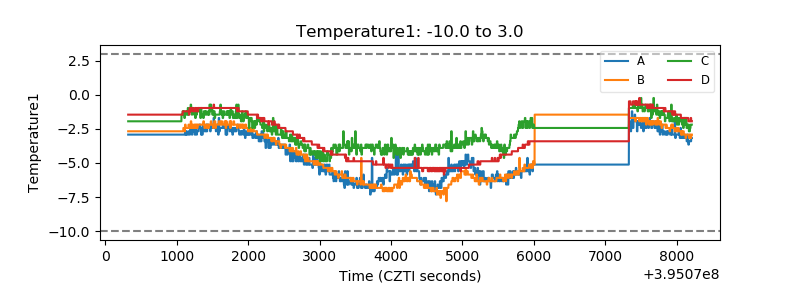 |
| Veto HV Monitor | 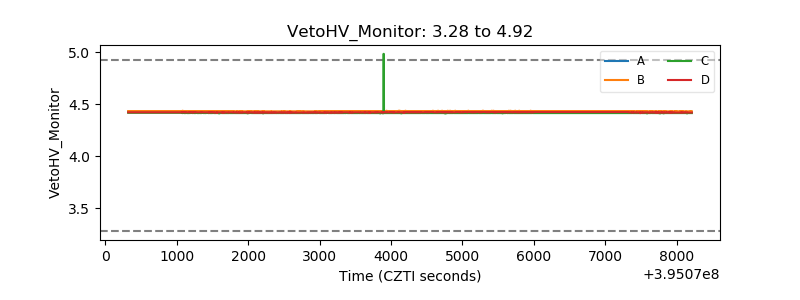 |
| Veto LLD | 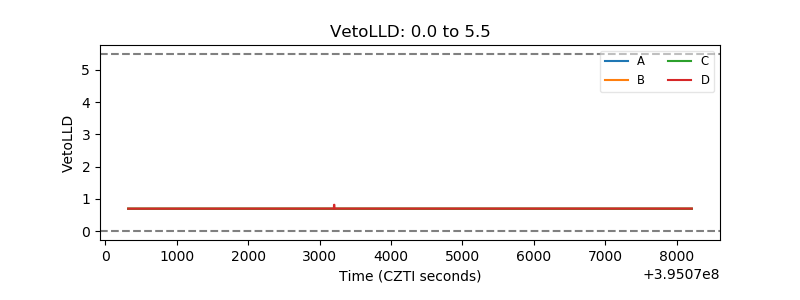 |
| Alpha Counter | 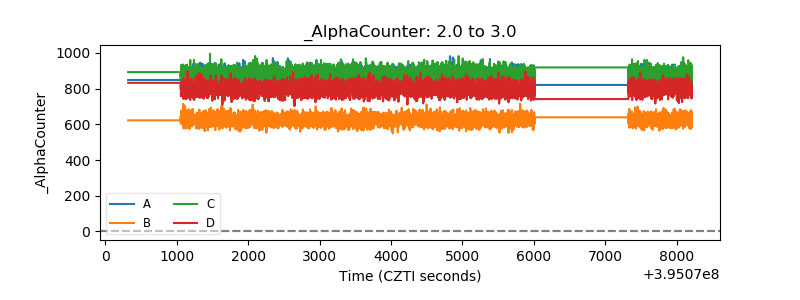 |
| _CPM_Rate | 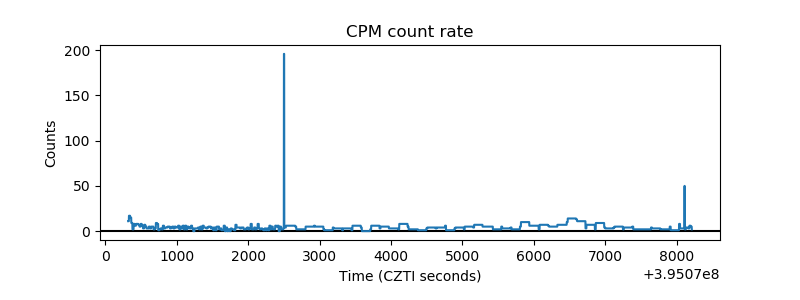 |
| CZT Counter | 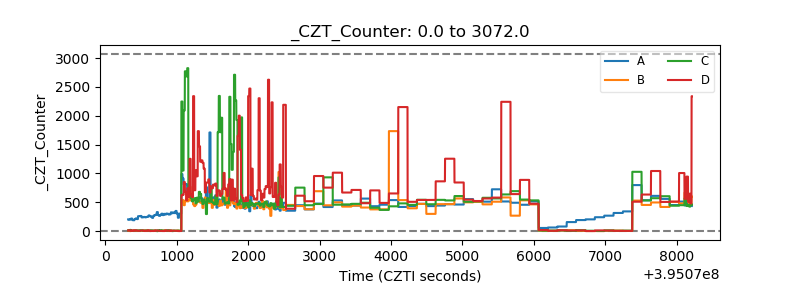 |
| +2.5 Volts monitor |  |
| +5 Volts monitor |  |
| _ROLL_ROT | 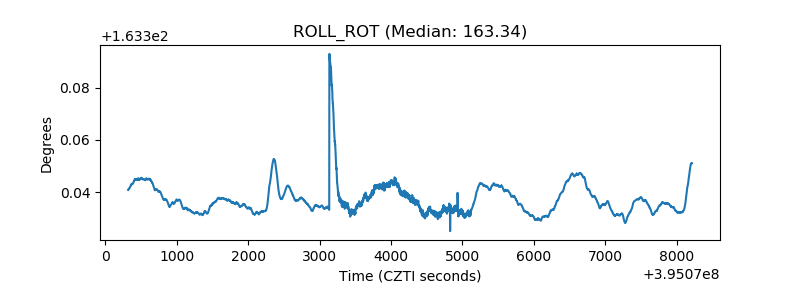 |
| _Roll_DEC | 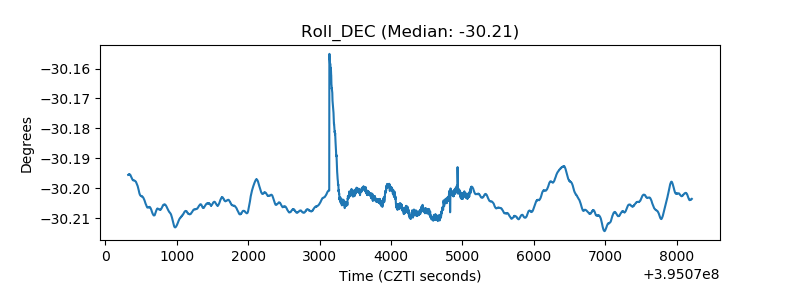 |
| _Roll_RA |  |
| Veto Counter | 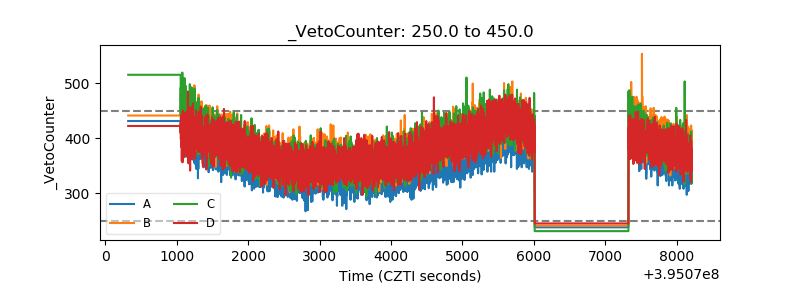 |