| Param | Original file | Final file |
|---|---|---|
| Filename | modeM0/AS1A11_049T05_9000005232_36660cztM0_level2.evt | modeM0/AS1A11_049T05_9000005232_36660cztM0_level2_quad_clean.evt |
| Size (bytes) | 1,286,219,520 | 184,080,960 |
| Size | 1.2 GB | 175.6 MB |
| Events in quadrant A | 7,739,034 | 1,160,589 |
| Events in quadrant B | 8,255,637 | 1,159,866 |
| Events in quadrant C | 8,790,306 | 1,120,006 |
| Events in quadrant D | 13,104,067 | 1,045,923 |
| Mode M9 | |||
|---|---|---|---|
| Quadrant | BADHDUFLAG | Total packets | Discarded packets |
| A | 0 | 53 | 0 |
| B | 0 | 53 | 0 |
| C | 0 | 53 | 0 |
| D | 0 | 54 | 0 |
| Mode M0 | |||
|---|---|---|---|
| Quadrant | BADHDUFLAG | Total packets | Discarded packets |
| A | 0 | 33078 | 5 |
| B | 0 | 34454 | 4 |
| C | 0 | 36045 | 4 |
| D | 0 | 49617 | 4 |
| Mode SS | |||
|---|---|---|---|
| Quadrant | BADHDUFLAG | Total packets | Discarded packets |
| A | 0 | 320 | 0 |
| B | 0 | 320 | 0 |
| C | 0 | 320 | 0 |
| D | 0 | 320 | 0 |
| Quadrant | Total seconds | Saturated seconds | Saturation percentage |
|---|---|---|---|
| A | 15779 | 52 | 0.329552% |
| B | 15779 | 139 | 0.880918% |
| C | 15779 | 288 | 1.825211% |
| D | 15779 | 996 | 6.312187% |
Noise dominated data is calculated using 1-second bins in cleaned event files. If a bin has >2000 counts, and if more than 50% of those come from <1% of pixels, then it is considered to be noise-dominated and hence unusable.
| Quadrant | # 1 sec bins | Bins with >0 counts | Bins with >2000 counts | High rate bins dominated by noise | Noise dominated (total time) | Noise dominated (detector-on time) | Marked lightcurve |
|---|---|---|---|---|---|---|---|
| A | 19898 | 15782 | 14 | 14 | 0.07% | 0.09% | 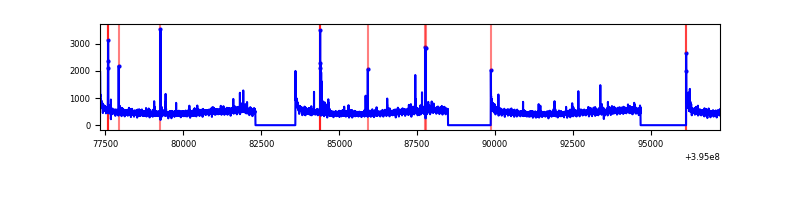 |
| B | 19898 | 15782 | 83 | 83 | 0.42% | 0.53% | 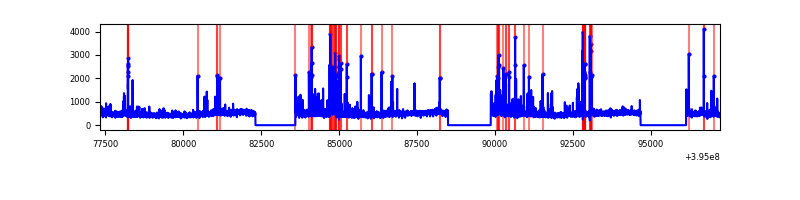 |
| C | 19898 | 15782 | 203 | 203 | 1.02% | 1.29% | 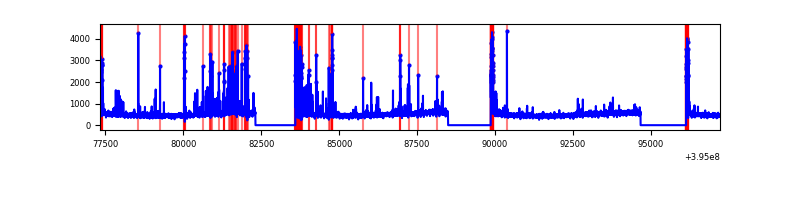 |
| D | 19898 | 15782 | 829 | 829 | 4.17% | 5.25% | 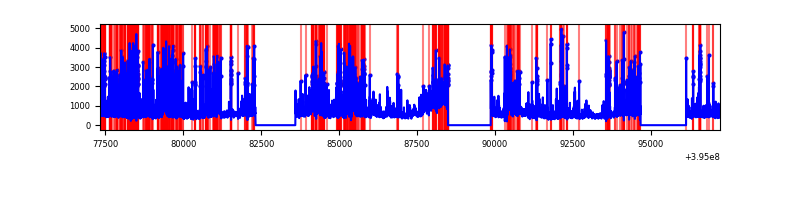 |
Top three noisy pixels from each quadrant. If the there are fewer than three noisy pixels in the level2.evt file, extra rows are filled as -1
| Pixel properties | Quadrant properties | ||||||
|---|---|---|---|---|---|---|---|
| Quadrant | DetID | PixID | Counts | Sigma | Mean | Median | Sigma |
| A | 10 | 83 | 522943 | 1413.03 | 1829 | 1793 | 368.8 |
| A | 9 | 143 | 91294 | 242.67 | 1829 | 1793 | 368.8 |
| A | 13 | 254 | 27113 | 68.65 | 1829 | 1793 | 368.8 |
| B | 5 | 255 | 563517 | 1598.14 | 1820 | 1771 | 351.5 |
| B | 0 | 221 | 123557 | 346.48 | 1820 | 1771 | 351.5 |
| B | 4 | 171 | 71678 | 198.88 | 1820 | 1771 | 351.5 |
| C | 15 | 214 | 713385 | 1739.0 | 1757 | 1763 | 409.2 |
| C | 0 | 10 | 615939 | 1500.87 | 1757 | 1763 | 409.2 |
| C | 14 | 254 | 577271 | 1406.37 | 1757 | 1763 | 409.2 |
| D | 12 | 235 | 1916032 | 4509.07 | 1730 | 1680 | 424.6 |
| D | 7 | 223 | 826166 | 1942.0 | 1730 | 1680 | 424.6 |
| D | 13 | 249 | 797546 | 1874.59 | 1730 | 1680 | 424.6 |
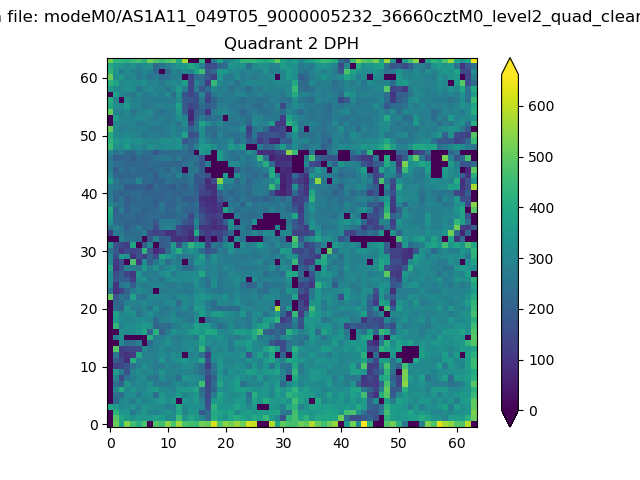
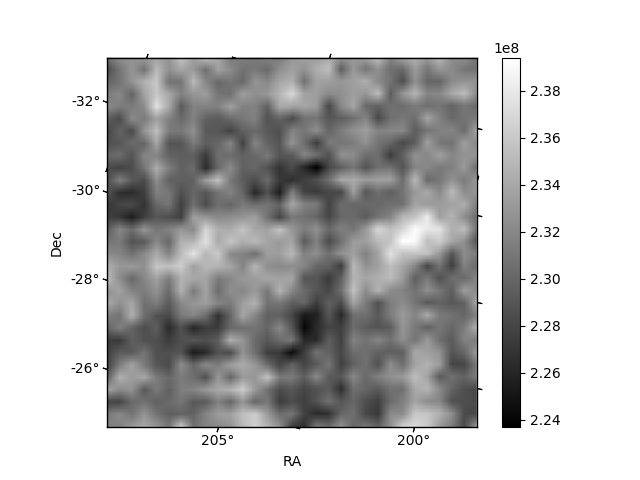
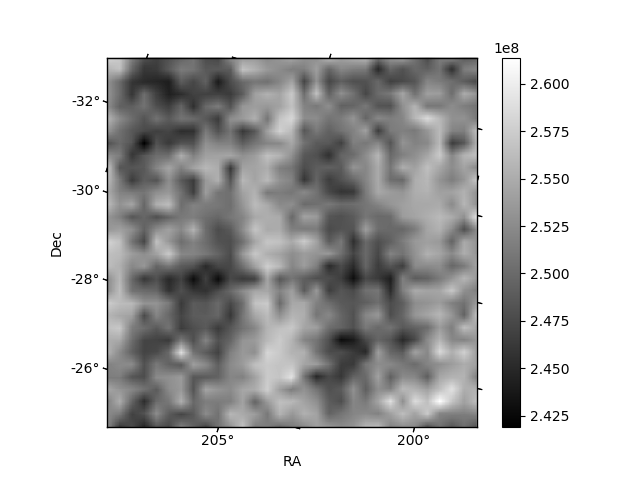
Histogram calculated using DETX and DETY for each event in the final _common_clean file
| Quadrant A |  |
 |
Quadrant B |
|---|---|---|---|
| Quadrant D | 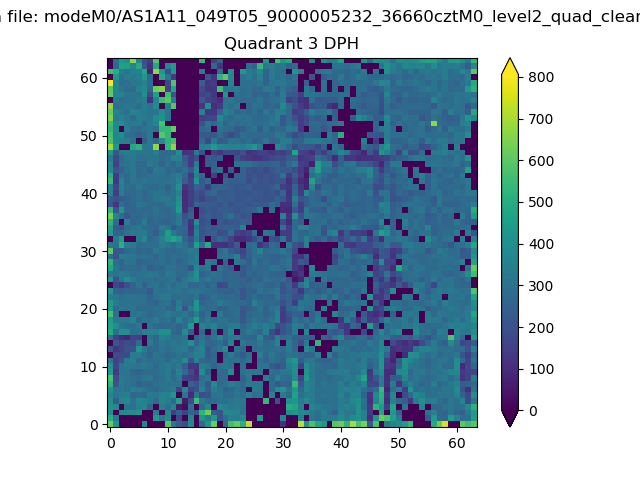 |
 |
Quadrant C |
| Plot type | Count rate plots | Images |
|---|---|---|
| Comparison with Poisson distribution Blue bars denote a histogram of data divided into 1 sec bins. Red curve is a Poisson curve with rate = median count rate of data. |
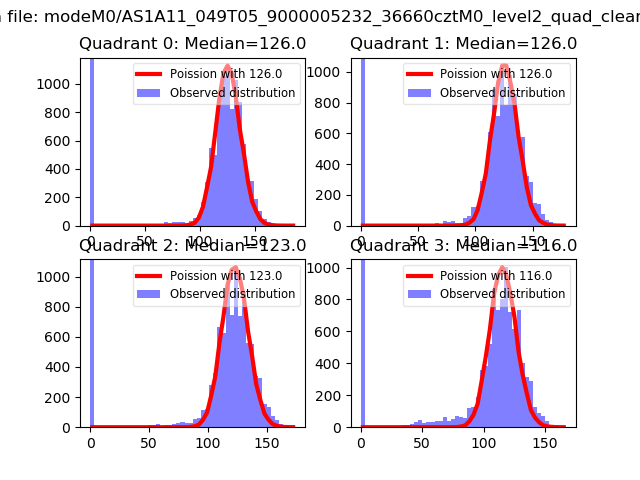 |
 |
| Quadrant-wise count rates Data is divided into 100 sec bins |
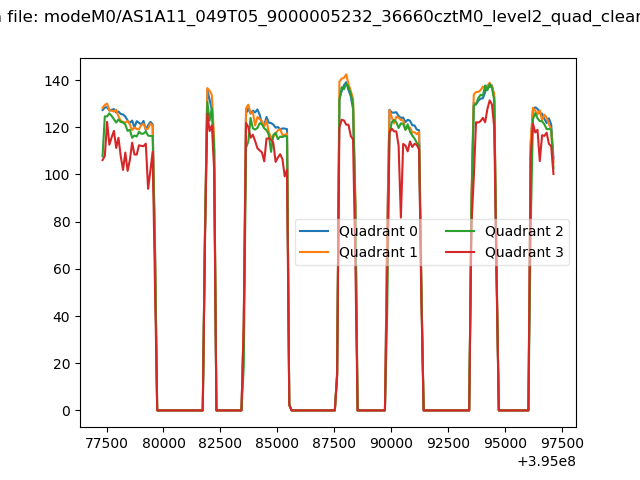 |
|
| Module-wise count rates for Quadrant A Data is divided into 100 sec bins |
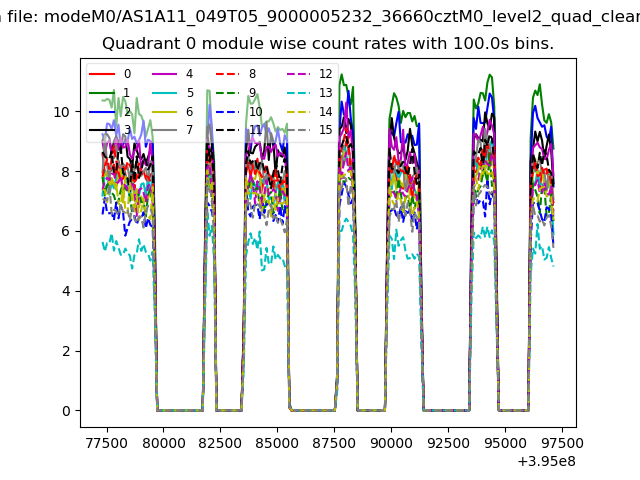 |
 |
| Module-wise count rates for Quadrant B Data is divided into 100 sec bins |
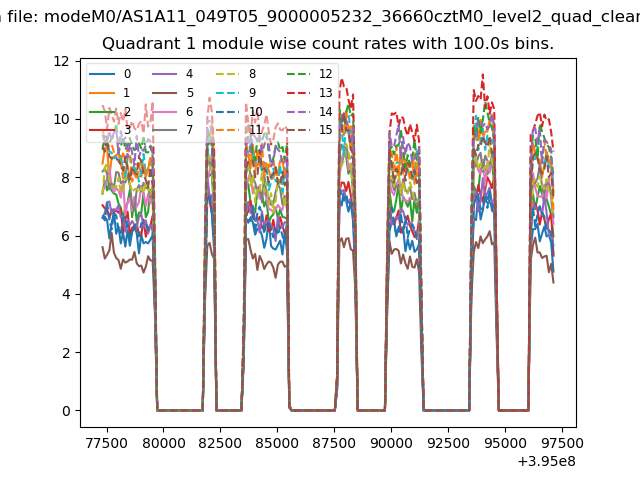 |
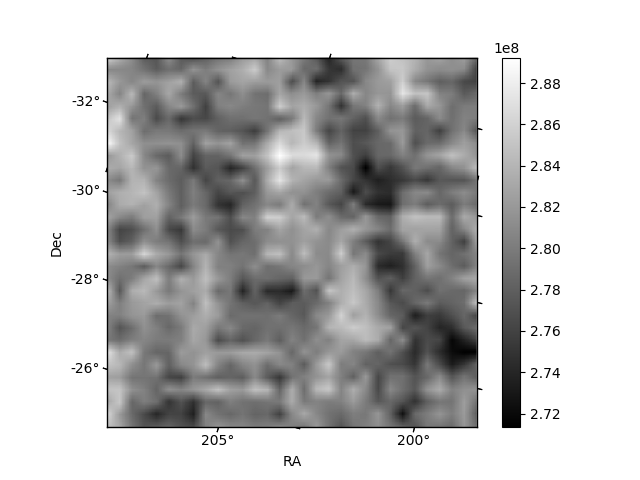 |
| Module-wise count rates for Quadrant C Data is divided into 100 sec bins |
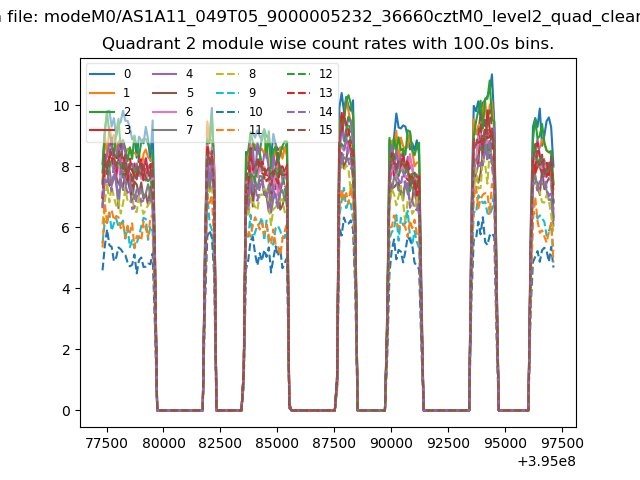 |
 |
| Module-wise count rates for Quadrant D Data is divided into 100 sec bins |
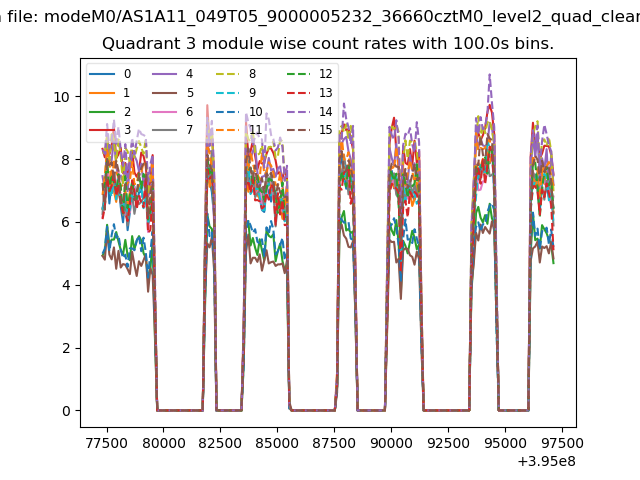 |
 |
| Parameter | Plot |
|---|---|
| CZT HV Monitor | 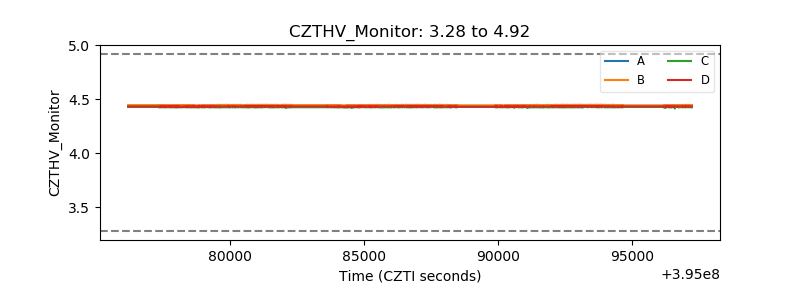 |
| D_VDD | 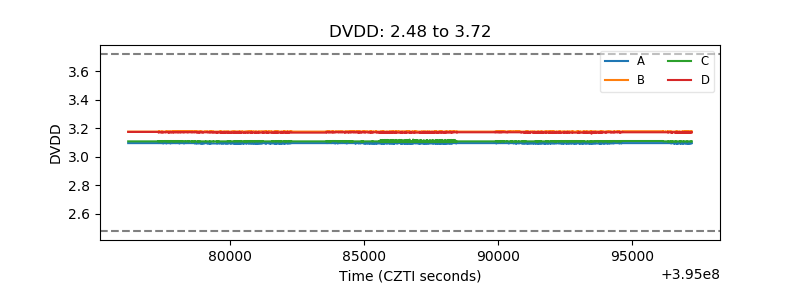 |
| Temperature 1 | 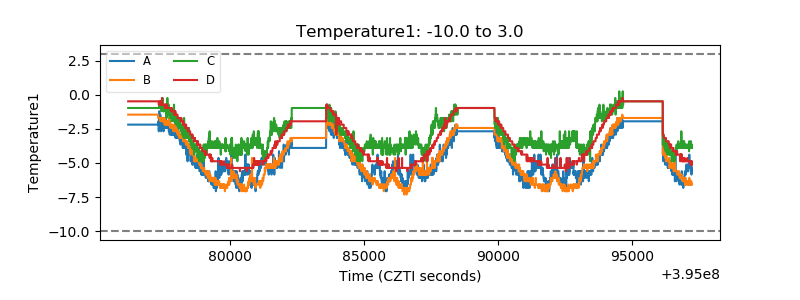 |
| Veto HV Monitor | 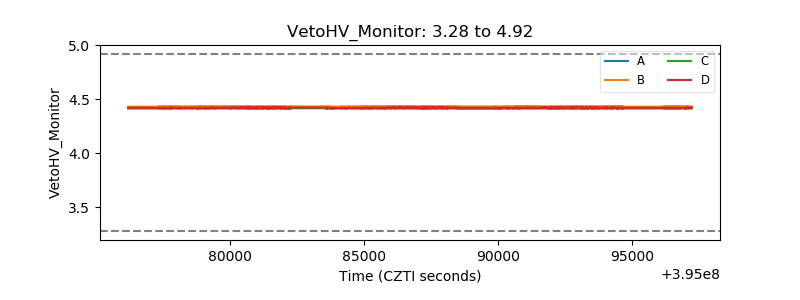 |
| Veto LLD | 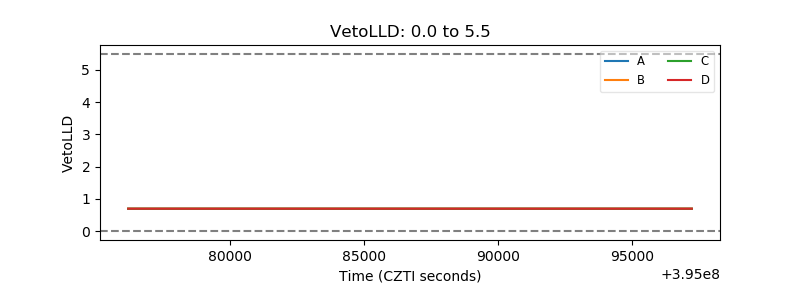 |
| Alpha Counter | 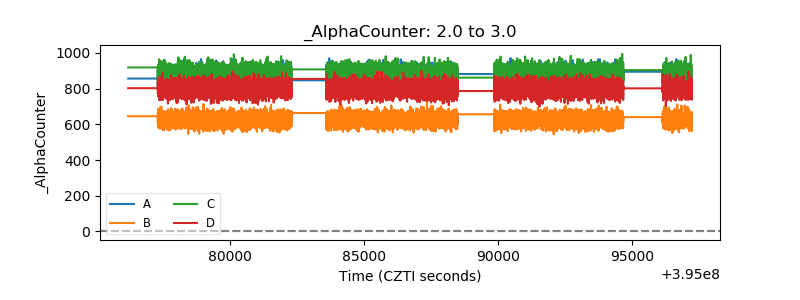 |
| _CPM_Rate | 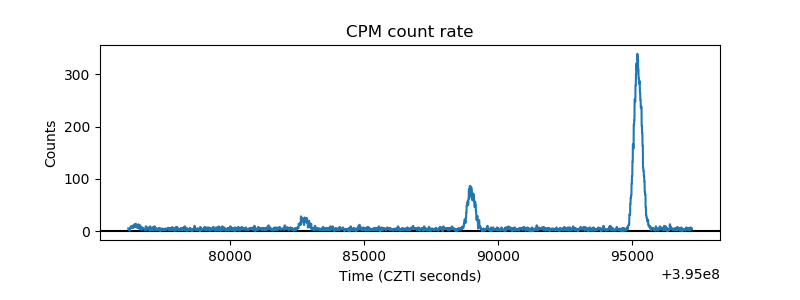 |
| CZT Counter | 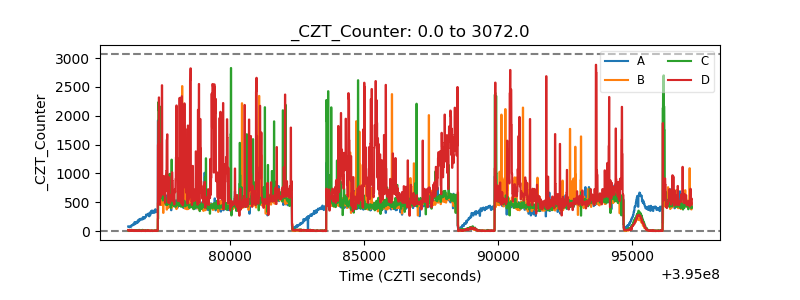 |
| +2.5 Volts monitor |  |
| +5 Volts monitor |  |
| _ROLL_ROT | 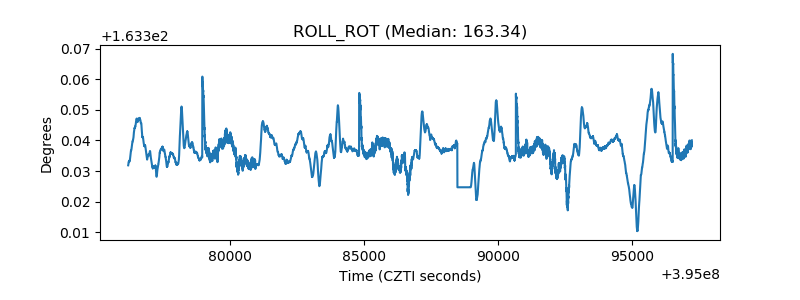 |
| _Roll_DEC | 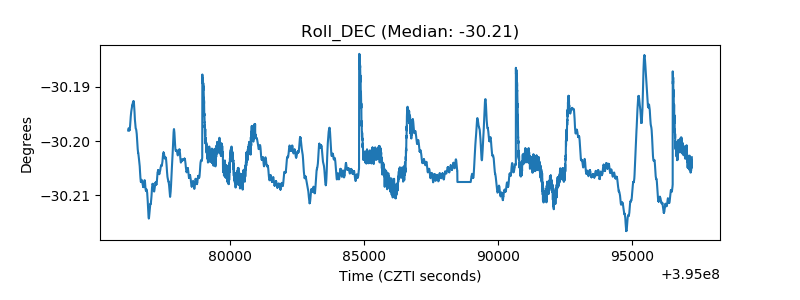 |
| _Roll_RA | 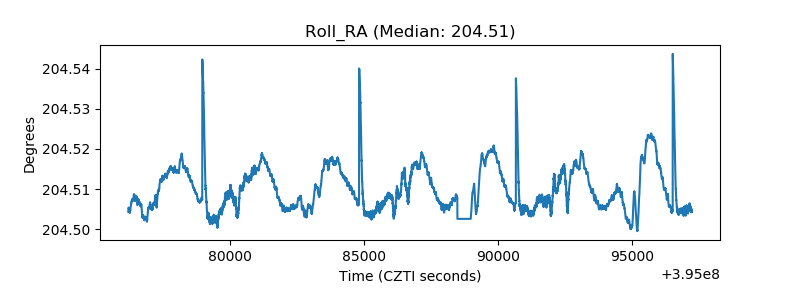 |
| Veto Counter | 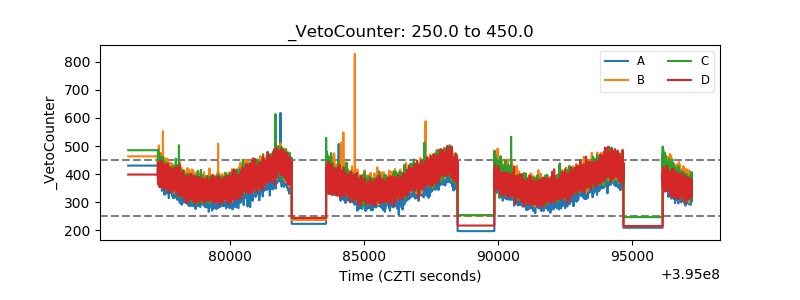 |