| Param | Original file | Final file |
|---|---|---|
| Filename | modeM0/AS1A11_049T05_9000005232_36661cztM0_level2.evt | modeM0/AS1A11_049T05_9000005232_36661cztM0_level2_quad_clean.evt |
| Size (bytes) | 438,906,240 | 65,318,400 |
| Size | 418.6 MB | 62.3 MB |
| Events in quadrant A | 2,753,903 | 408,123 |
| Events in quadrant B | 2,793,015 | 410,273 |
| Events in quadrant C | 3,048,577 | 392,176 |
| Events in quadrant D | 4,315,623 | 374,668 |
| Mode M9 | |||
|---|---|---|---|
| Quadrant | BADHDUFLAG | Total packets | Discarded packets |
| A | 0 | 27 | 0 |
| B | 0 | 27 | 0 |
| C | 0 | 27 | 0 |
| D | 0 | 28 | 0 |
| Mode M0 | |||
|---|---|---|---|
| Quadrant | BADHDUFLAG | Total packets | Discarded packets |
| A | 0 | 11704 | 3 |
| B | 0 | 11791 | 2 |
| C | 0 | 12403 | 2 |
| D | 0 | 16606 | 2 |
| Mode SS | |||
|---|---|---|---|
| Quadrant | BADHDUFLAG | Total packets | Discarded packets |
| A | 0 | 116 | 0 |
| B | 0 | 116 | 0 |
| C | 0 | 116 | 0 |
| D | 0 | 116 | 0 |
| Quadrant | Total seconds | Saturated seconds | Saturation percentage |
|---|---|---|---|
| A | 5601 | 9 | 0.160686% |
| B | 5601 | 31 | 0.553473% |
| C | 5601 | 116 | 2.071059% |
| D | 5601 | 506 | 9.034101% |
Noise dominated data is calculated using 1-second bins in cleaned event files. If a bin has >2000 counts, and if more than 50% of those come from <1% of pixels, then it is considered to be noise-dominated and hence unusable.
| Quadrant | # 1 sec bins | Bins with >0 counts | Bins with >2000 counts | High rate bins dominated by noise | Noise dominated (total time) | Noise dominated (detector-on time) | Marked lightcurve |
|---|---|---|---|---|---|---|---|
| A | 7184 | 5602 | 3 | 3 | 0.04% | 0.05% | 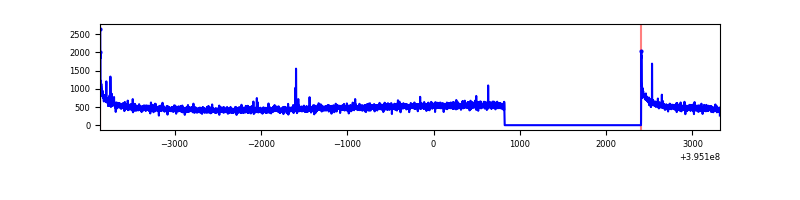 |
| B | 7184 | 5602 | 15 | 15 | 0.21% | 0.27% | 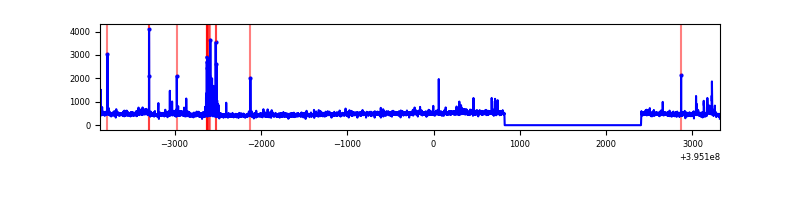 |
| C | 7184 | 5602 | 71 | 71 | 0.99% | 1.27% |  |
| D | 7184 | 5602 | 425 | 425 | 5.92% | 7.59% | 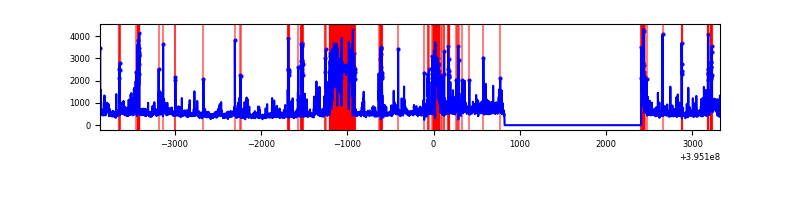 |
Top three noisy pixels from each quadrant. If the there are fewer than three noisy pixels in the level2.evt file, extra rows are filled as -1
| Pixel properties | Quadrant properties | ||||||
|---|---|---|---|---|---|---|---|
| Quadrant | DetID | PixID | Counts | Sigma | Mean | Median | Sigma |
| A | 10 | 83 | 212870 | 1602.05 | 651 | 639 | 132.5 |
| A | 13 | 254 | 9509 | 66.96 | 651 | 639 | 132.5 |
| A | 13 | 6 | 7950 | 55.19 | 651 | 639 | 132.5 |
| B | 5 | 255 | 135349 | 1076.89 | 646 | 631 | 125.1 |
| B | 0 | 221 | 35245 | 276.69 | 646 | 631 | 125.1 |
| B | 0 | 189 | 23184 | 180.28 | 646 | 631 | 125.1 |
| C | 0 | 10 | 334238 | 2285.42 | 621 | 626 | 146.0 |
| C | 15 | 214 | 254990 | 1742.53 | 621 | 626 | 146.0 |
| C | 14 | 254 | 27556 | 184.49 | 621 | 626 | 146.0 |
| D | 2 | 249 | 942839 | 6540.68 | 594 | 578 | 144.1 |
| D | 12 | 235 | 264275 | 1830.44 | 594 | 578 | 144.1 |
| D | 13 | 249 | 188022 | 1301.14 | 594 | 578 | 144.1 |
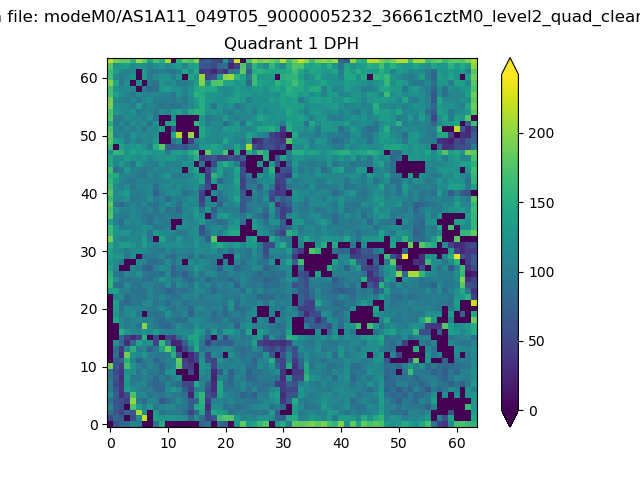
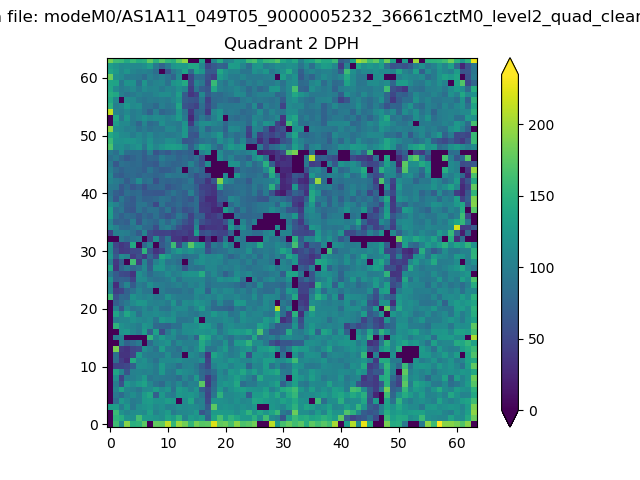
Histogram calculated using DETX and DETY for each event in the final _common_clean file
| Quadrant A | 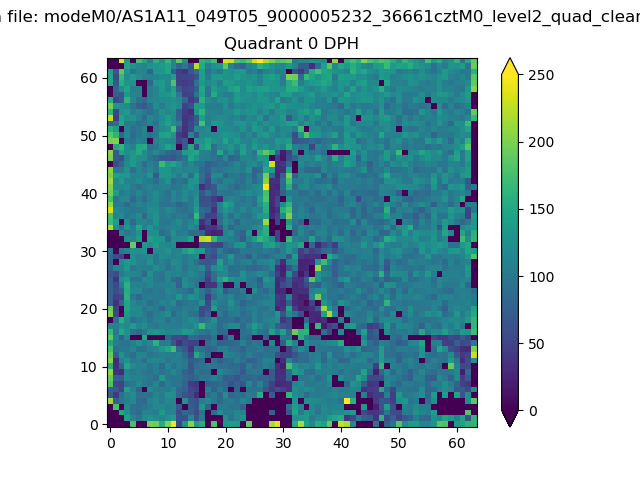 |
 |
Quadrant B |
|---|---|---|---|
| Quadrant D | 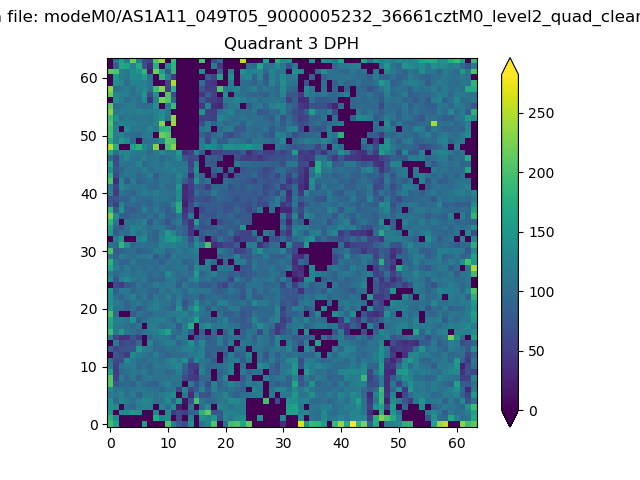 |
 |
Quadrant C |
| Plot type | Count rate plots | Images |
|---|---|---|
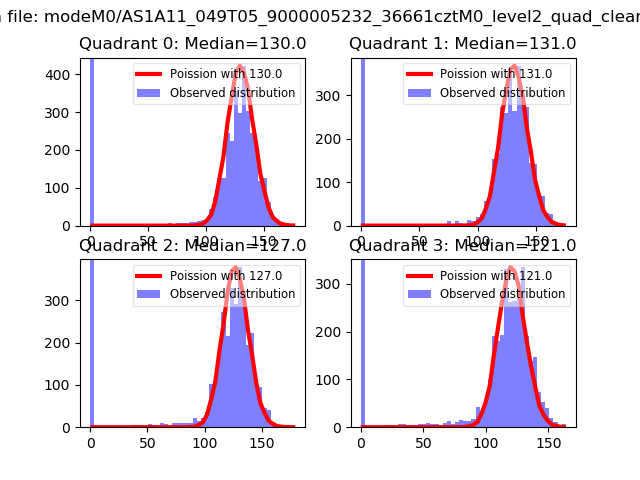
| Comparison with Poisson distribution Blue bars denote a histogram of data divided into 1 sec bins. Red curve is a Poisson curve with rate = median count rate of data. |
 |
 |
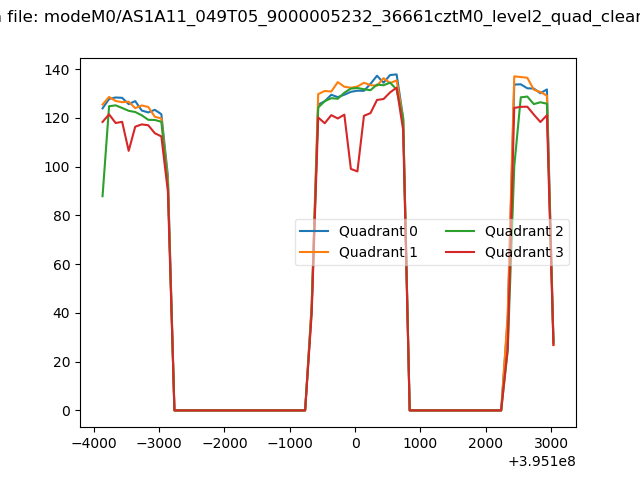
| Quadrant-wise count rates Data is divided into 100 sec bins |
 |
|
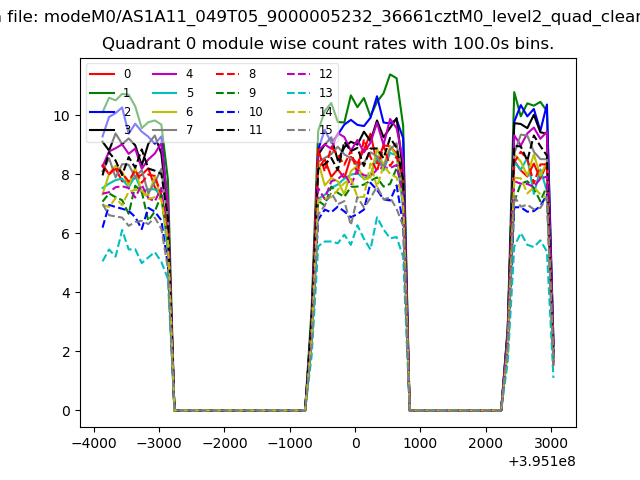
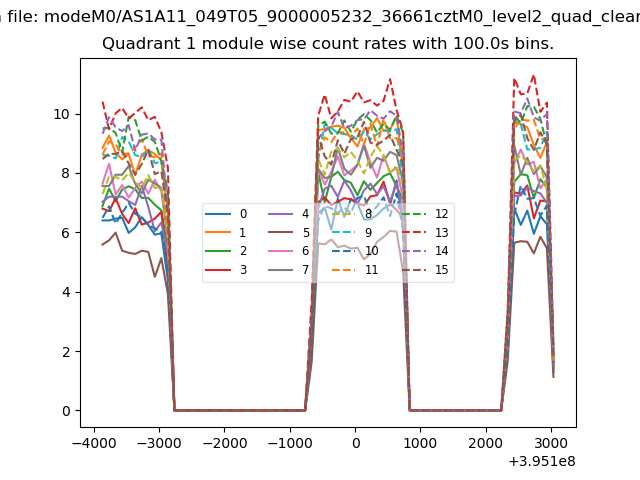
| Module-wise count rates for Quadrant A Data is divided into 100 sec bins |
 |
 |
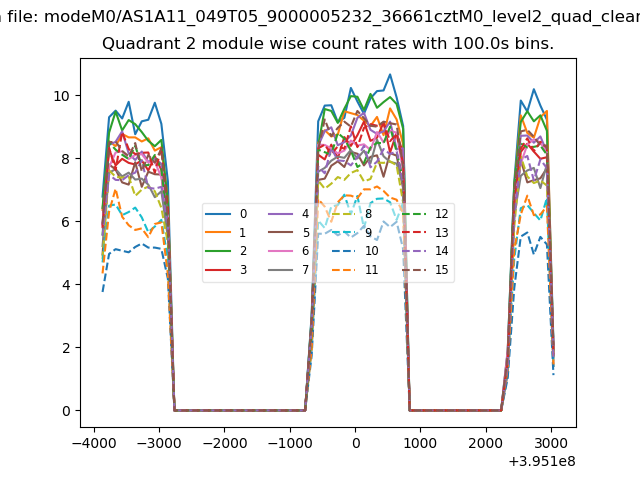
| Module-wise count rates for Quadrant B Data is divided into 100 sec bins |
 |
 |
| Module-wise count rates for Quadrant C Data is divided into 100 sec bins |
 |
 |
| Module-wise count rates for Quadrant D Data is divided into 100 sec bins |
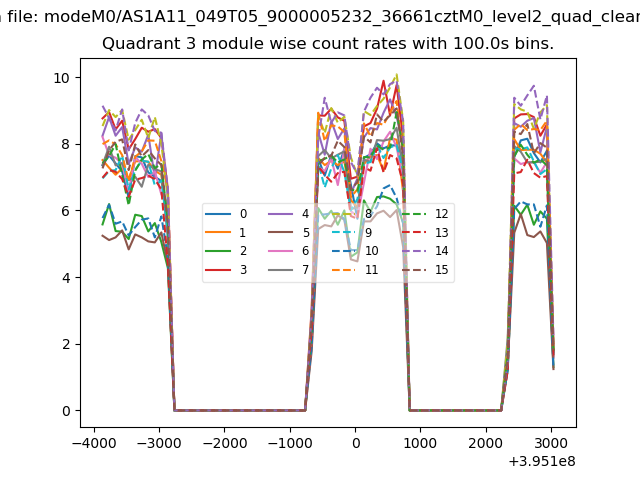 |
 |
| Parameter | Plot |
|---|---|
| CZT HV Monitor | 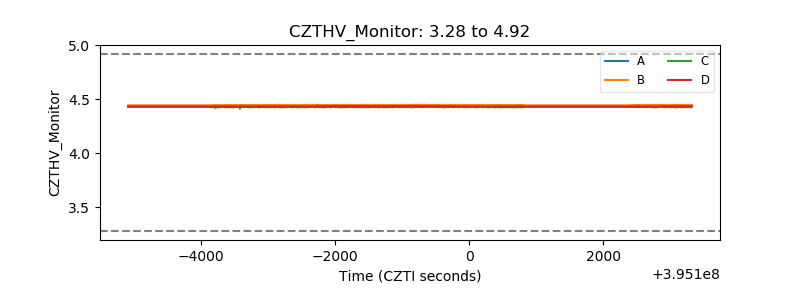 |
| D_VDD | 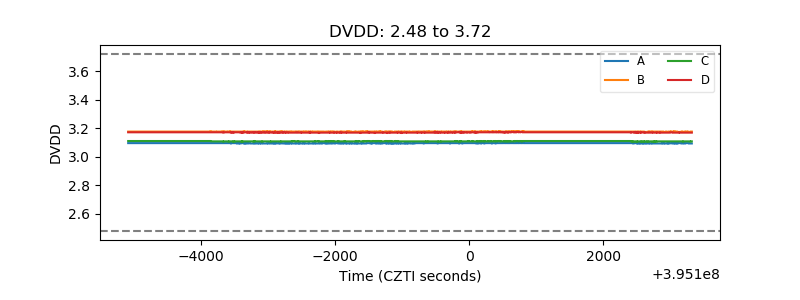 |
| Temperature 1 | 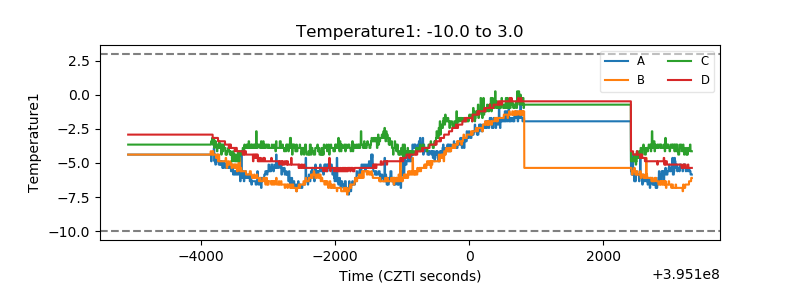 |
| Veto HV Monitor |  |
| Veto LLD | 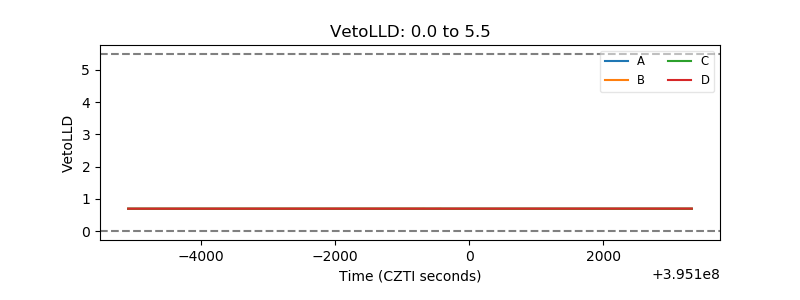 |
| Alpha Counter | 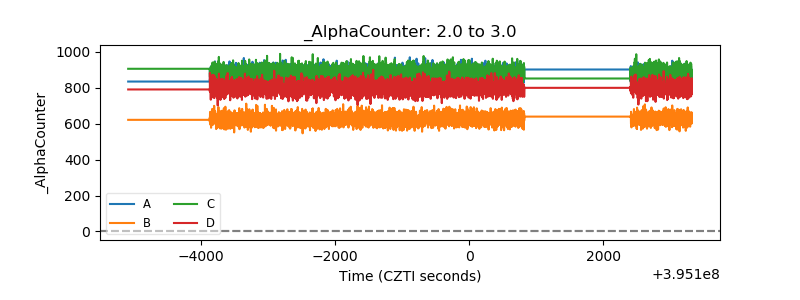 |
| _CPM_Rate | 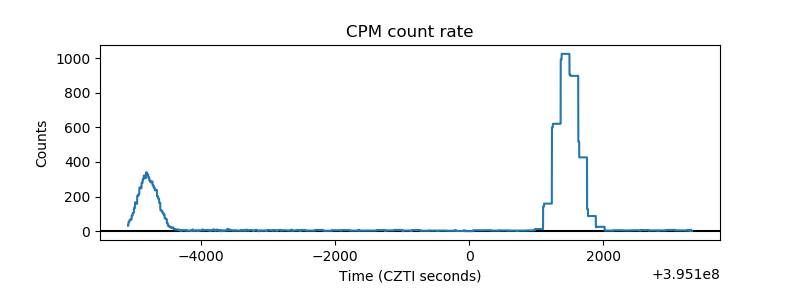 |
| CZT Counter | 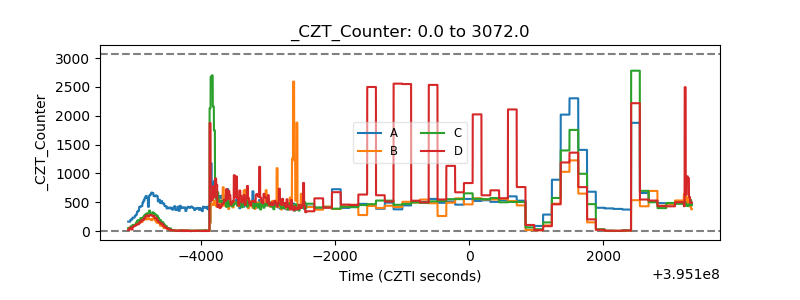 |
| +2.5 Volts monitor |  |
| +5 Volts monitor | 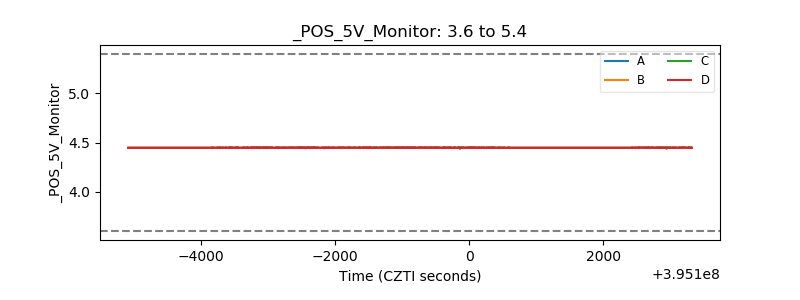 |
| _ROLL_ROT | 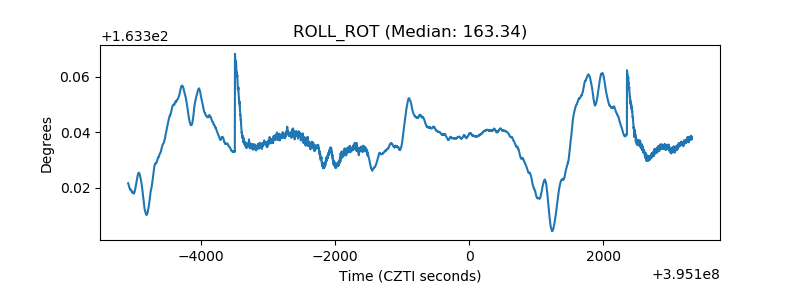 |
| _Roll_DEC | 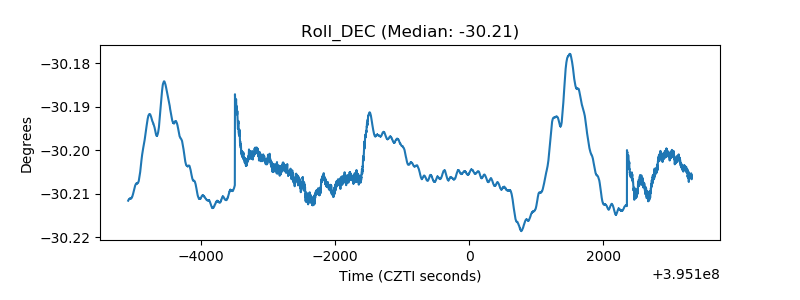 |
| _Roll_RA | 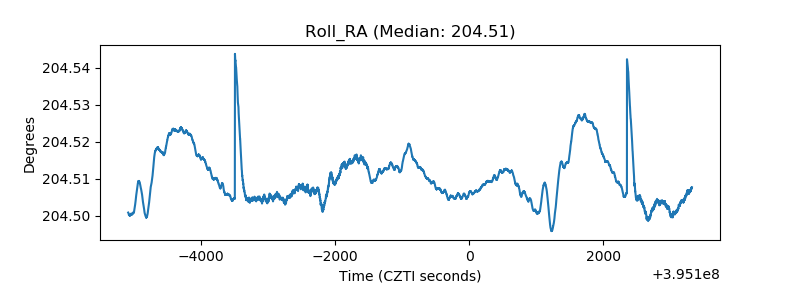 |
| Veto Counter | 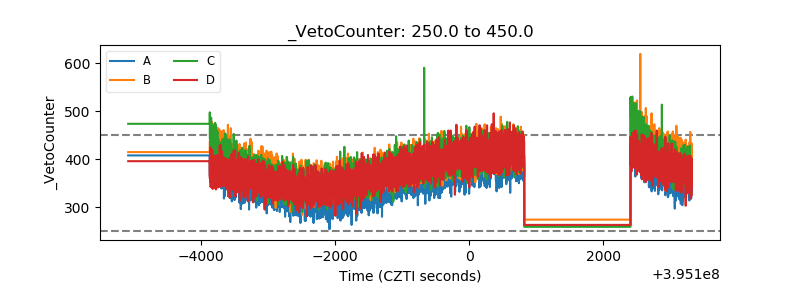 |