| Param | Original file | Final file |
|---|---|---|
| Filename | modeM0/AS1A11_049T05_9000005232_36663cztM0_level2.evt | modeM0/AS1A11_049T05_9000005232_36663cztM0_level2_quad_clean.evt |
| Size (bytes) | 426,810,240 | 56,168,640 |
| Size | 407.0 MB | 53.6 MB |
| Events in quadrant A | 2,719,499 | 340,554 |
| Events in quadrant B | 2,718,155 | 344,281 |
| Events in quadrant C | 3,018,464 | 329,130 |
| Events in quadrant D | 4,101,866 | 307,341 |
| Mode M9 | |||
|---|---|---|---|
| Quadrant | BADHDUFLAG | Total packets | Discarded packets |
| A | 0 | 32 | 0 |
| B | 0 | 32 | 0 |
| C | 0 | 32 | 0 |
| D | 0 | 32 | 0 |
| Mode M0 | |||
|---|---|---|---|
| Quadrant | BADHDUFLAG | Total packets | Discarded packets |
| A | 0 | 11416 | 3 |
| B | 0 | 11411 | 2 |
| C | 0 | 12101 | 2 |
| D | 0 | 15738 | 2 |
| Mode SS | |||
|---|---|---|---|
| Quadrant | BADHDUFLAG | Total packets | Discarded packets |
| A | 0 | 114 | 0 |
| B | 0 | 114 | 0 |
| C | 0 | 114 | 0 |
| D | 0 | 114 | 0 |
| Quadrant | Total seconds | Saturated seconds | Saturation percentage |
|---|---|---|---|
| A | 5408 | 7 | 0.129438% |
| B | 5408 | 42 | 0.776627% |
| C | 5408 | 109 | 2.015533% |
| D | 5408 | 374 | 6.915680% |
Noise dominated data is calculated using 1-second bins in cleaned event files. If a bin has >2000 counts, and if more than 50% of those come from <1% of pixels, then it is considered to be noise-dominated and hence unusable.
| Quadrant | # 1 sec bins | Bins with >0 counts | Bins with >2000 counts | High rate bins dominated by noise | Noise dominated (total time) | Noise dominated (detector-on time) | Marked lightcurve |
|---|---|---|---|---|---|---|---|
| A | 8723 | 5410 | 4 | 4 | 0.05% | 0.07% | 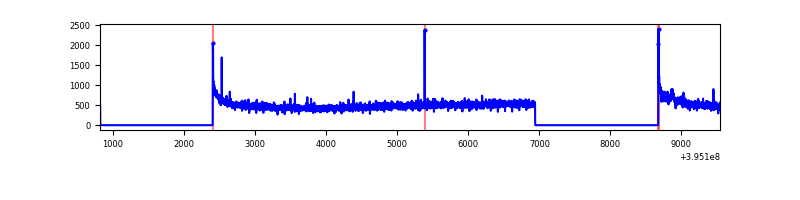 |
| B | 8723 | 5410 | 19 | 19 | 0.22% | 0.35% | 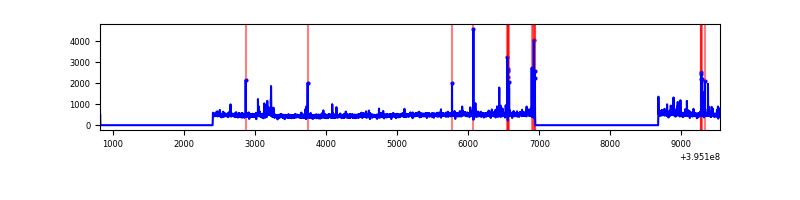 |
| C | 8723 | 5410 | 70 | 70 | 0.80% | 1.29% | 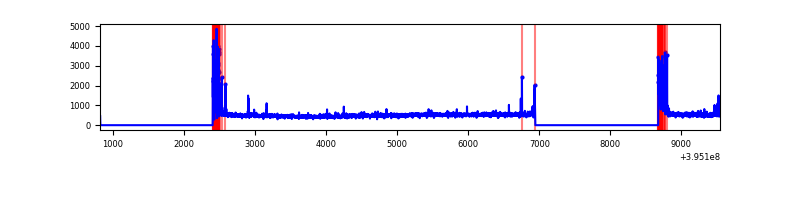 |
| D | 8723 | 5410 | 280 | 280 | 3.21% | 5.18% | 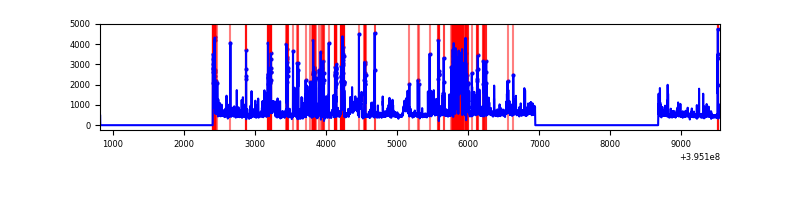 |
Top three noisy pixels from each quadrant. If the there are fewer than three noisy pixels in the level2.evt file, extra rows are filled as -1
| Pixel properties | Quadrant properties | ||||||
|---|---|---|---|---|---|---|---|
| Quadrant | DetID | PixID | Counts | Sigma | Mean | Median | Sigma |
| A | 10 | 83 | 204312 | 1579.37 | 638 | 626 | 129.0 |
| A | 15 | 223 | 26206 | 198.35 | 638 | 626 | 129.0 |
| A | 13 | 6 | 10232 | 74.48 | 638 | 626 | 129.0 |
| B | 5 | 255 | 123057 | 1015.47 | 633 | 617 | 120.6 |
| B | 0 | 221 | 44994 | 368.05 | 633 | 617 | 120.6 |
| B | 8 | 128 | 24857 | 201.04 | 633 | 617 | 120.6 |
| C | 0 | 10 | 352639 | 2473.94 | 610 | 613 | 142.3 |
| C | 15 | 214 | 246995 | 1731.5 | 610 | 613 | 142.3 |
| C | 14 | 254 | 32415 | 223.5 | 610 | 613 | 142.3 |
| D | 4 | 239 | 505419 | 3487.91 | 594 | 578 | 144.7 |
| D | 13 | 249 | 389673 | 2688.23 | 594 | 578 | 144.7 |
| D | 2 | 249 | 205367 | 1414.87 | 594 | 578 | 144.7 |
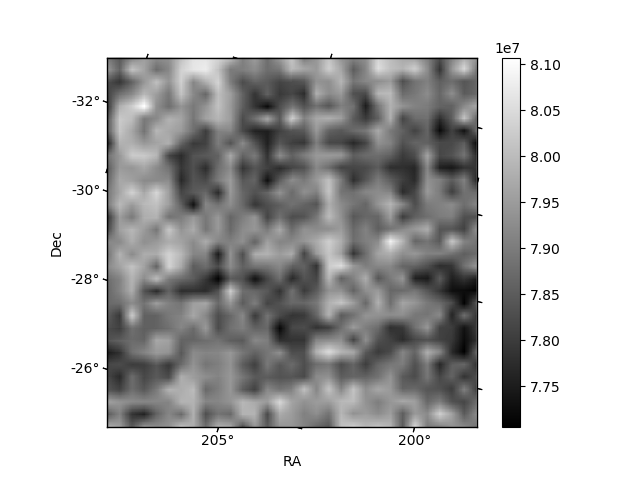
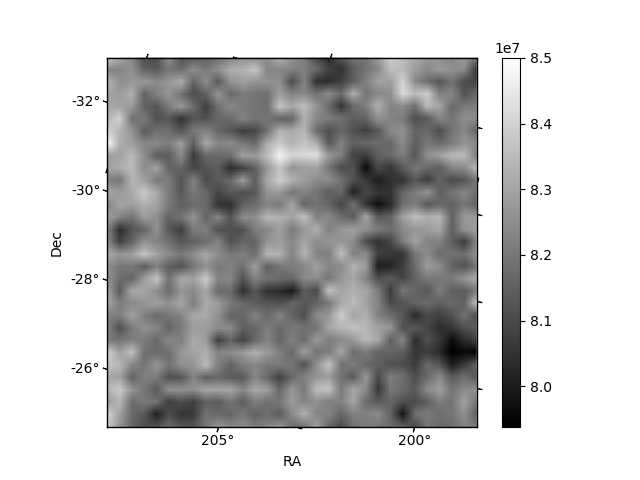
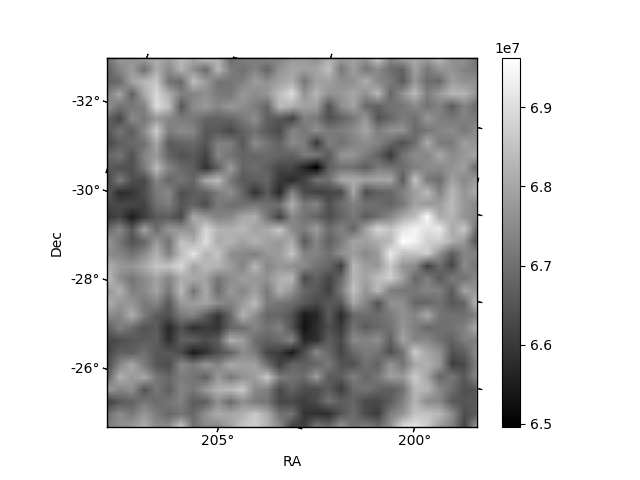
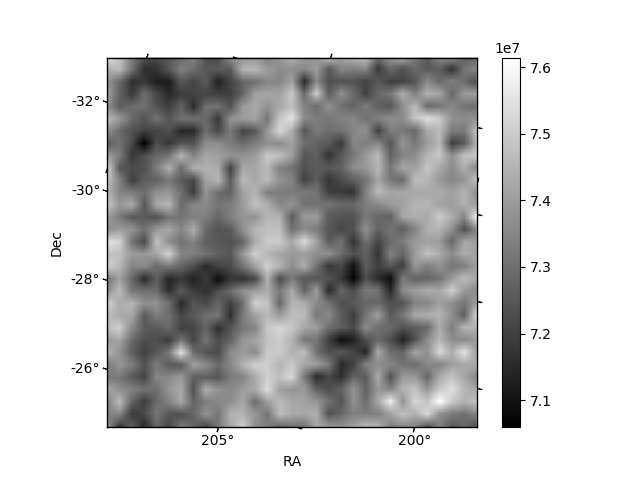
Histogram calculated using DETX and DETY for each event in the final _common_clean file
| Quadrant A | 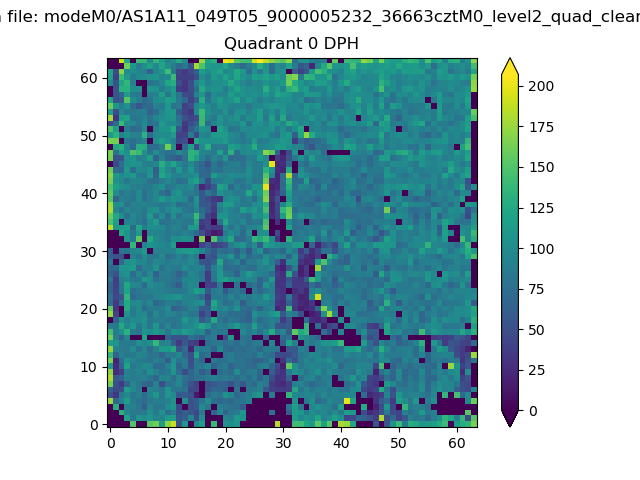 |
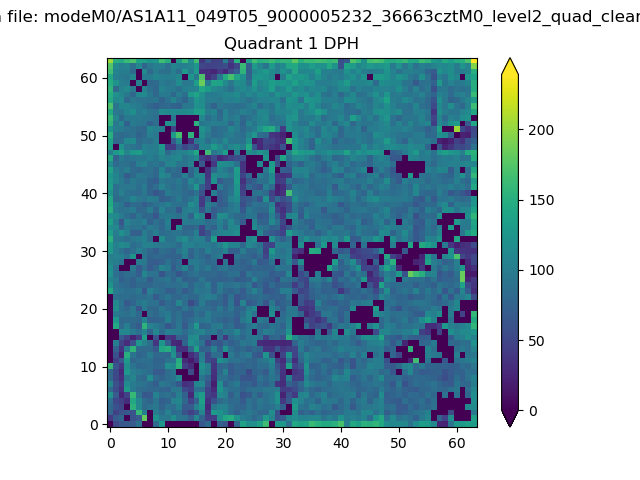 |
Quadrant B |
|---|---|---|---|
| Quadrant D |  |
 |
Quadrant C |
| Plot type | Count rate plots | Images |
|---|---|---|
| Comparison with Poisson distribution Blue bars denote a histogram of data divided into 1 sec bins. Red curve is a Poisson curve with rate = median count rate of data. |
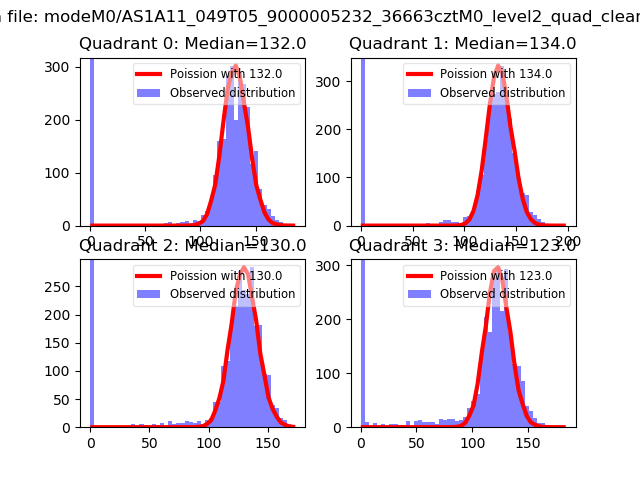 |
 |
| Quadrant-wise count rates Data is divided into 100 sec bins |
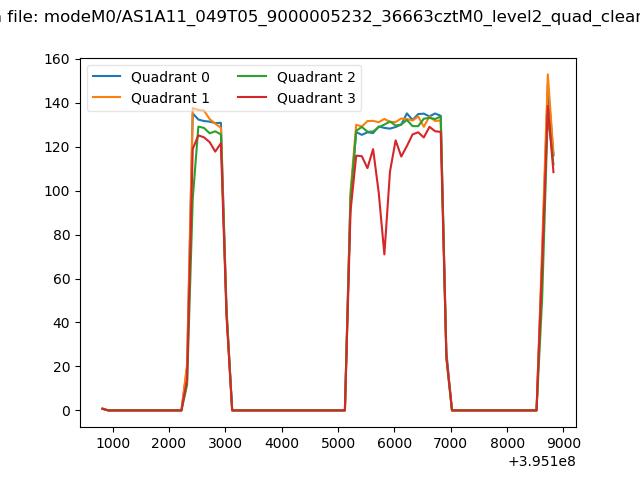 |
|
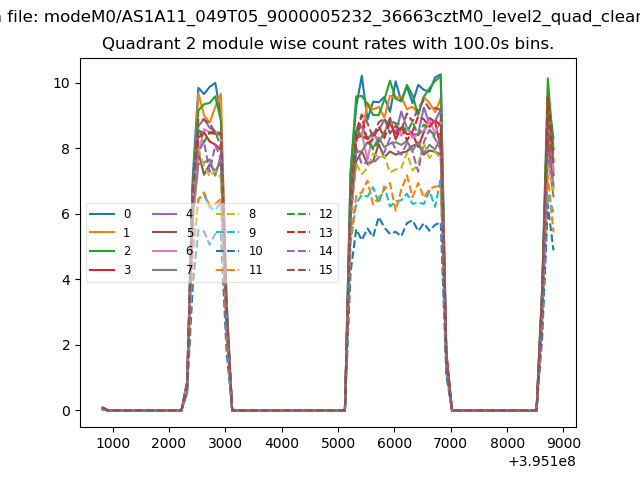
| Module-wise count rates for Quadrant A Data is divided into 100 sec bins |
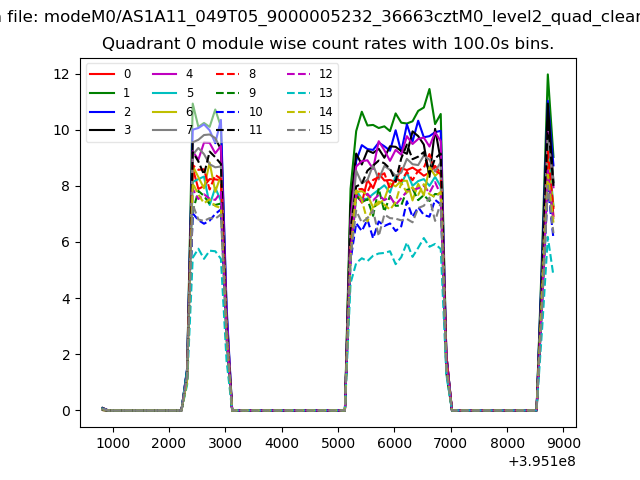 |
 |
| Module-wise count rates for Quadrant B Data is divided into 100 sec bins |
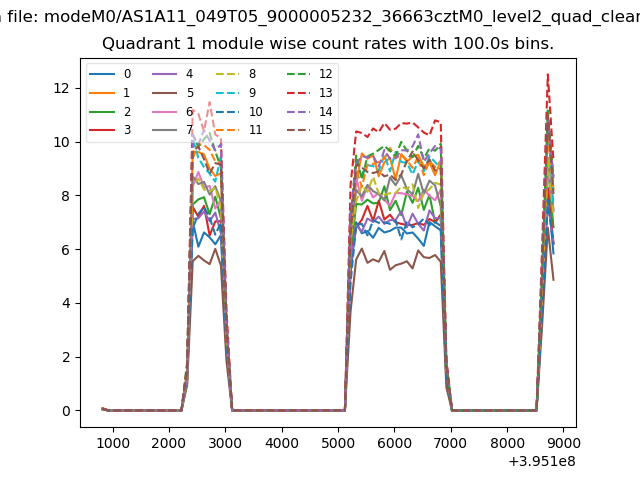 |
 |
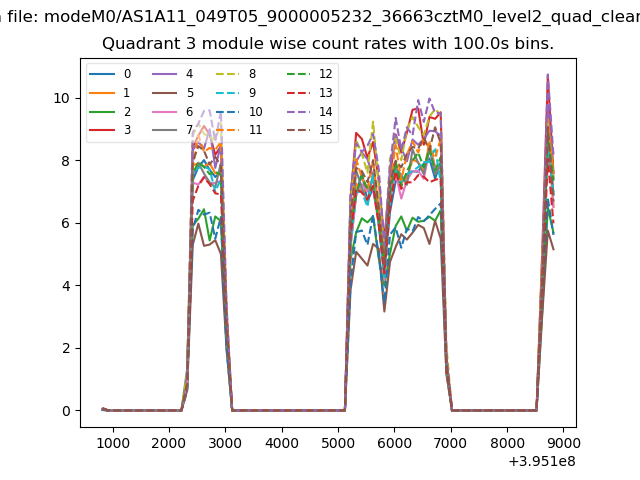
| Module-wise count rates for Quadrant C Data is divided into 100 sec bins |
 |
 |
| Module-wise count rates for Quadrant D Data is divided into 100 sec bins |
 |
 |
| Parameter | Plot |
|---|---|
| CZT HV Monitor | 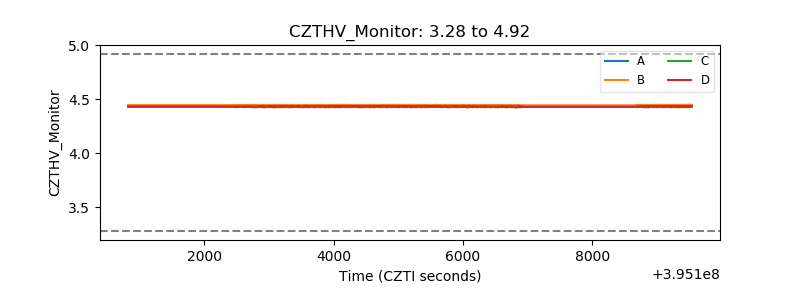 |
| D_VDD | 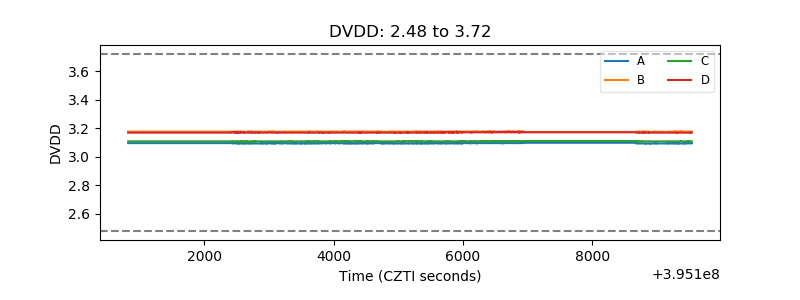 |
| Temperature 1 | 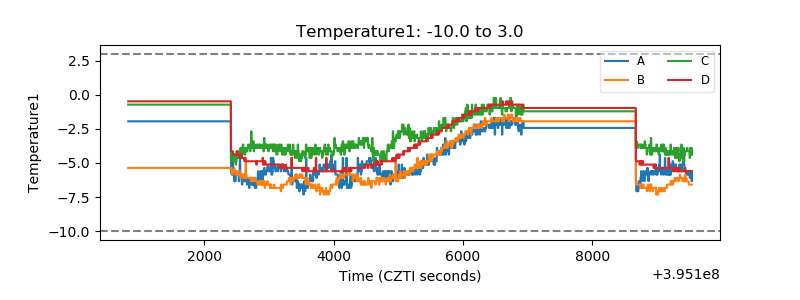 |
| Veto HV Monitor | 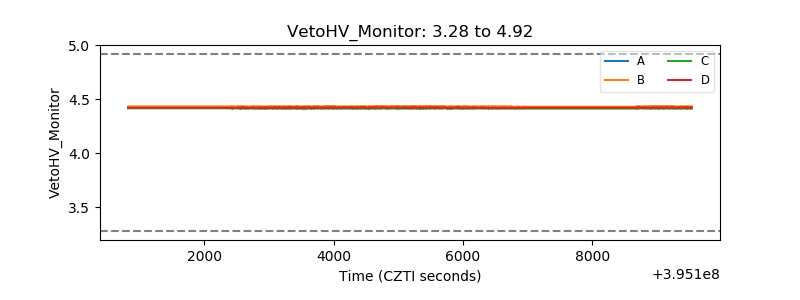 |
| Veto LLD | 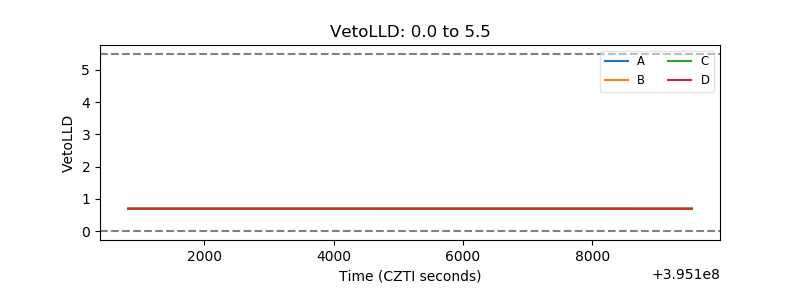 |
| Alpha Counter | 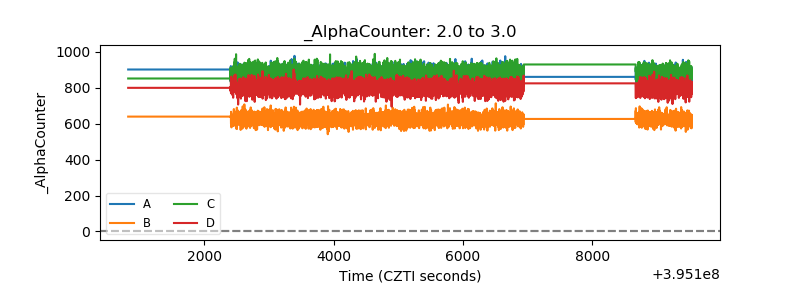 |
| _CPM_Rate | 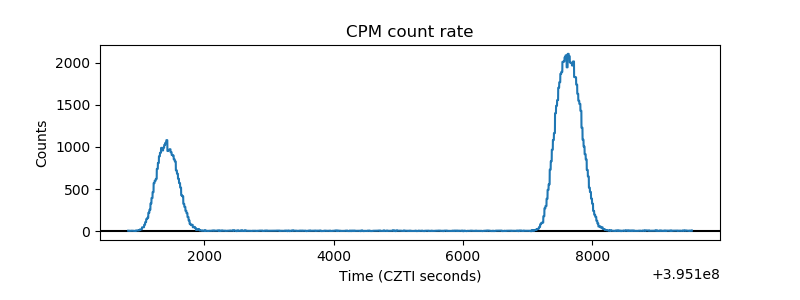 |
| CZT Counter |  |
| +2.5 Volts monitor |  |
| +5 Volts monitor |  |
| _ROLL_ROT | 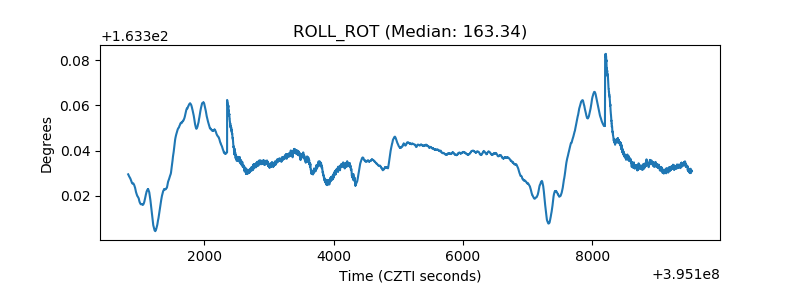 |
| _Roll_DEC | 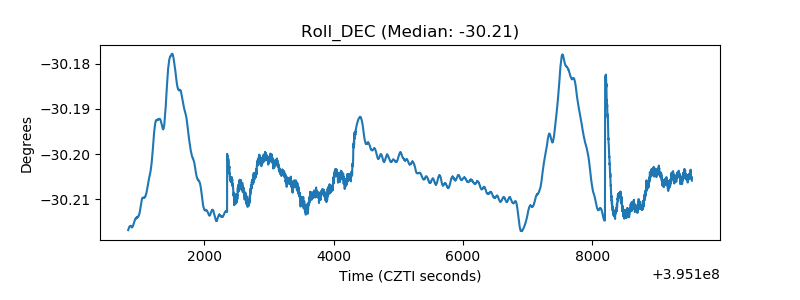 |
| _Roll_RA | 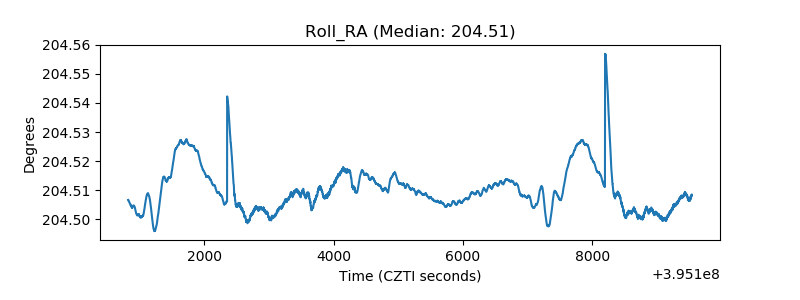 |
| Veto Counter | 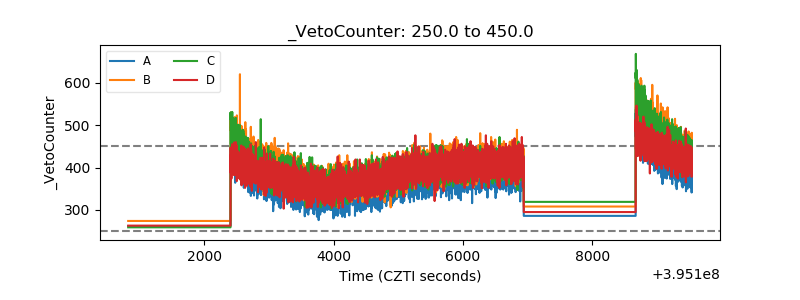 |