| Param | Original file | Final file |
|---|---|---|
| Filename | modeM0/AS1A11_049T05_9000005232_36665cztM0_level2.evt | modeM0/AS1A11_049T05_9000005232_36665cztM0_level2_quad_clean.evt |
| Size (bytes) | 471,168,000 | 53,449,920 |
| Size | 449.3 MB | 51.0 MB |
| Events in quadrant A | 2,856,091 | 323,581 |
| Events in quadrant B | 2,878,071 | 327,751 |
| Events in quadrant C | 3,335,128 | 317,878 |
| Events in quadrant D | 4,843,076 | 280,178 |
| Mode M9 | |||
|---|---|---|---|
| Quadrant | BADHDUFLAG | Total packets | Discarded packets |
| A | 0 | 27 | 0 |
| B | 0 | 27 | 0 |
| C | 0 | 27 | 0 |
| D | 0 | 28 | 0 |
| Mode M0 | |||
|---|---|---|---|
| Quadrant | BADHDUFLAG | Total packets | Discarded packets |
| A | 0 | 11441 | 3 |
| B | 0 | 11544 | 2 |
| C | 0 | 12875 | 2 |
| D | 0 | 17817 | 2 |
| Mode SS | |||
|---|---|---|---|
| Quadrant | BADHDUFLAG | Total packets | Discarded packets |
| A | 0 | 108 | 0 |
| B | 0 | 108 | 0 |
| C | 0 | 108 | 0 |
| D | 0 | 108 | 0 |
| Quadrant | Total seconds | Saturated seconds | Saturation percentage |
|---|---|---|---|
| A | 5259 | 14 | 0.266210% |
| B | 5259 | 37 | 0.703556% |
| C | 5259 | 146 | 2.776193% |
| D | 5259 | 550 | 10.458262% |
Noise dominated data is calculated using 1-second bins in cleaned event files. If a bin has >2000 counts, and if more than 50% of those come from <1% of pixels, then it is considered to be noise-dominated and hence unusable.
| Quadrant | # 1 sec bins | Bins with >0 counts | Bins with >2000 counts | High rate bins dominated by noise | Noise dominated (total time) | Noise dominated (detector-on time) | Marked lightcurve |
|---|---|---|---|---|---|---|---|
| A | 7231 | 5260 | 2 | 2 | 0.03% | 0.04% | 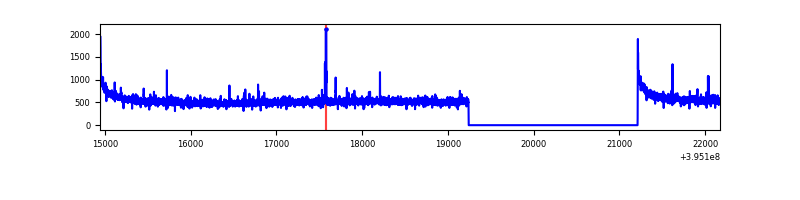 |
| B | 7231 | 5260 | 16 | 16 | 0.22% | 0.30% | 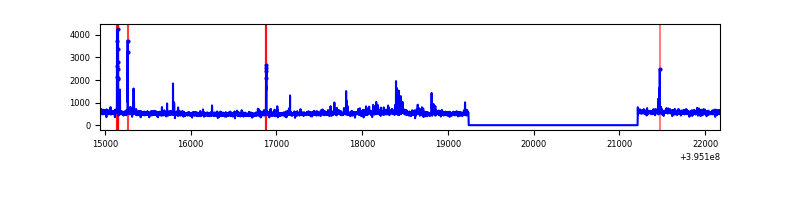 |
| C | 7231 | 5260 | 109 | 109 | 1.51% | 2.07% | 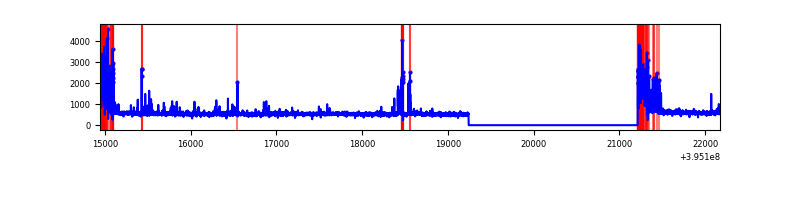 |
| D | 7231 | 5260 | 480 | 480 | 6.64% | 9.13% | 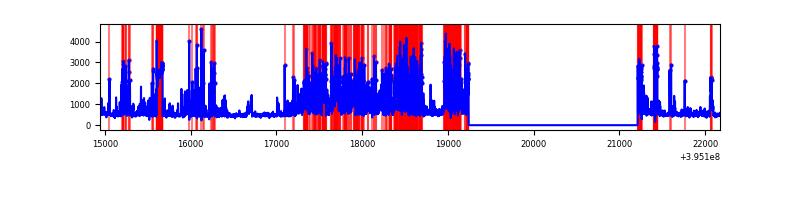 |
Top three noisy pixels from each quadrant. If the there are fewer than three noisy pixels in the level2.evt file, extra rows are filled as -1
| Pixel properties | Quadrant properties | ||||||
|---|---|---|---|---|---|---|---|
| Quadrant | DetID | PixID | Counts | Sigma | Mean | Median | Sigma |
| A | 10 | 83 | 202820 | 1491.52 | 676 | 665 | 135.5 |
| A | 9 | 143 | 27803 | 200.23 | 676 | 665 | 135.5 |
| A | 13 | 254 | 9278 | 63.55 | 676 | 665 | 135.5 |
| B | 5 | 255 | 95929 | 760.72 | 673 | 656 | 125.2 |
| B | 0 | 189 | 48037 | 378.32 | 673 | 656 | 125.2 |
| B | 0 | 221 | 22389 | 173.53 | 673 | 656 | 125.2 |
| C | 0 | 10 | 484145 | 3266.65 | 648 | 654 | 148.0 |
| C | 15 | 214 | 239499 | 1613.73 | 648 | 654 | 148.0 |
| C | 14 | 254 | 74248 | 497.23 | 648 | 654 | 148.0 |
| D | 12 | 235 | 1063830 | 7020.88 | 626 | 609 | 151.4 |
| D | 2 | 250 | 372258 | 2454.15 | 626 | 609 | 151.4 |
| D | 13 | 249 | 267245 | 1760.71 | 626 | 609 | 151.4 |
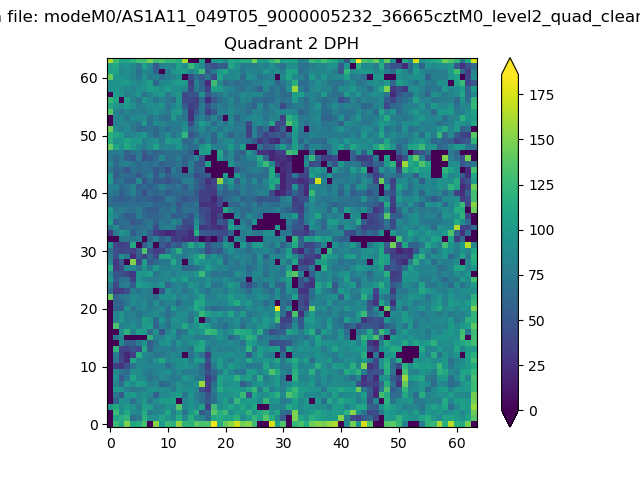
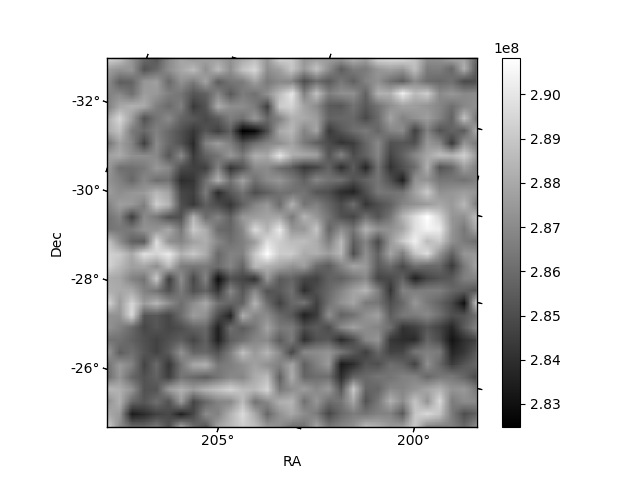
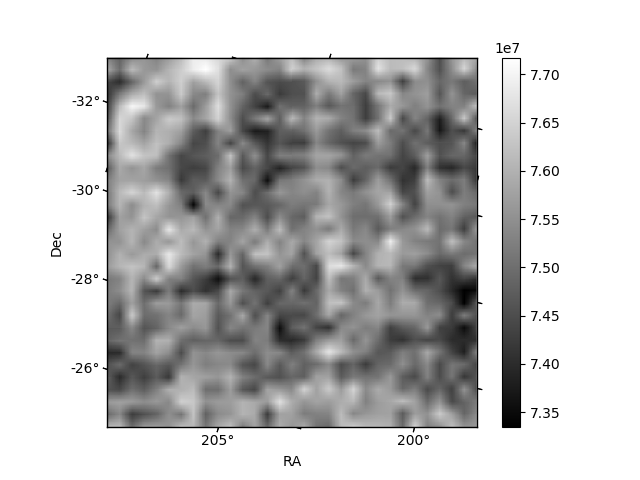
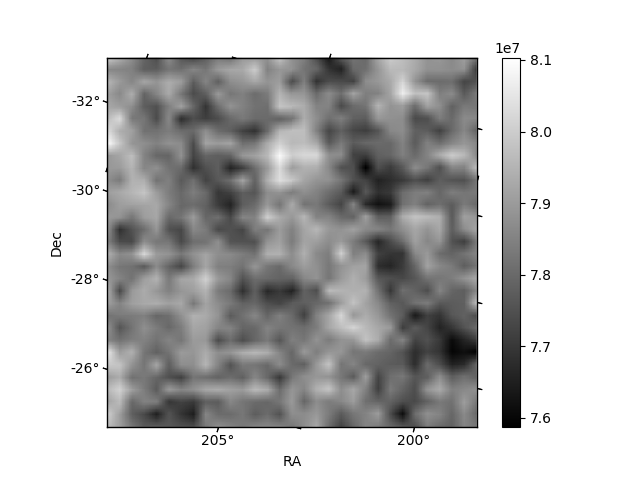
Histogram calculated using DETX and DETY for each event in the final _common_clean file
| Quadrant A | 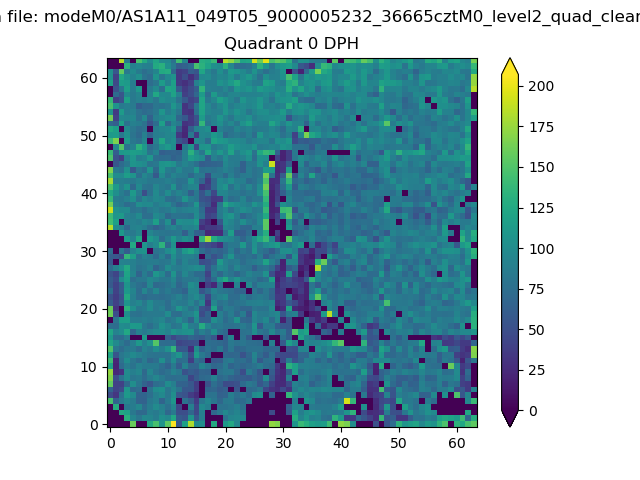 |
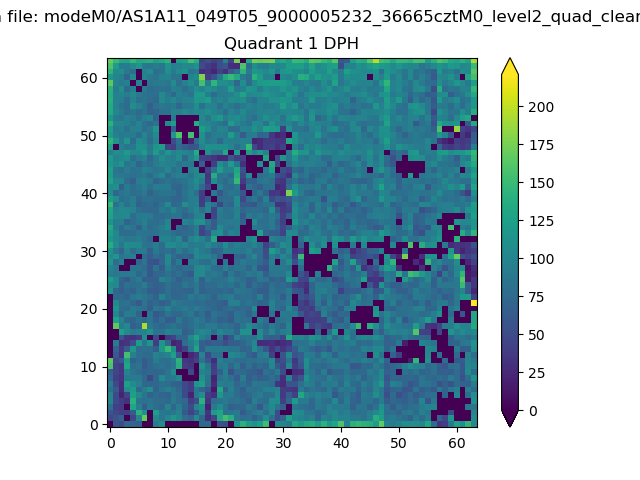 |
Quadrant B |
|---|---|---|---|
| Quadrant D | 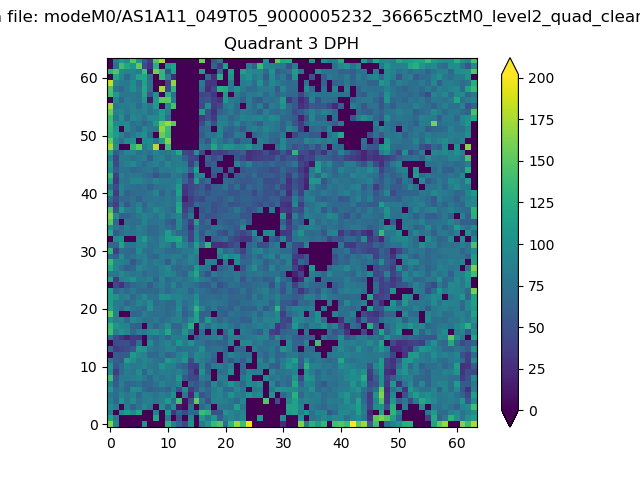 |
 |
Quadrant C |
| Plot type | Count rate plots | Images |
|---|---|---|
| Comparison with Poisson distribution Blue bars denote a histogram of data divided into 1 sec bins. Red curve is a Poisson curve with rate = median count rate of data. |
 |
 |
| Quadrant-wise count rates Data is divided into 100 sec bins |
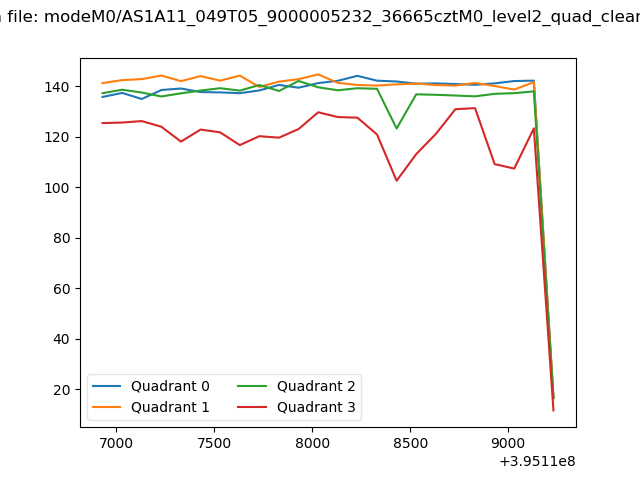 |
|
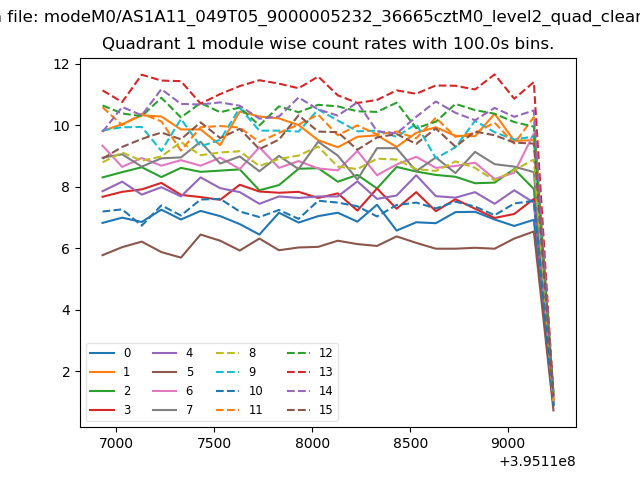
| Module-wise count rates for Quadrant A Data is divided into 100 sec bins |
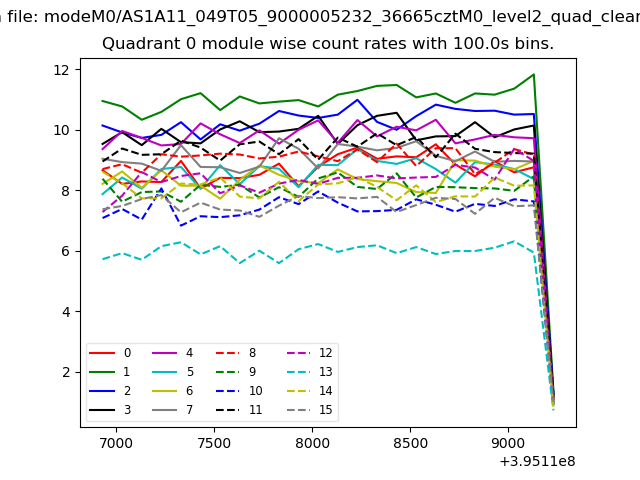 |
 |
| Module-wise count rates for Quadrant B Data is divided into 100 sec bins |
 |
 |
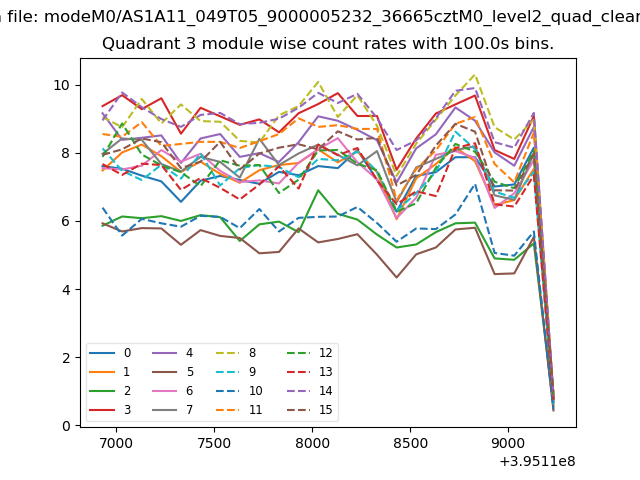
| Module-wise count rates for Quadrant C Data is divided into 100 sec bins |
 |
 |
| Module-wise count rates for Quadrant D Data is divided into 100 sec bins |
 |
 |
| Parameter | Plot |
|---|---|
| CZT HV Monitor |  |
| D_VDD | 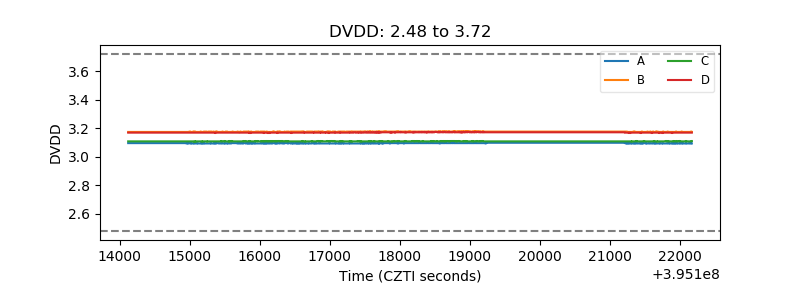 |
| Temperature 1 | 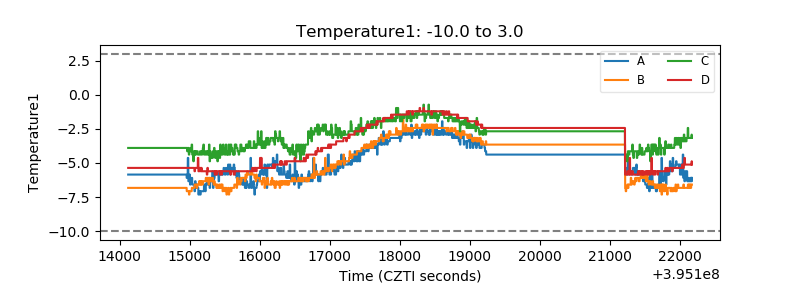 |
| Veto HV Monitor | 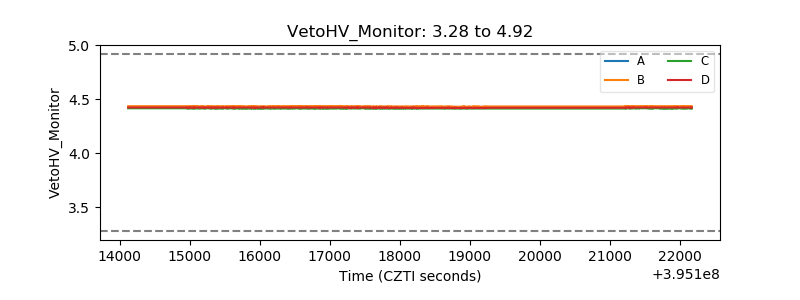 |
| Veto LLD | 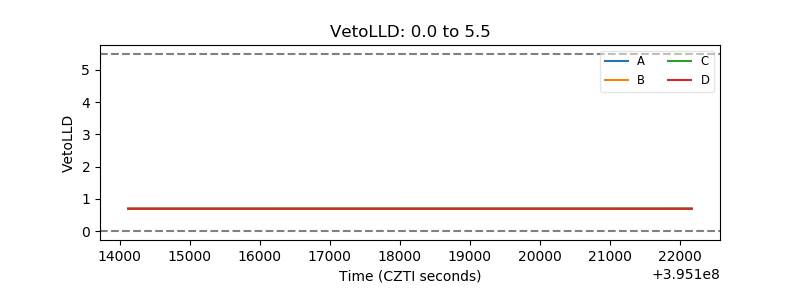 |
| Alpha Counter | 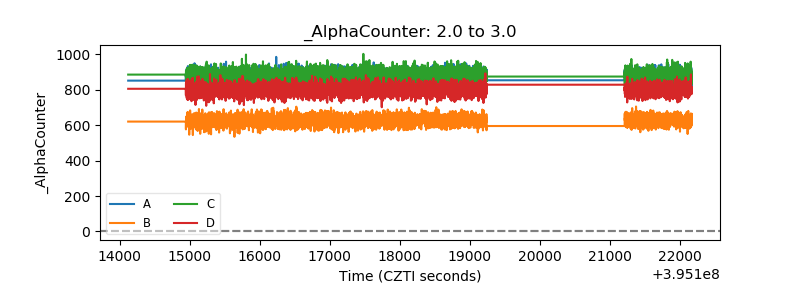 |
| _CPM_Rate | 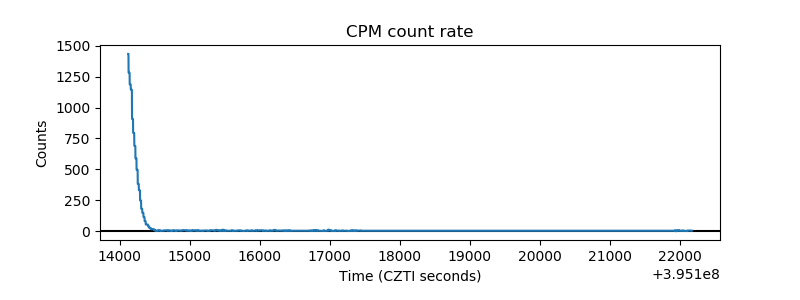 |
| CZT Counter | 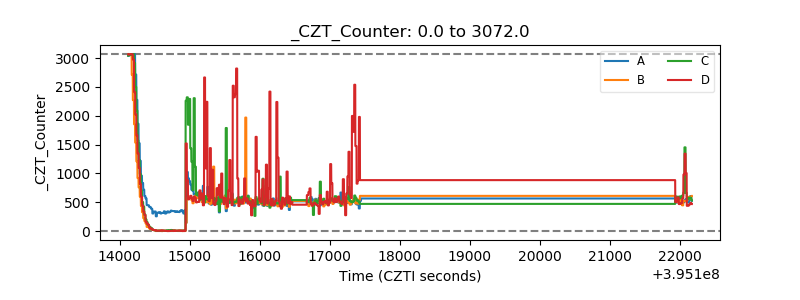 |
| +2.5 Volts monitor | 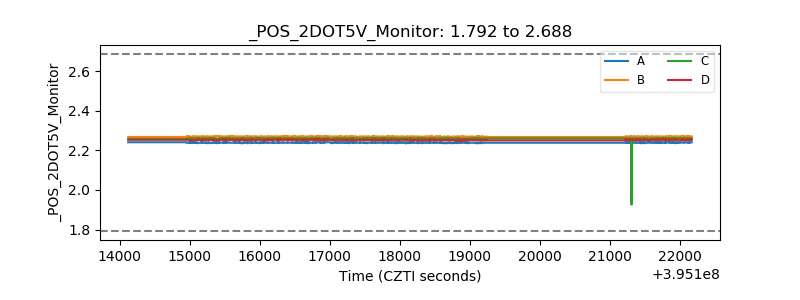 |
| +5 Volts monitor |  |
| _ROLL_ROT | 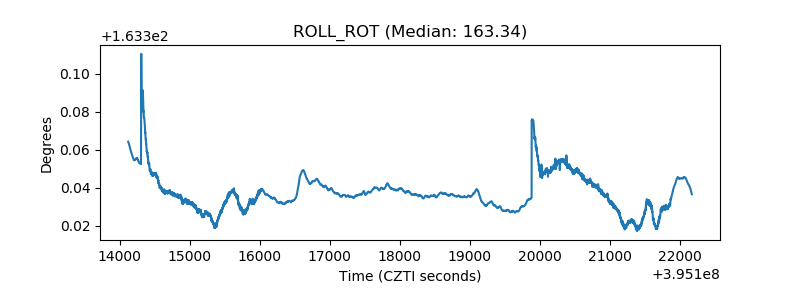 |
| _Roll_DEC | 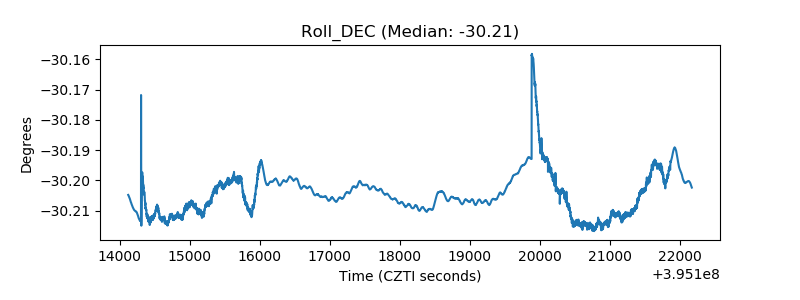 |
| _Roll_RA | 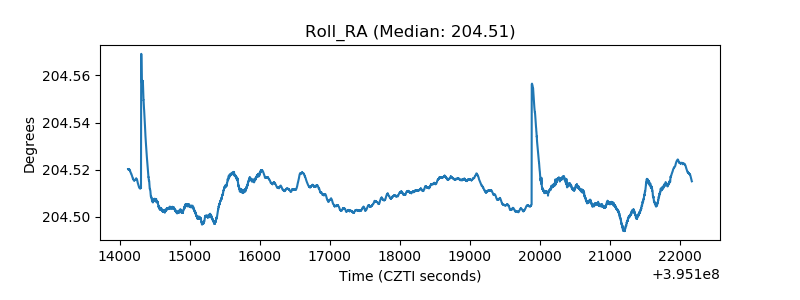 |
| Veto Counter | 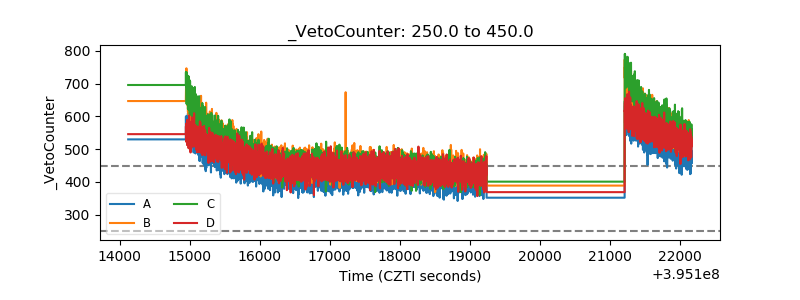 |