| Param | Original file | Final file |
|---|---|---|
| Filename | modeM0/AS1A11_049T05_9000005232_36666cztM0_level2.evt | modeM0/AS1A11_049T05_9000005232_36666cztM0_level2_quad_clean.evt |
| Size (bytes) | 421,139,520 | 61,061,760 |
| Size | 401.6 MB | 58.2 MB |
| Events in quadrant A | 2,960,275 | 380,473 |
| Events in quadrant B | 2,948,800 | 385,115 |
| Events in quadrant C | 3,220,699 | 376,883 |
| Events in quadrant D | 3,280,615 | 351,193 |
| Mode M9 | |||
|---|---|---|---|
| Quadrant | BADHDUFLAG | Total packets | Discarded packets |
| A | 0 | 33 | 0 |
| B | 0 | 33 | 0 |
| C | 0 | 33 | 0 |
| D | 0 | 34 | 0 |
| Mode M0 | |||
|---|---|---|---|
| Quadrant | BADHDUFLAG | Total packets | Discarded packets |
| A | 0 | 11782 | 3 |
| B | 0 | 11675 | 2 |
| C | 0 | 12507 | 2 |
| D | 0 | 12778 | 2 |
| Mode SS | |||
|---|---|---|---|
| Quadrant | BADHDUFLAG | Total packets | Discarded packets |
| A | 0 | 104 | 0 |
| B | 0 | 104 | 0 |
| C | 0 | 104 | 0 |
| D | 0 | 104 | 0 |
| Quadrant | Total seconds | Saturated seconds | Saturation percentage |
|---|---|---|---|
| A | 5063 | 11 | 0.217262% |
| B | 5063 | 62 | 1.224570% |
| C | 5063 | 123 | 2.429390% |
| D | 5063 | 132 | 2.607150% |
Noise dominated data is calculated using 1-second bins in cleaned event files. If a bin has >2000 counts, and if more than 50% of those come from <1% of pixels, then it is considered to be noise-dominated and hence unusable.
| Quadrant | # 1 sec bins | Bins with >0 counts | Bins with >2000 counts | High rate bins dominated by noise | Noise dominated (total time) | Noise dominated (detector-on time) | Marked lightcurve |
|---|---|---|---|---|---|---|---|
| A | 7156 | 5064 | 1 | 1 | 0.01% | 0.02% | 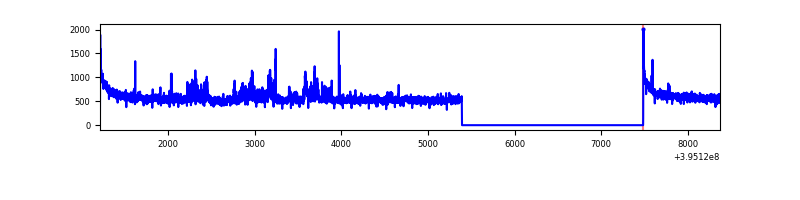 |
| B | 7156 | 5064 | 33 | 33 | 0.46% | 0.65% | 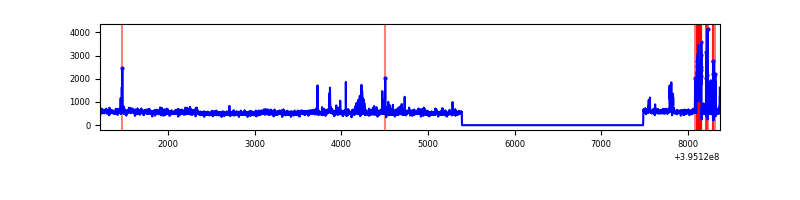 |
| C | 7156 | 5064 | 86 | 86 | 1.20% | 1.70% | 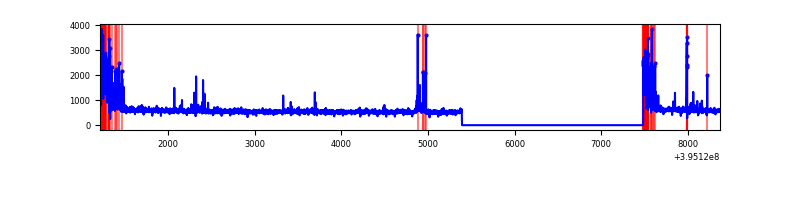 |
| D | 7156 | 5064 | 119 | 119 | 1.66% | 2.35% | 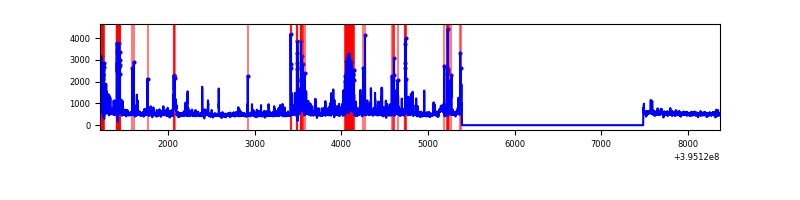 |
Top three noisy pixels from each quadrant. If the there are fewer than three noisy pixels in the level2.evt file, extra rows are filled as -1
| Pixel properties | Quadrant properties | ||||||
|---|---|---|---|---|---|---|---|
| Quadrant | DetID | PixID | Counts | Sigma | Mean | Median | Sigma |
| A | 10 | 83 | 201385 | 1508.71 | 671 | 662 | 133.0 |
| A | 10 | 255 | 143818 | 1076.02 | 671 | 662 | 133.0 |
| A | 9 | 143 | 9971 | 69.97 | 671 | 662 | 133.0 |
| B | 5 | 255 | 188710 | 1519.17 | 665 | 651 | 123.8 |
| B | 0 | 190 | 39621 | 314.81 | 665 | 651 | 123.8 |
| B | 0 | 189 | 38757 | 307.83 | 665 | 651 | 123.8 |
| C | 0 | 10 | 389241 | 2640.86 | 647 | 652 | 147.1 |
| C | 15 | 214 | 231736 | 1570.45 | 647 | 652 | 147.1 |
| C | 14 | 254 | 70476 | 474.53 | 647 | 652 | 147.1 |
| D | 12 | 233 | 189051 | 1222.01 | 642 | 625 | 154.2 |
| D | 13 | 249 | 136111 | 878.68 | 642 | 625 | 154.2 |
| D | 13 | 171 | 127714 | 824.22 | 642 | 625 | 154.2 |
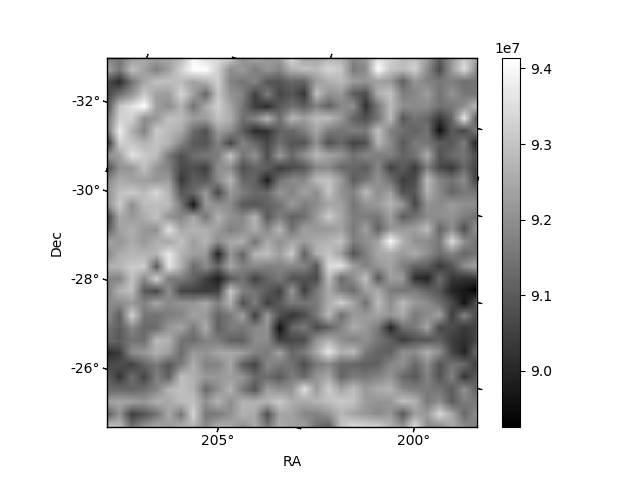
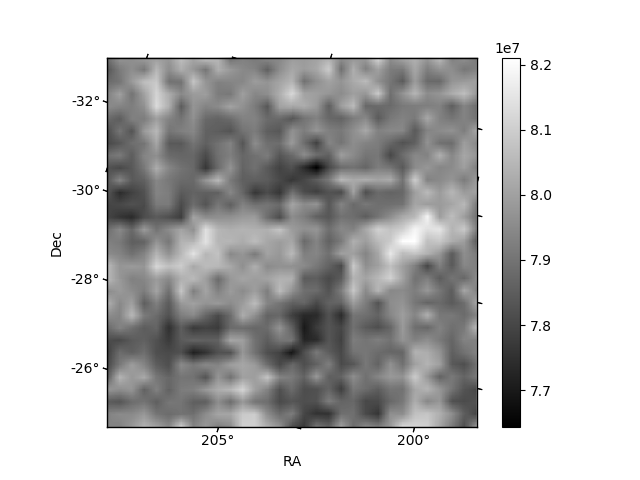
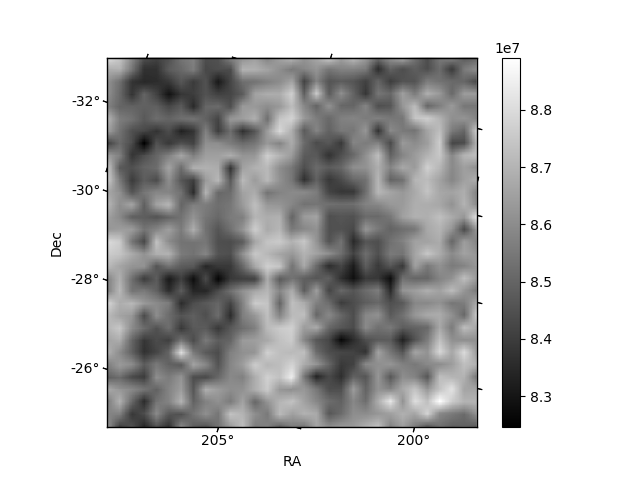
Histogram calculated using DETX and DETY for each event in the final _common_clean file
| Quadrant A |  |
 |
Quadrant B |
|---|---|---|---|
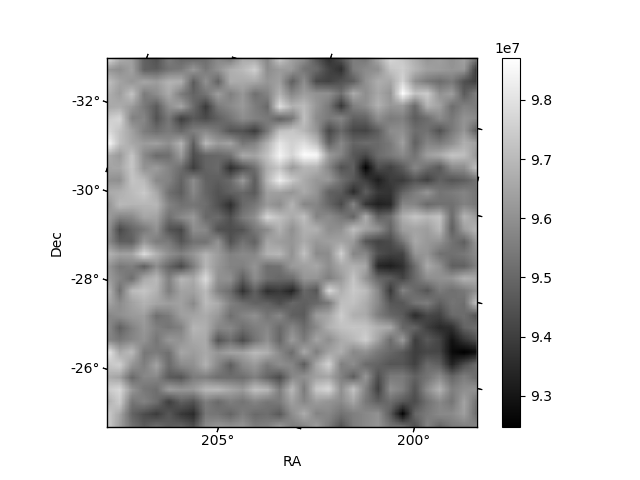
| Quadrant D | 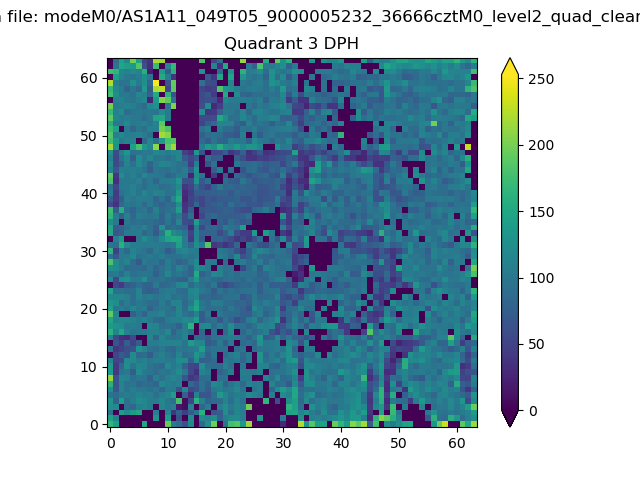 |
 |
Quadrant C |
| Plot type | Count rate plots | Images |
|---|---|---|
| Comparison with Poisson distribution Blue bars denote a histogram of data divided into 1 sec bins. Red curve is a Poisson curve with rate = median count rate of data. |
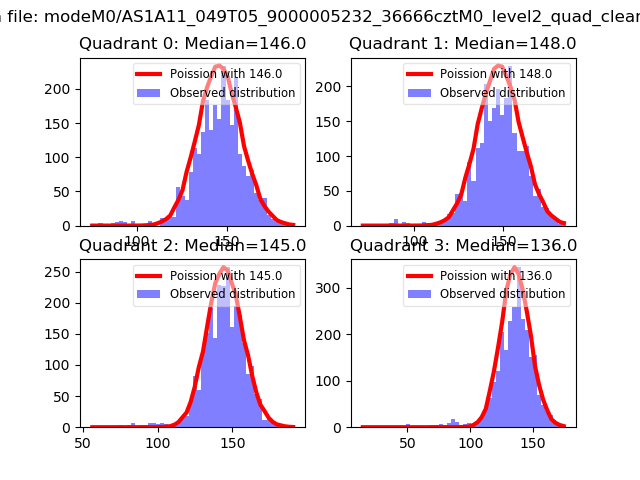 |
 |
| Quadrant-wise count rates Data is divided into 100 sec bins |
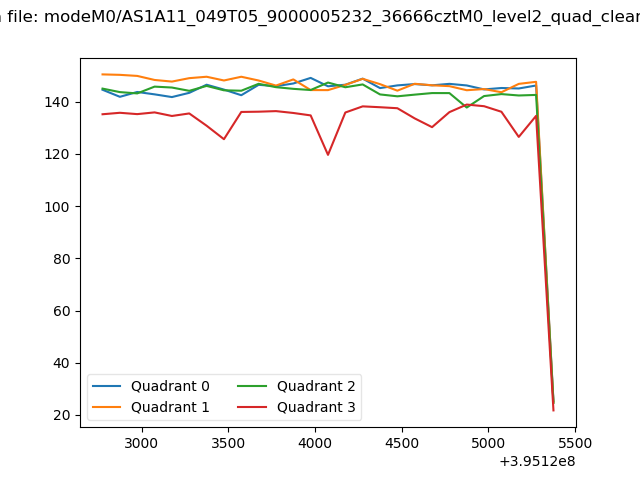 |
|
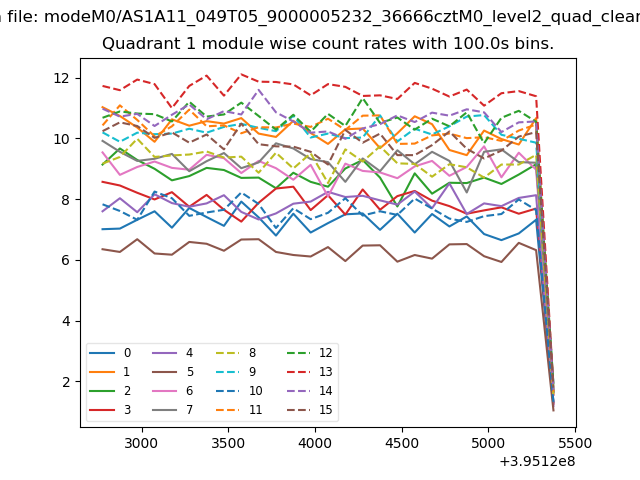
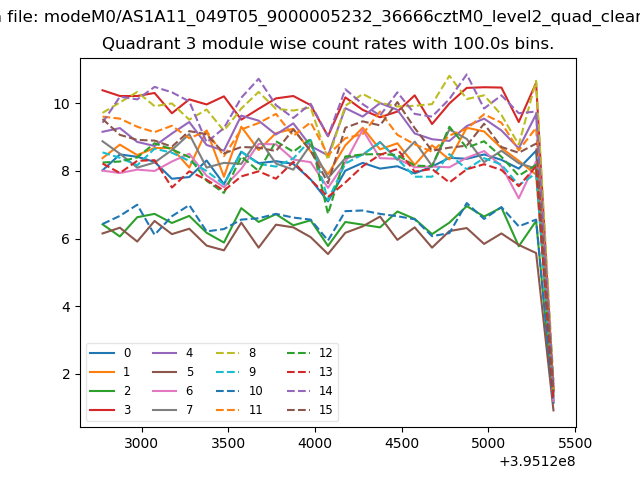
| Module-wise count rates for Quadrant A Data is divided into 100 sec bins |
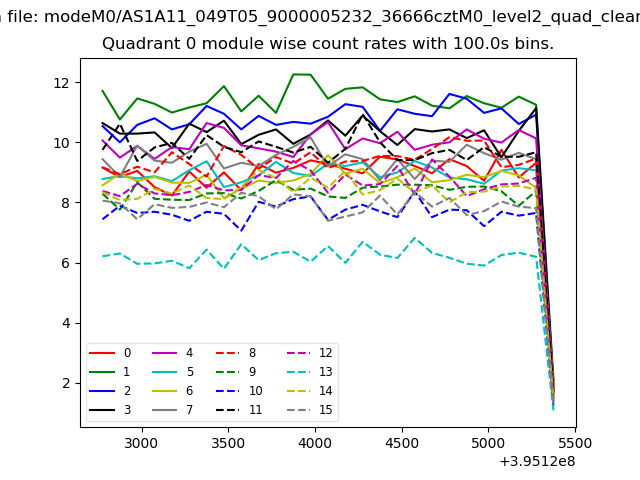 |
 |
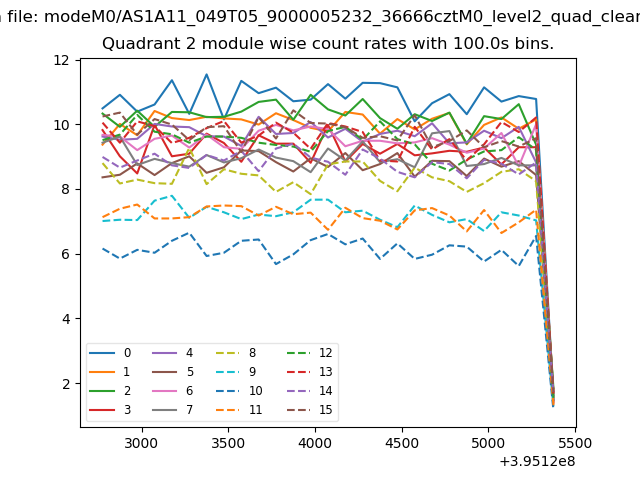
| Module-wise count rates for Quadrant B Data is divided into 100 sec bins |
 |
 |
| Module-wise count rates for Quadrant C Data is divided into 100 sec bins |
 |
 |
| Module-wise count rates for Quadrant D Data is divided into 100 sec bins |
 |
 |
| Parameter | Plot |
|---|---|
| CZT HV Monitor | 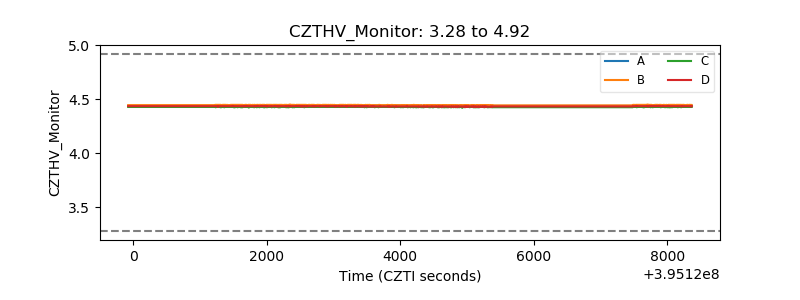 |
| D_VDD | 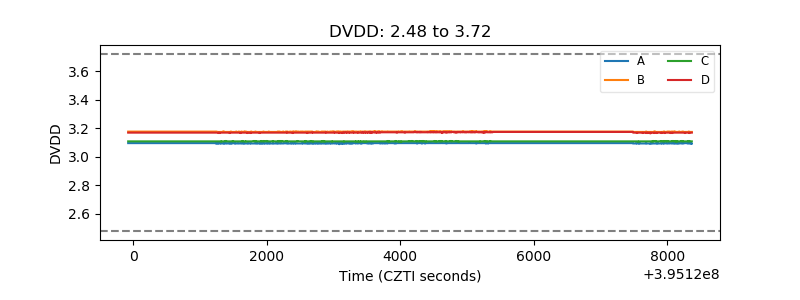 |
| Temperature 1 | 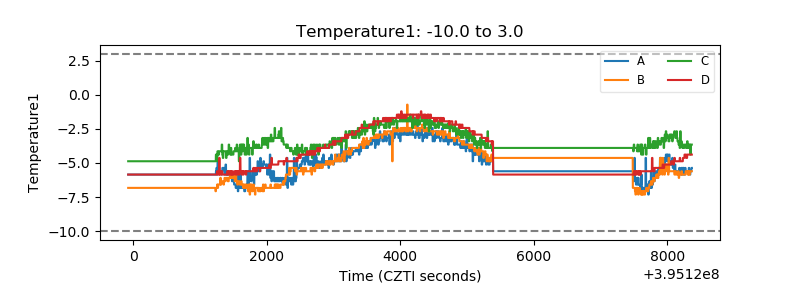 |
| Veto HV Monitor | 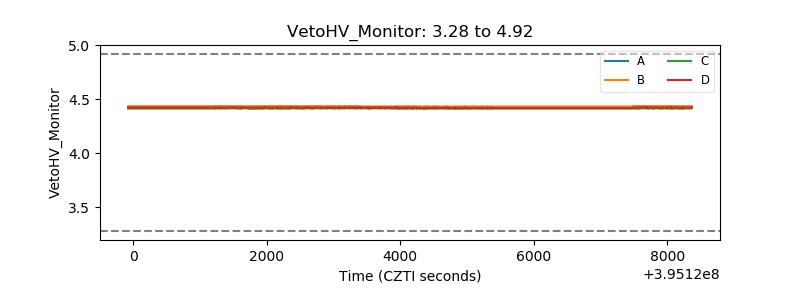 |
| Veto LLD |  |
| Alpha Counter | 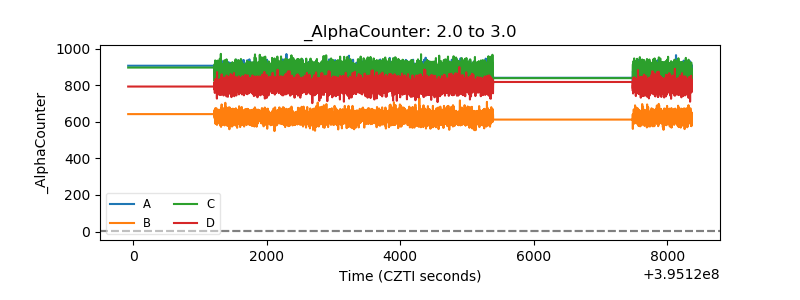 |
| _CPM_Rate | 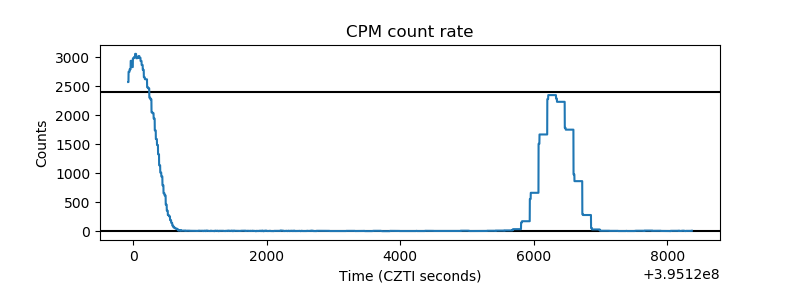 |
| CZT Counter | 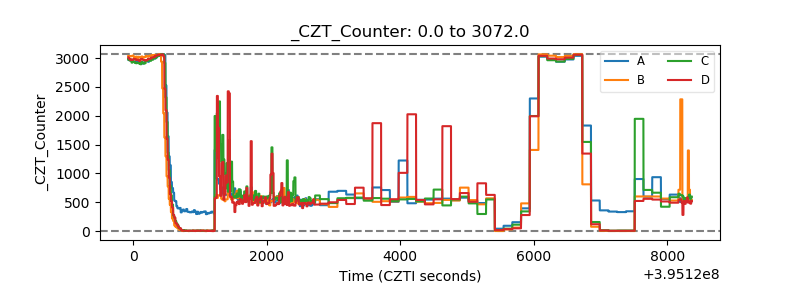 |
| +2.5 Volts monitor |  |
| +5 Volts monitor |  |
| _ROLL_ROT | 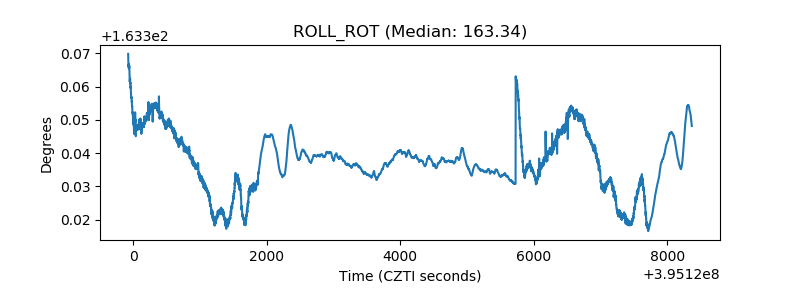 |
| _Roll_DEC | 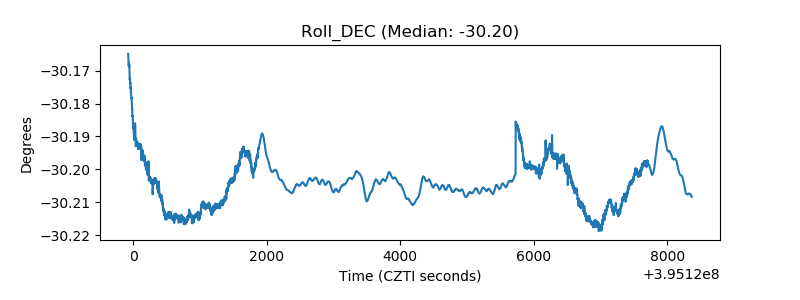 |
| _Roll_RA | 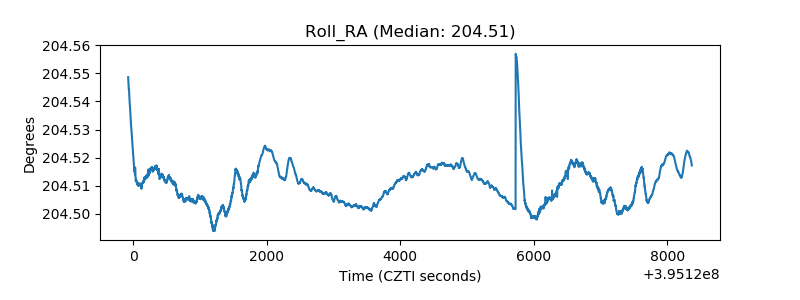 |
| Veto Counter | 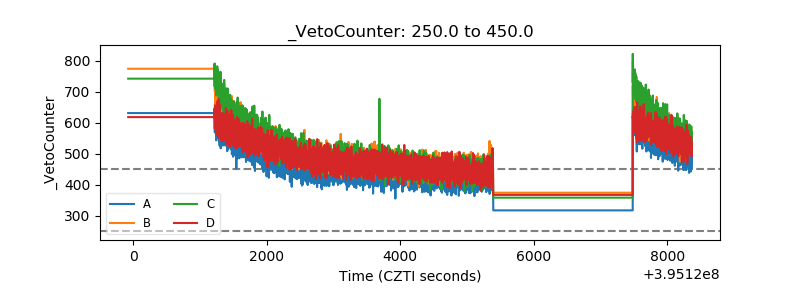 |