| Param | Original file | Final file |
|---|---|---|
| Filename | modeM0/AS1A11_049T05_9000005232_36667cztM0_level2.evt | modeM0/AS1A11_049T05_9000005232_36667cztM0_level2_quad_clean.evt |
| Size (bytes) | 407,977,920 | 68,817,600 |
| Size | 389.1 MB | 65.6 MB |
| Events in quadrant A | 2,701,042 | 446,623 |
| Events in quadrant B | 2,876,622 | 447,709 |
| Events in quadrant C | 3,068,915 | 439,212 |
| Events in quadrant D | 3,378,010 | 408,296 |
| Mode M9 | |||
|---|---|---|---|
| Quadrant | BADHDUFLAG | Total packets | Discarded packets |
| A | 0 | 27 | 0 |
| B | 0 | 27 | 0 |
| C | 0 | 27 | 0 |
| D | 0 | 28 | 0 |
| Mode M0 | |||
|---|---|---|---|
| Quadrant | BADHDUFLAG | Total packets | Discarded packets |
| A | 0 | 10745 | 3 |
| B | 0 | 11338 | 2 |
| C | 0 | 11988 | 2 |
| D | 0 | 12922 | 2 |
| Mode SS | |||
|---|---|---|---|
| Quadrant | BADHDUFLAG | Total packets | Discarded packets |
| A | 0 | 98 | 0 |
| B | 0 | 98 | 0 |
| C | 0 | 98 | 0 |
| D | 0 | 98 | 0 |
| Quadrant | Total seconds | Saturated seconds | Saturation percentage |
|---|---|---|---|
| A | 4878 | 9 | 0.184502% |
| B | 4878 | 86 | 1.763018% |
| C | 4878 | 129 | 2.644526% |
| D | 4878 | 193 | 3.956540% |
Noise dominated data is calculated using 1-second bins in cleaned event files. If a bin has >2000 counts, and if more than 50% of those come from <1% of pixels, then it is considered to be noise-dominated and hence unusable.
| Quadrant | # 1 sec bins | Bins with >0 counts | Bins with >2000 counts | High rate bins dominated by noise | Noise dominated (total time) | Noise dominated (detector-on time) | Marked lightcurve |
|---|---|---|---|---|---|---|---|
| A | 7031 | 4879 | 3 | 3 | 0.04% | 0.06% | 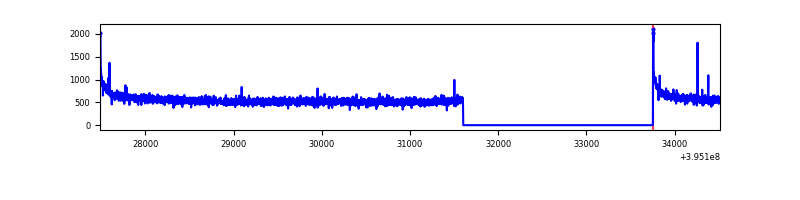 |
| B | 7031 | 4879 | 52 | 52 | 0.74% | 1.07% | 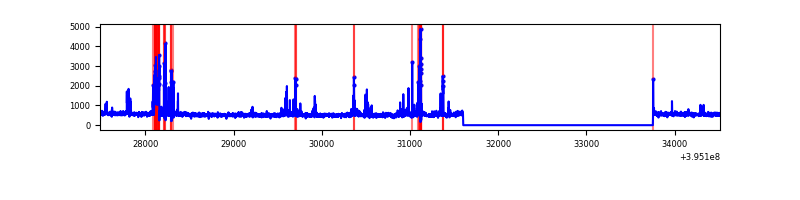 |
| C | 7031 | 4879 | 92 | 92 | 1.31% | 1.89% | 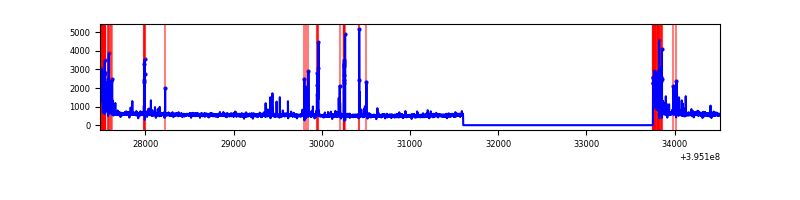 |
| D | 7031 | 4879 | 173 | 173 | 2.46% | 3.55% | 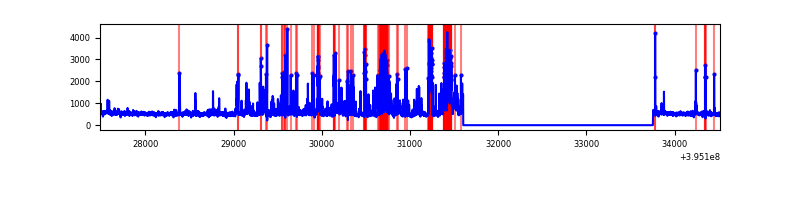 |
Top three noisy pixels from each quadrant. If the there are fewer than three noisy pixels in the level2.evt file, extra rows are filled as -1
| Pixel properties | Quadrant properties | ||||||
|---|---|---|---|---|---|---|---|
| Quadrant | DetID | PixID | Counts | Sigma | Mean | Median | Sigma |
| A | 10 | 83 | 198320 | 1554.46 | 643 | 633 | 127.2 |
| A | 13 | 254 | 7206 | 51.69 | 643 | 633 | 127.2 |
| A | 10 | 255 | 6556 | 46.57 | 643 | 633 | 127.2 |
| B | 5 | 255 | 272827 | 2303.62 | 632 | 618 | 118.2 |
| B | 0 | 221 | 31798 | 263.87 | 632 | 618 | 118.2 |
| B | 0 | 189 | 22321 | 183.67 | 632 | 618 | 118.2 |
| C | 0 | 10 | 395035 | 2822.67 | 616 | 622 | 139.7 |
| C | 15 | 214 | 224573 | 1602.73 | 616 | 622 | 139.7 |
| C | 14 | 254 | 29065 | 203.56 | 616 | 622 | 139.7 |
| D | 12 | 233 | 348232 | 2337.7 | 616 | 600 | 148.7 |
| D | 13 | 171 | 259403 | 1740.36 | 616 | 600 | 148.7 |
| D | 2 | 153 | 143340 | 959.88 | 616 | 600 | 148.7 |
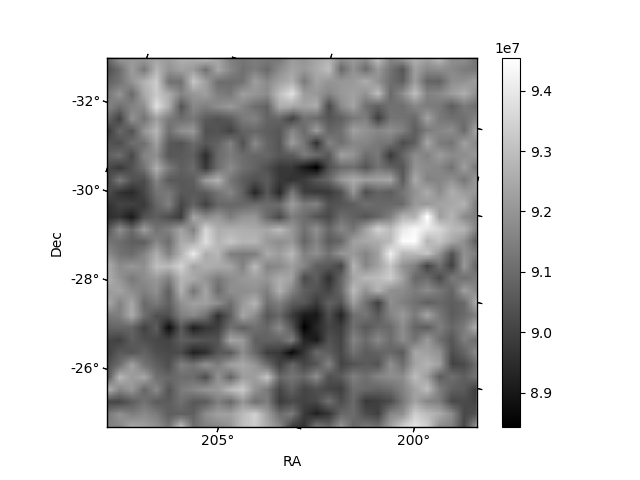
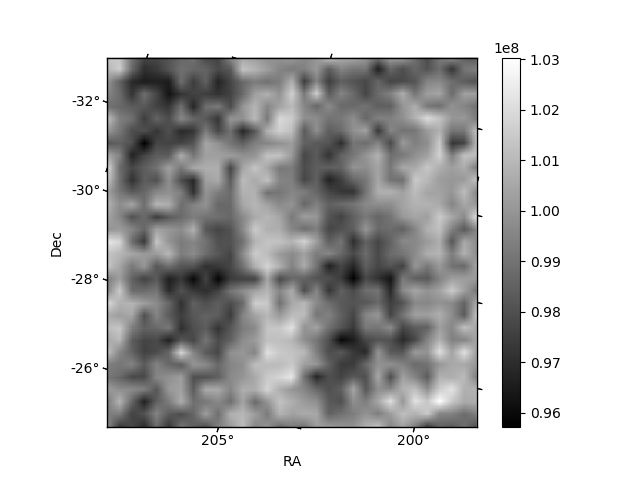
Histogram calculated using DETX and DETY for each event in the final _common_clean file
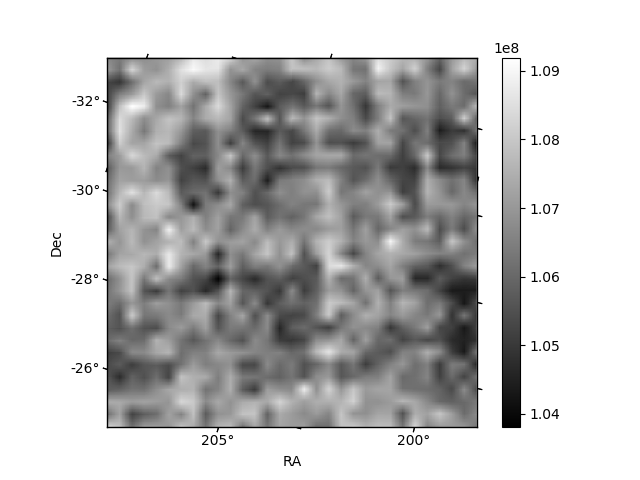
| Quadrant A |  |
 |
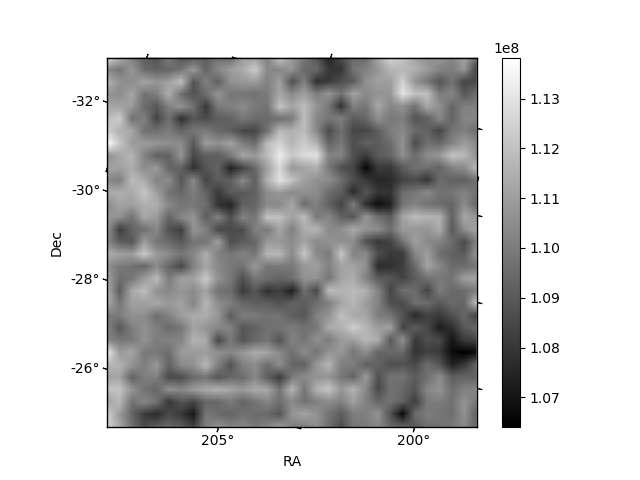
Quadrant B |
|---|---|---|---|
| Quadrant D |  |
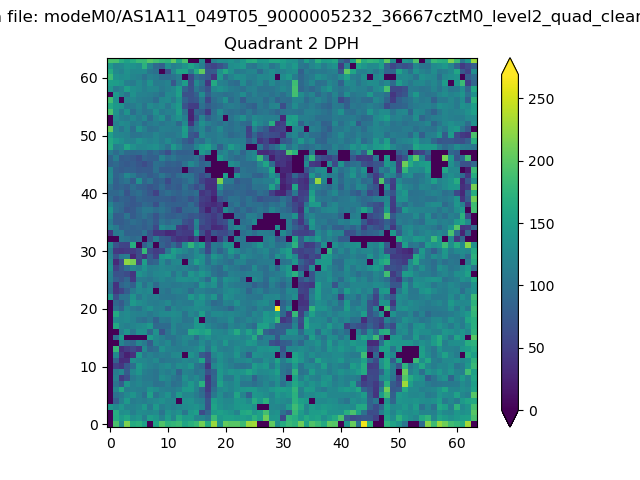 |
Quadrant C |
| Plot type | Count rate plots | Images |
|---|---|---|
| Comparison with Poisson distribution Blue bars denote a histogram of data divided into 1 sec bins. Red curve is a Poisson curve with rate = median count rate of data. |
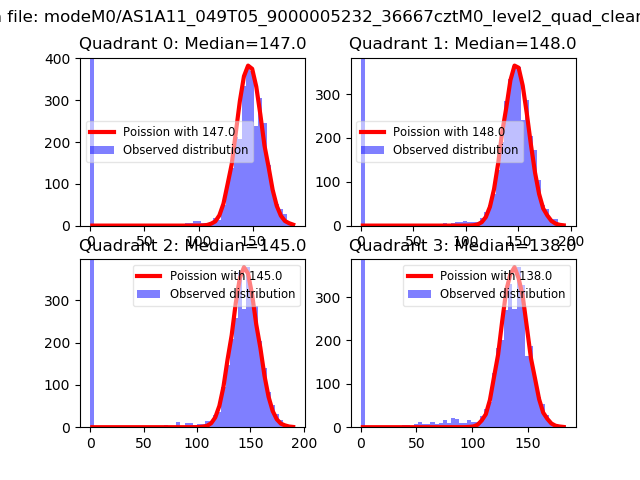 |
 |
| Quadrant-wise count rates Data is divided into 100 sec bins |
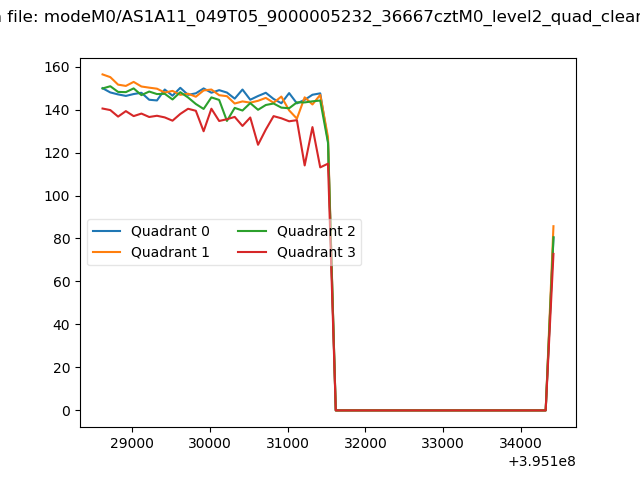 |
|
| Module-wise count rates for Quadrant A Data is divided into 100 sec bins |
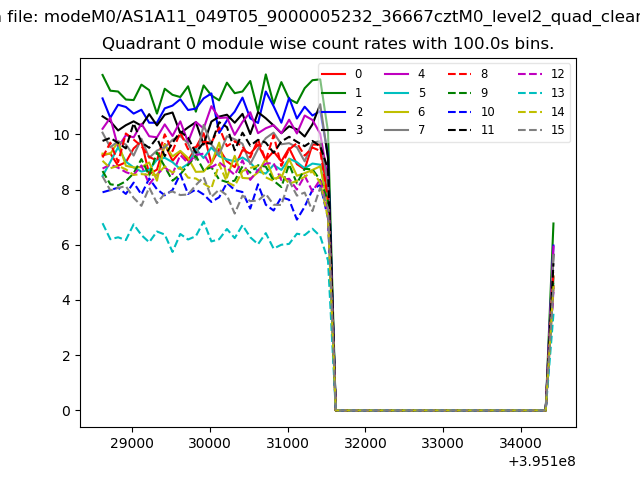 |
 |
| Module-wise count rates for Quadrant B Data is divided into 100 sec bins |
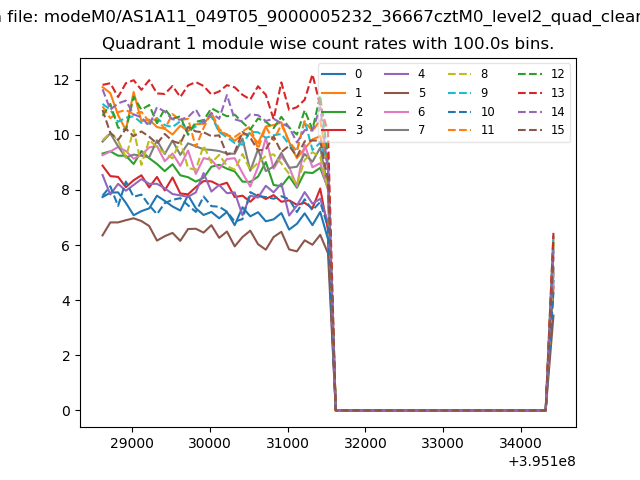 |
 |
| Module-wise count rates for Quadrant C Data is divided into 100 sec bins |
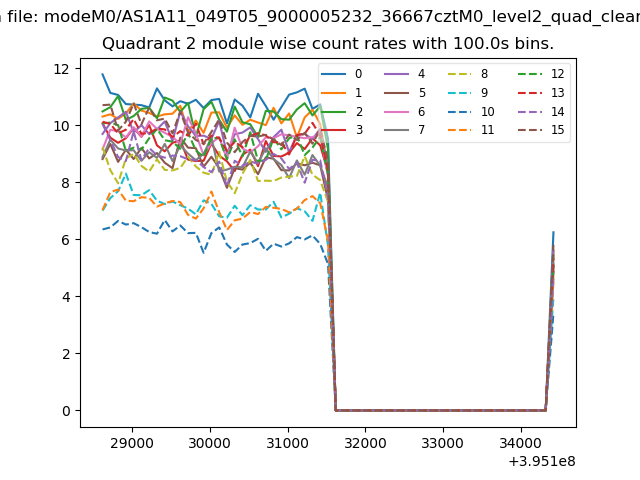 |
 |
| Module-wise count rates for Quadrant D Data is divided into 100 sec bins |
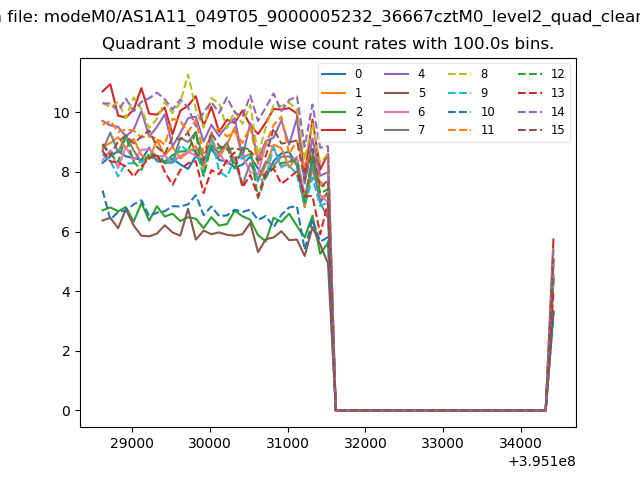 |
 |
| Parameter | Plot |
|---|---|
| CZT HV Monitor | 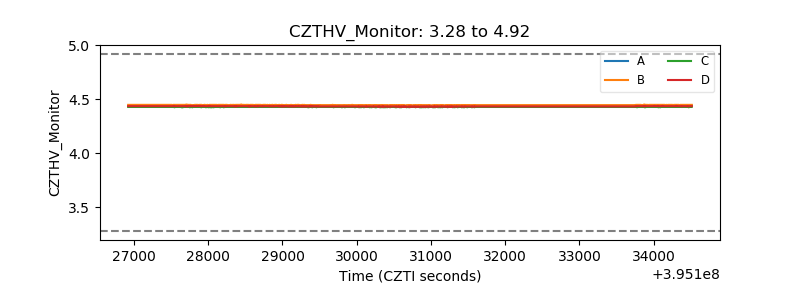 |
| D_VDD | 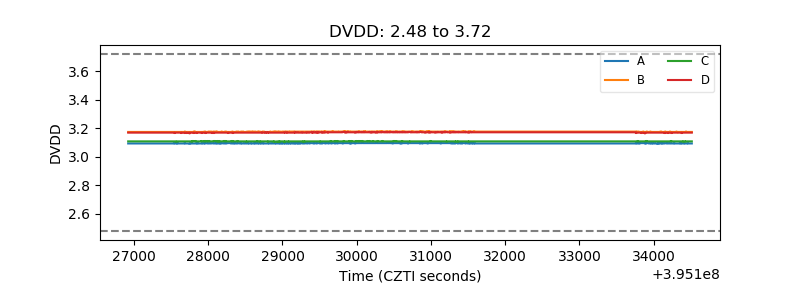 |
| Temperature 1 | 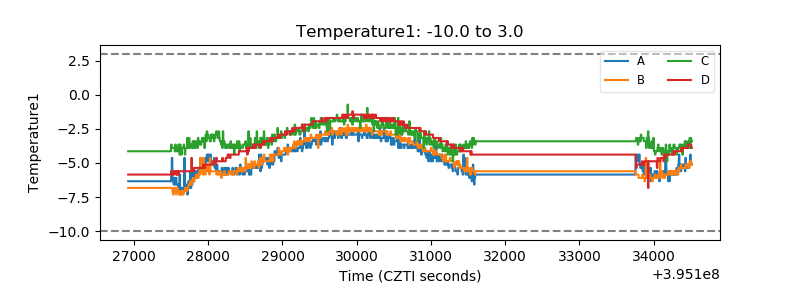 |
| Veto HV Monitor |  |
| Veto LLD | 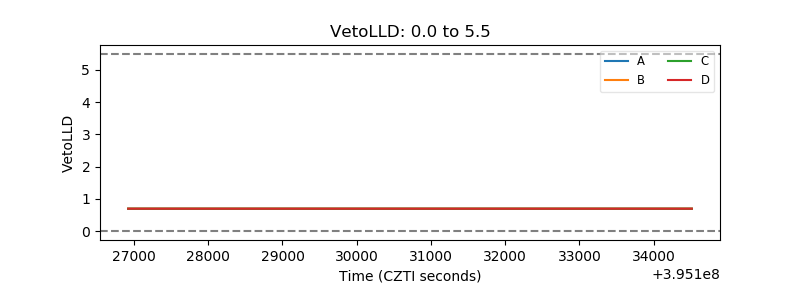 |
| Alpha Counter | 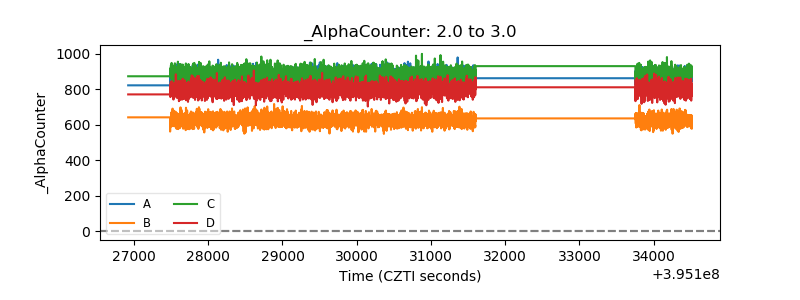 |
| _CPM_Rate | 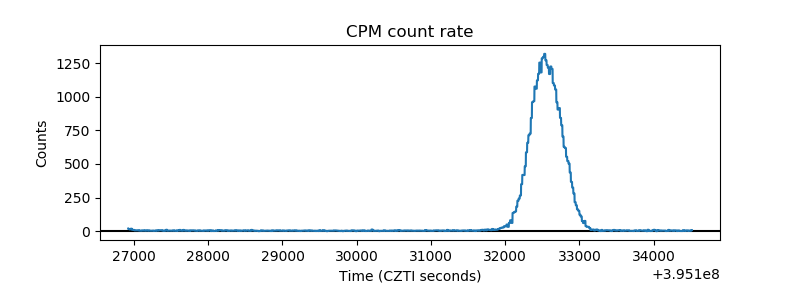 |
| CZT Counter |  |
| +2.5 Volts monitor |  |
| +5 Volts monitor |  |
| _ROLL_ROT | 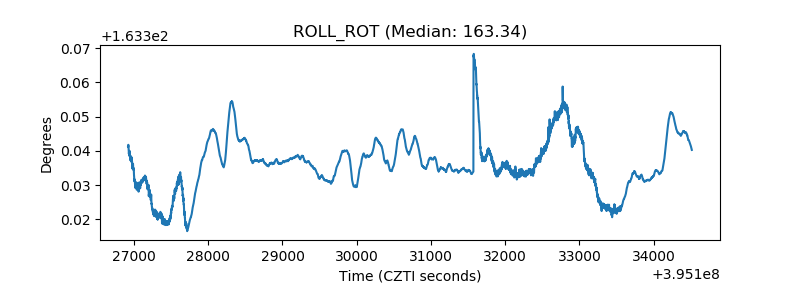 |
| _Roll_DEC | 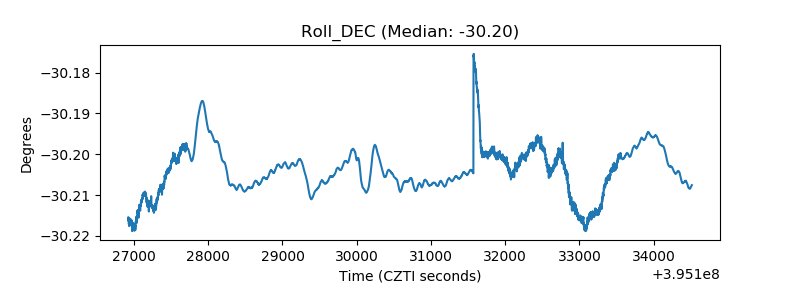 |
| _Roll_RA | 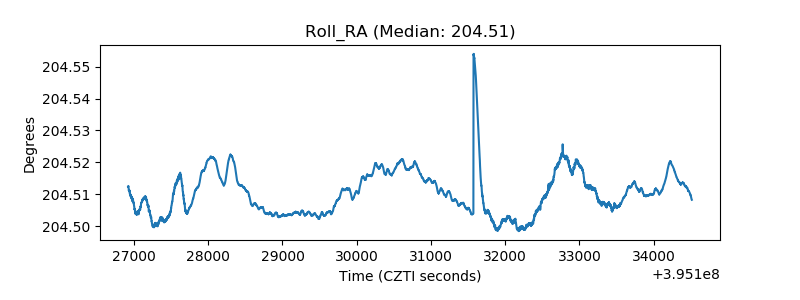 |
| Veto Counter | 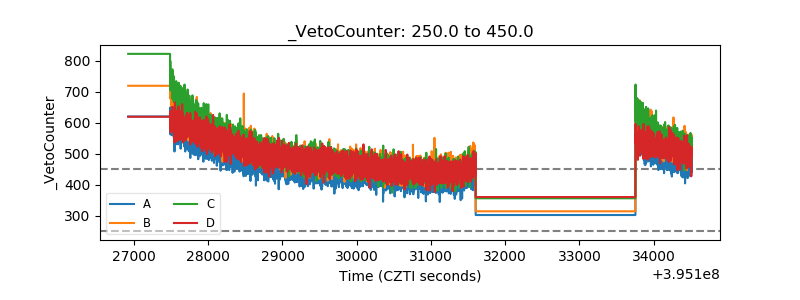 |