| Param | Original file | Final file |
|---|---|---|
| Filename | modeM0/AS1A11_049T05_9000005232_36668cztM0_level2.evt | modeM0/AS1A11_049T05_9000005232_36668cztM0_level2_quad_clean.evt |
| Size (bytes) | 437,509,440 | 81,564,480 |
| Size | 417.2 MB | 77.8 MB |
| Events in quadrant A | 2,687,677 | 550,959 |
| Events in quadrant B | 2,540,519 | 556,002 |
| Events in quadrant C | 3,881,592 | 516,081 |
| Events in quadrant D | 3,809,205 | 504,742 |
| Mode M9 | |||
|---|---|---|---|
| Quadrant | BADHDUFLAG | Total packets | Discarded packets |
| A | 0 | 30 | 0 |
| B | 0 | 30 | 0 |
| C | 0 | 30 | 0 |
| D | 0 | 31 | 0 |
| Mode M0 | |||
|---|---|---|---|
| Quadrant | BADHDUFLAG | Total packets | Discarded packets |
| A | 0 | 10795 | 3 |
| B | 0 | 10275 | 2 |
| C | 0 | 14513 | 2 |
| D | 0 | 14376 | 2 |
| Mode SS | |||
|---|---|---|---|
| Quadrant | BADHDUFLAG | Total packets | Discarded packets |
| A | 0 | 98 | 0 |
| B | 0 | 98 | 0 |
| C | 0 | 98 | 0 |
| D | 0 | 98 | 0 |
| Quadrant | Total seconds | Saturated seconds | Saturation percentage |
|---|---|---|---|
| A | 4880 | 32 | 0.655738% |
| B | 4880 | 13 | 0.266393% |
| C | 4880 | 454 | 9.303279% |
| D | 4880 | 196 | 4.016393% |
Noise dominated data is calculated using 1-second bins in cleaned event files. If a bin has >2000 counts, and if more than 50% of those come from <1% of pixels, then it is considered to be noise-dominated and hence unusable.
| Quadrant | # 1 sec bins | Bins with >0 counts | Bins with >2000 counts | High rate bins dominated by noise | Noise dominated (total time) | Noise dominated (detector-on time) | Marked lightcurve |
|---|---|---|---|---|---|---|---|
| A | 7003 | 4881 | 24 | 24 | 0.34% | 0.49% | 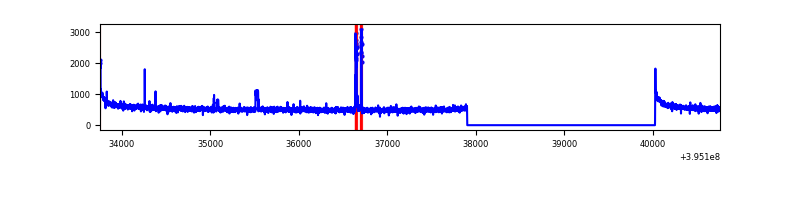 |
| B | 7003 | 4881 | 5 | 5 | 0.07% | 0.10% | 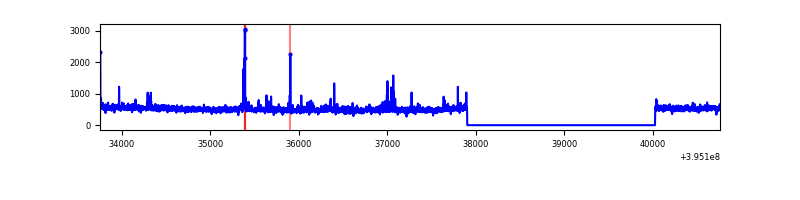 |
| C | 7003 | 4881 | 350 | 350 | 5.00% | 7.17% | 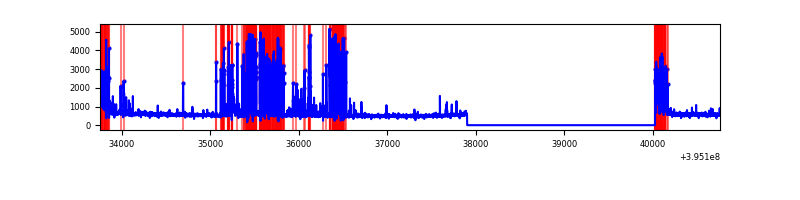 |
| D | 7003 | 4881 | 191 | 191 | 2.73% | 3.91% | 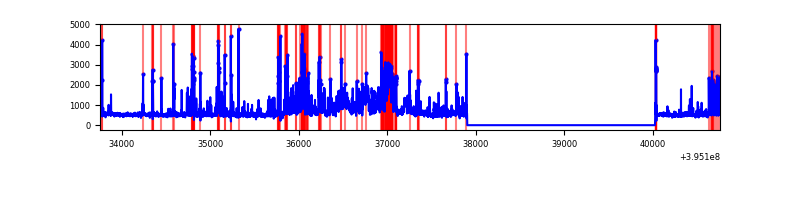 |
Top three noisy pixels from each quadrant. If the there are fewer than three noisy pixels in the level2.evt file, extra rows are filled as -1
| Pixel properties | Quadrant properties | ||||||
|---|---|---|---|---|---|---|---|
| Quadrant | DetID | PixID | Counts | Sigma | Mean | Median | Sigma |
| A | 10 | 83 | 200025 | 1613.44 | 618 | 608 | 123.6 |
| A | 15 | 223 | 60983 | 488.48 | 618 | 608 | 123.6 |
| A | 0 | 8 | 24399 | 192.49 | 618 | 608 | 123.6 |
| B | 0 | 199 | 44945 | 382.72 | 608 | 593 | 115.9 |
| B | 0 | 221 | 27265 | 230.16 | 608 | 593 | 115.9 |
| B | 0 | 189 | 23621 | 198.71 | 608 | 593 | 115.9 |
| C | 0 | 10 | 1398468 | 10618.14 | 571 | 577 | 131.7 |
| C | 15 | 214 | 217852 | 1650.38 | 571 | 577 | 131.7 |
| C | 12 | 249 | 29852 | 222.37 | 571 | 577 | 131.7 |
| D | 12 | 233 | 295360 | 2041.38 | 591 | 575 | 144.4 |
| D | 1 | 20 | 268209 | 1853.36 | 591 | 575 | 144.4 |
| D | 7 | 38 | 265269 | 1833.0 | 591 | 575 | 144.4 |
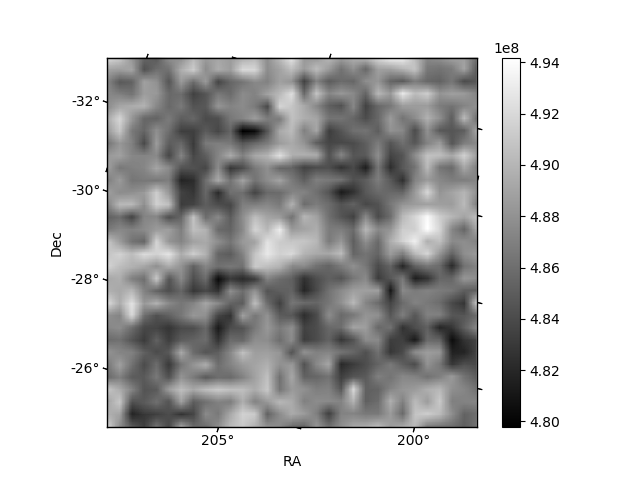
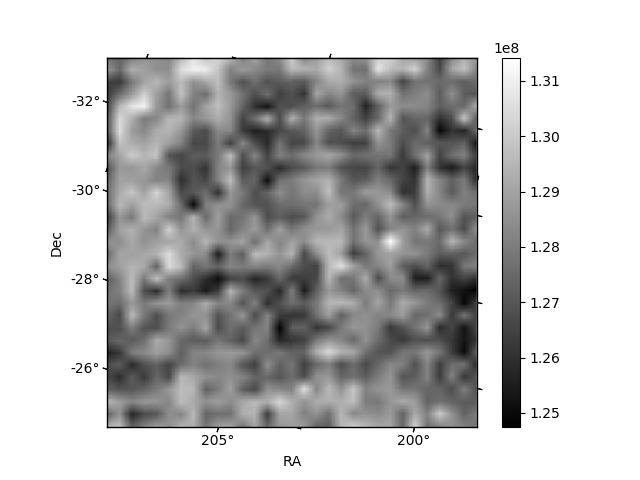
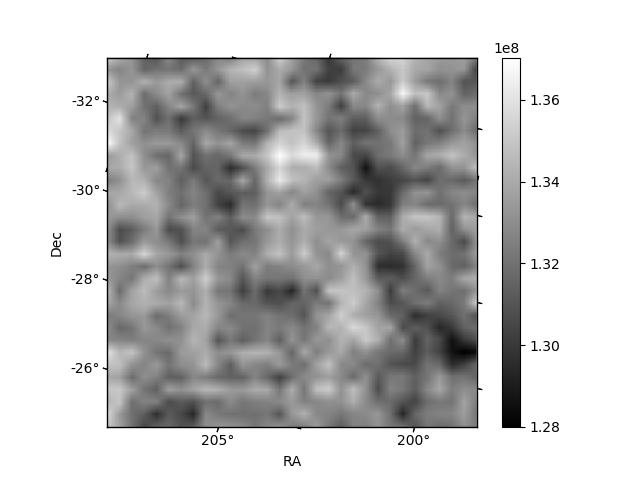
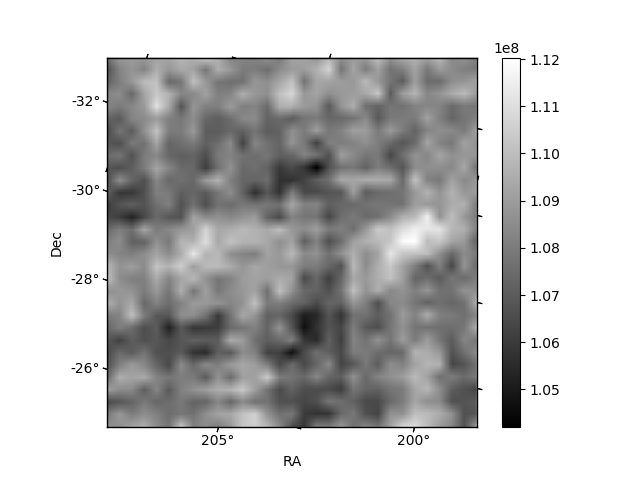
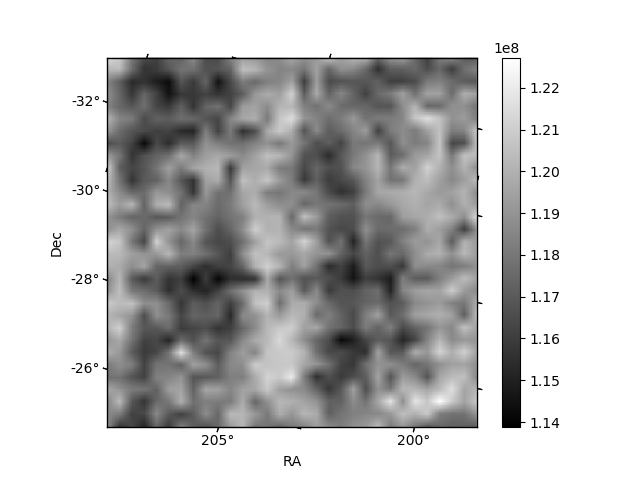
Histogram calculated using DETX and DETY for each event in the final _common_clean file
| Quadrant A | 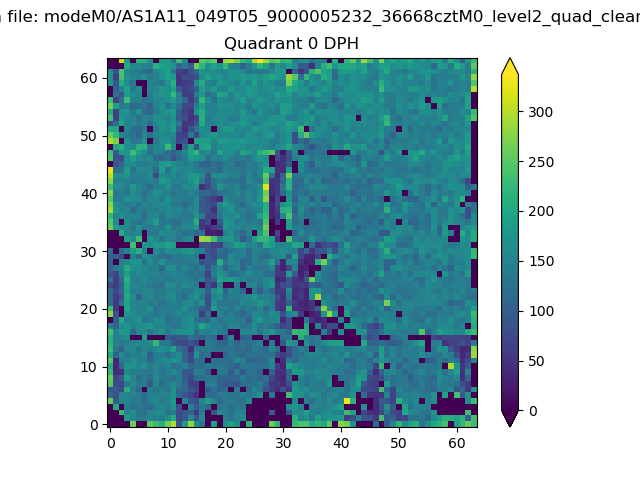 |
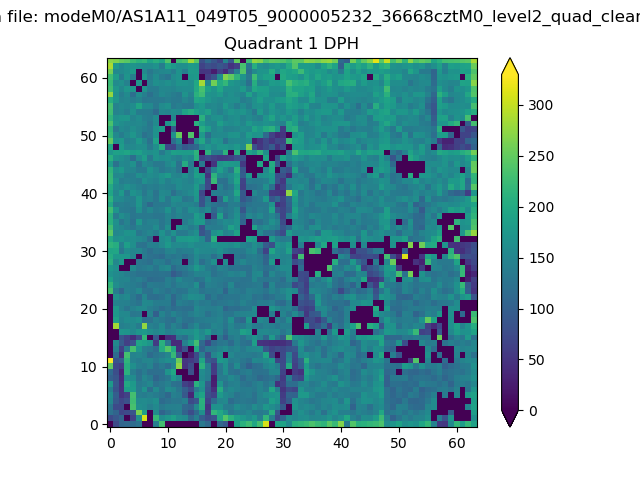 |
Quadrant B |
|---|---|---|---|
| Quadrant D | 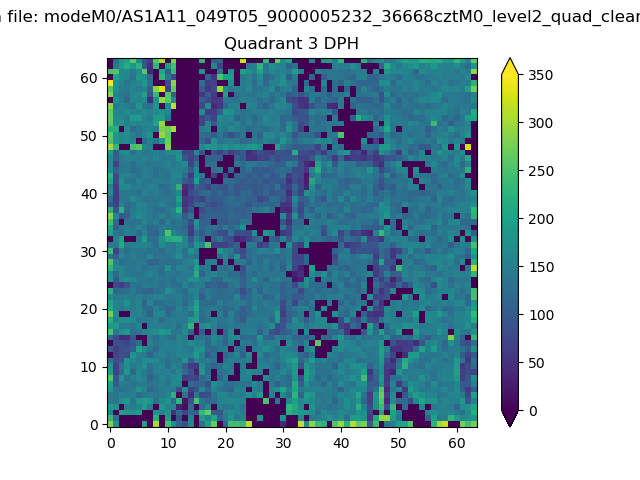 |
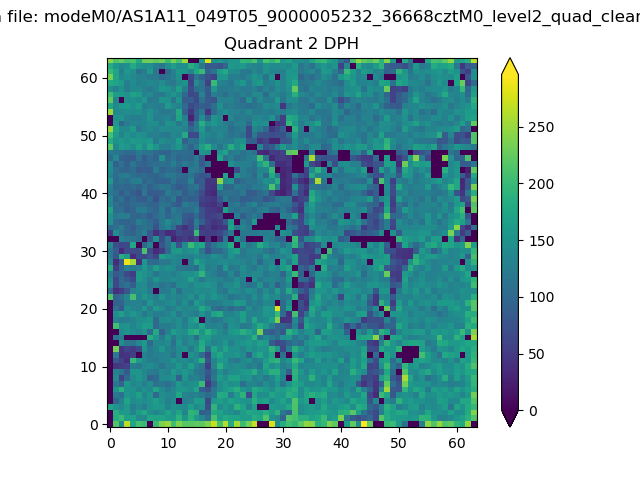 |
Quadrant C |
| Plot type | Count rate plots | Images |
|---|---|---|
| Comparison with Poisson distribution Blue bars denote a histogram of data divided into 1 sec bins. Red curve is a Poisson curve with rate = median count rate of data. |
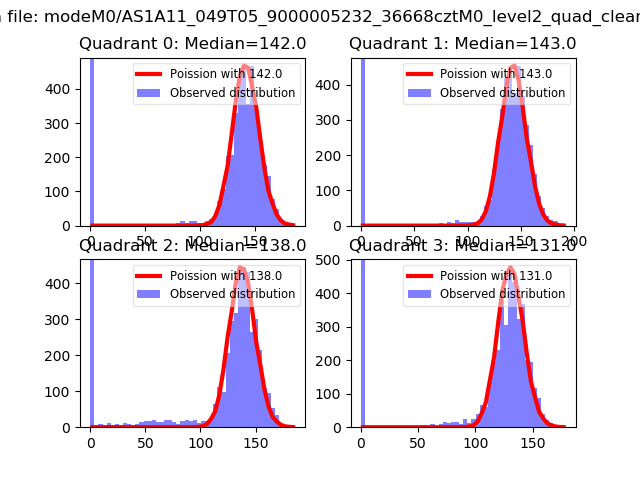 |
 |
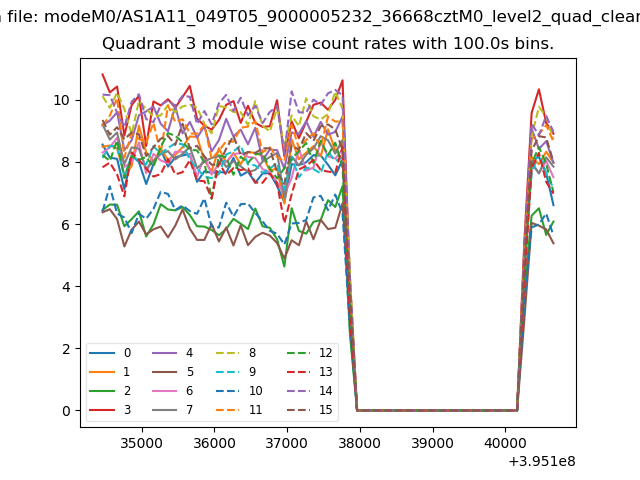
| Quadrant-wise count rates Data is divided into 100 sec bins |
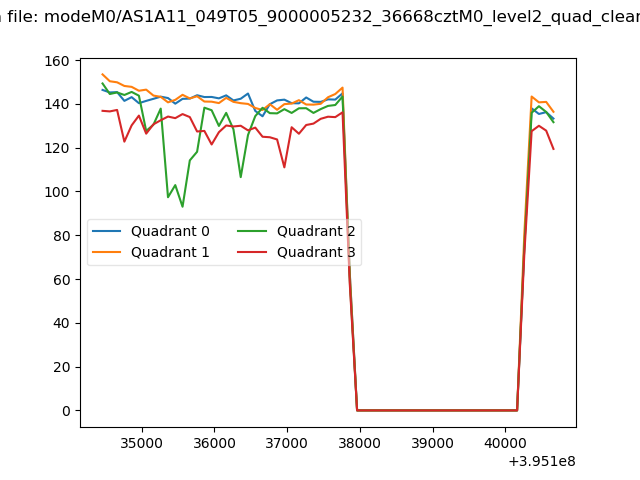 |
|
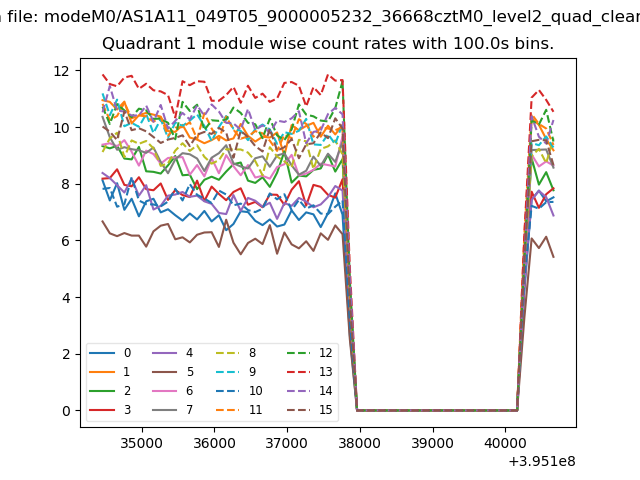
| Module-wise count rates for Quadrant A Data is divided into 100 sec bins |
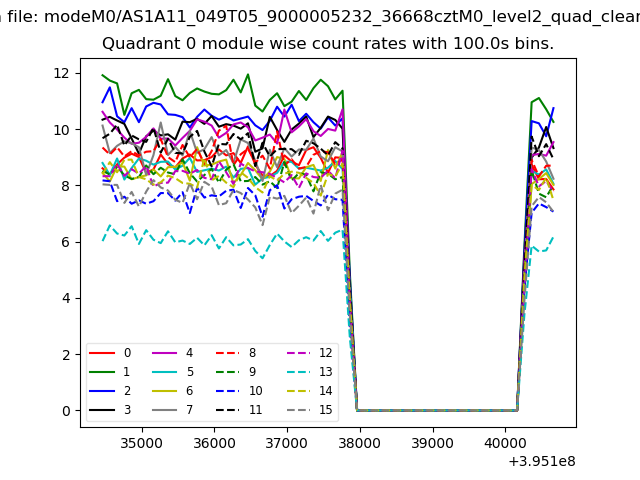 |
 |
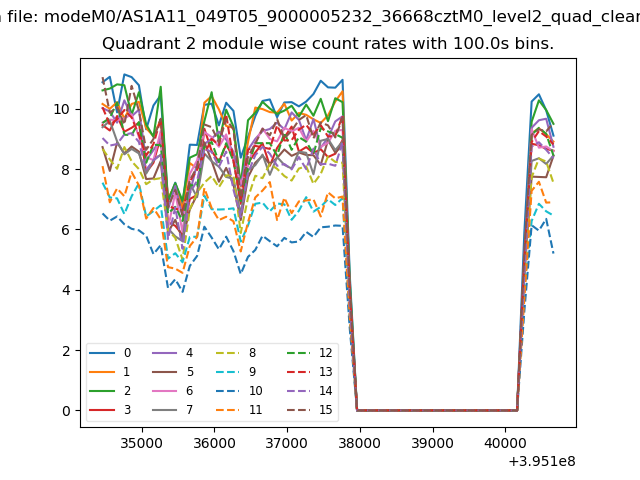
| Module-wise count rates for Quadrant B Data is divided into 100 sec bins |
 |
 |
| Module-wise count rates for Quadrant C Data is divided into 100 sec bins |
 |
 |
| Module-wise count rates for Quadrant D Data is divided into 100 sec bins |
 |
 |
| Parameter | Plot |
|---|---|
| CZT HV Monitor | 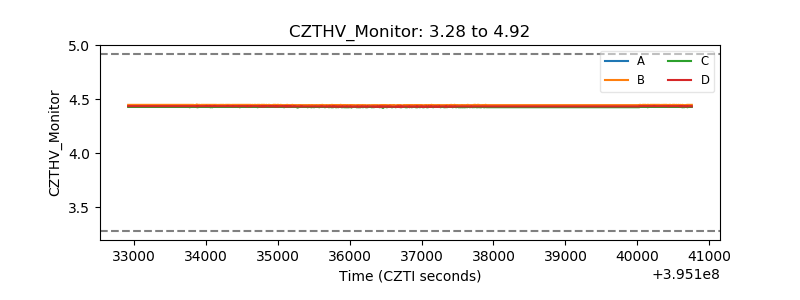 |
| D_VDD | 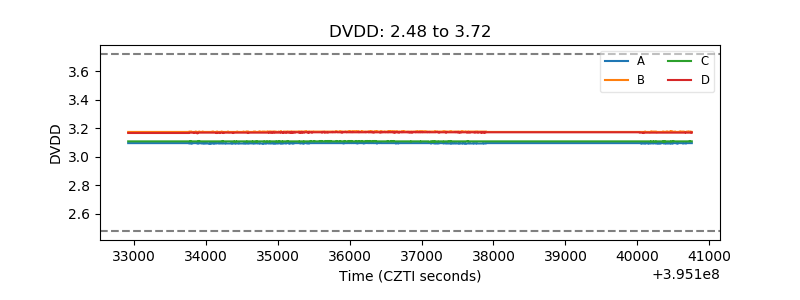 |
| Temperature 1 | 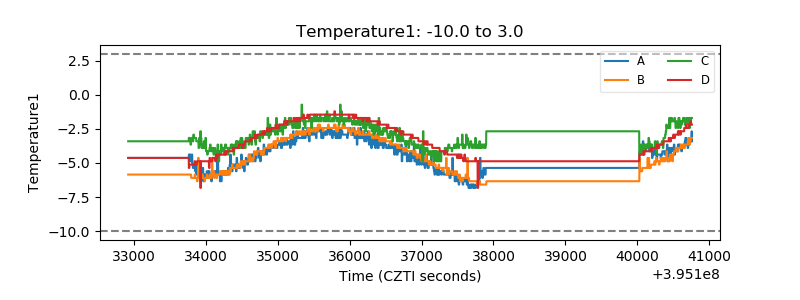 |
| Veto HV Monitor | 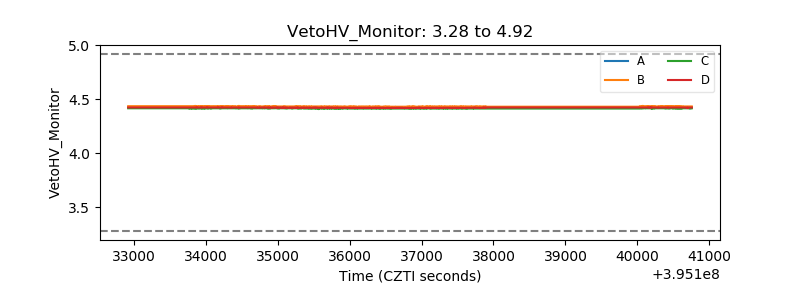 |
| Veto LLD | 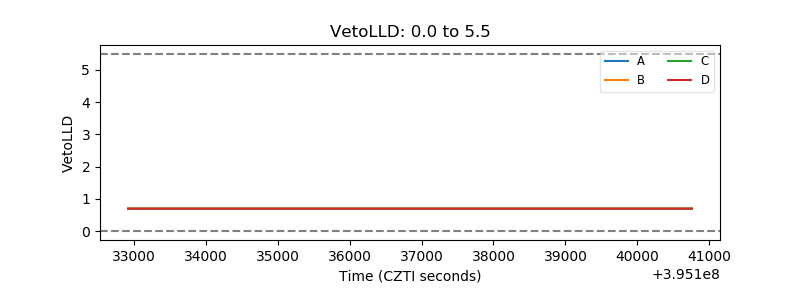 |
| Alpha Counter | 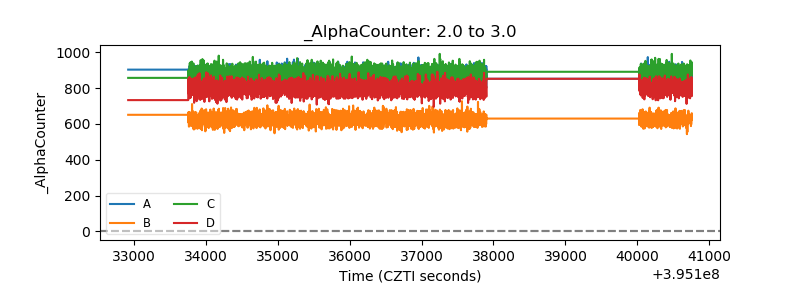 |
| _CPM_Rate | 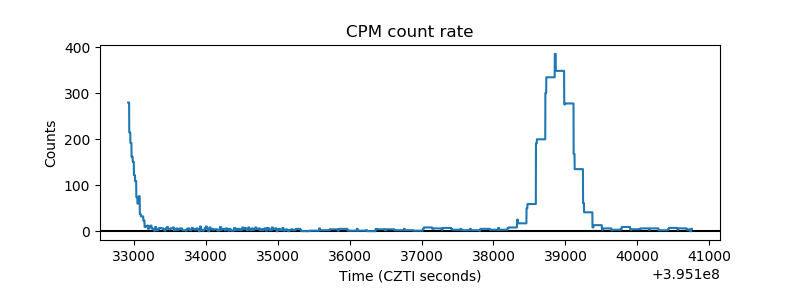 |
| CZT Counter | 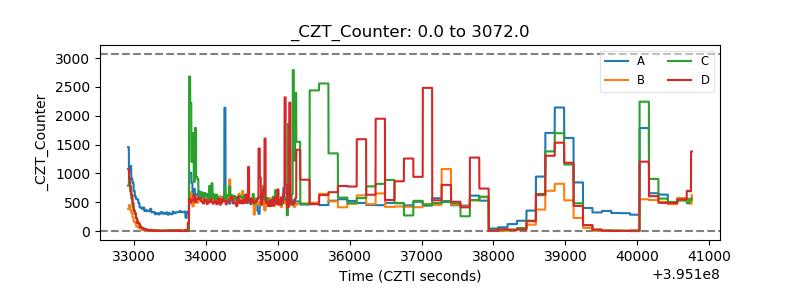 |
| +2.5 Volts monitor |  |
| +5 Volts monitor | 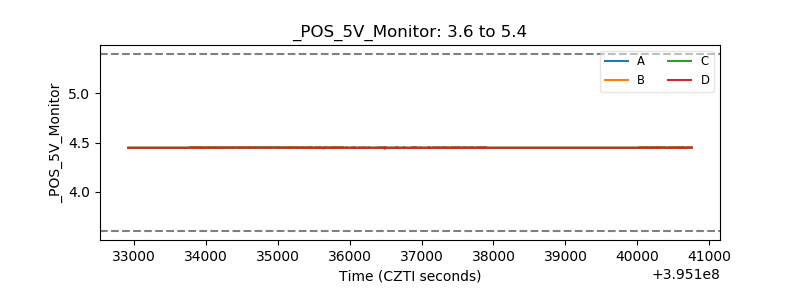 |
| _ROLL_ROT | 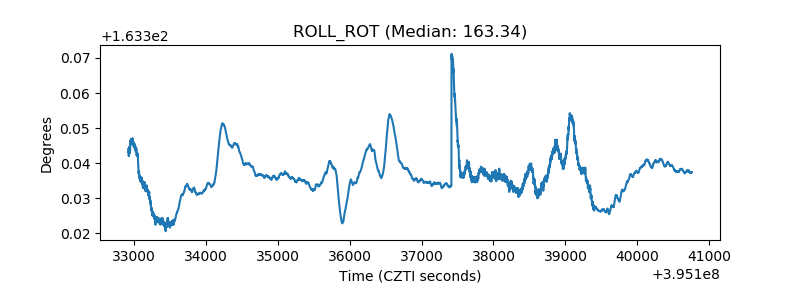 |
| _Roll_DEC | 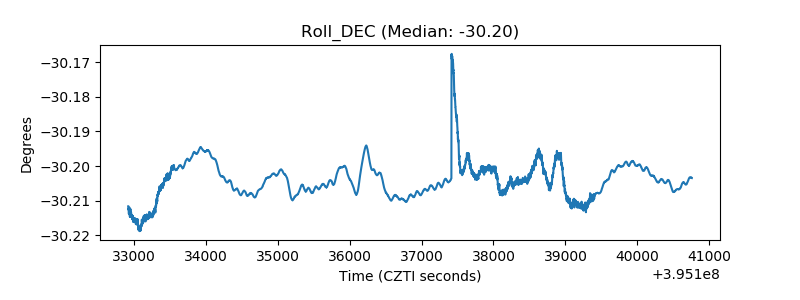 |
| _Roll_RA | 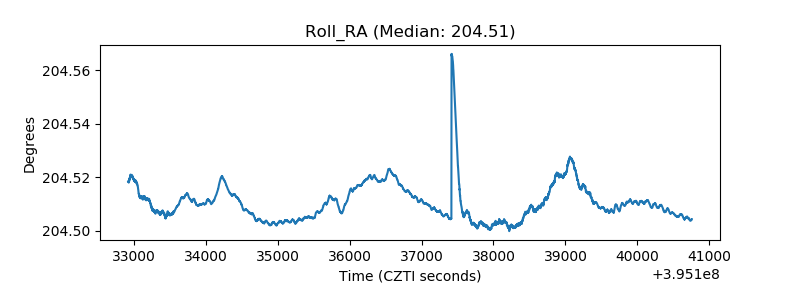 |
| Veto Counter | 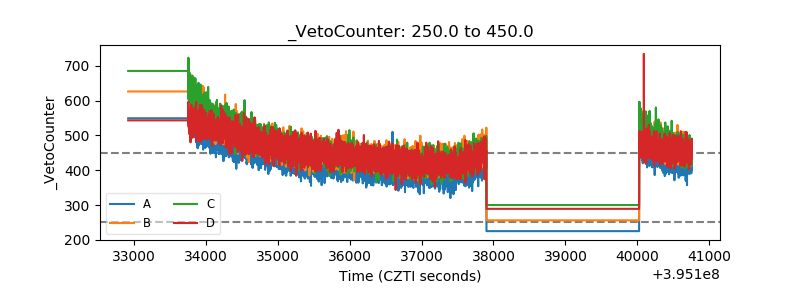 |