| Param | Original file | Final file |
|---|---|---|
| Filename | modeM0/AS1A11_049T05_9000005232_36669cztM0_level2.evt | modeM0/AS1A11_049T05_9000005232_36669cztM0_level2_quad_clean.evt |
| Size (bytes) | 464,215,680 | 86,987,520 |
| Size | 442.7 MB | 83.0 MB |
| Events in quadrant A | 2,686,745 | 594,175 |
| Events in quadrant B | 3,254,973 | 585,258 |
| Events in quadrant C | 3,021,611 | 578,739 |
| Events in quadrant D | 4,746,751 | 515,839 |
| Mode M9 | |||
|---|---|---|---|
| Quadrant | BADHDUFLAG | Total packets | Discarded packets |
| A | 0 | 30 | 0 |
| B | 0 | 30 | 0 |
| C | 0 | 30 | 0 |
| D | 0 | 31 | 0 |
| Mode M0 | |||
|---|---|---|---|
| Quadrant | BADHDUFLAG | Total packets | Discarded packets |
| A | 0 | 11032 | 3 |
| B | 0 | 12694 | 2 |
| C | 0 | 11954 | 2 |
| D | 0 | 17507 | 2 |
| Mode SS | |||
|---|---|---|---|
| Quadrant | BADHDUFLAG | Total packets | Discarded packets |
| A | 0 | 104 | 0 |
| B | 0 | 104 | 0 |
| C | 0 | 104 | 0 |
| D | 0 | 104 | 0 |
| Quadrant | Total seconds | Saturated seconds | Saturation percentage |
|---|---|---|---|
| A | 5138 | 31 | 0.603348% |
| B | 5138 | 177 | 3.444920% |
| C | 5138 | 172 | 3.347606% |
| D | 5138 | 694 | 13.507201% |
Noise dominated data is calculated using 1-second bins in cleaned event files. If a bin has >2000 counts, and if more than 50% of those come from <1% of pixels, then it is considered to be noise-dominated and hence unusable.
| Quadrant | # 1 sec bins | Bins with >0 counts | Bins with >2000 counts | High rate bins dominated by noise | Noise dominated (total time) | Noise dominated (detector-on time) | Marked lightcurve |
|---|---|---|---|---|---|---|---|
| A | 7081 | 5139 | 20 | 20 | 0.28% | 0.39% | 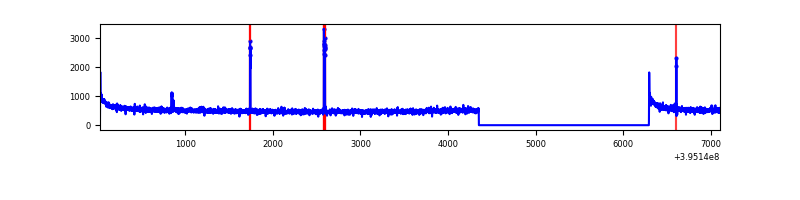 |
| B | 7081 | 5139 | 133 | 133 | 1.88% | 2.59% | 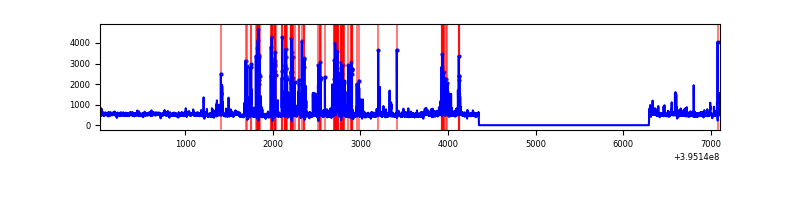 |
| C | 7081 | 5139 | 118 | 118 | 1.67% | 2.30% | 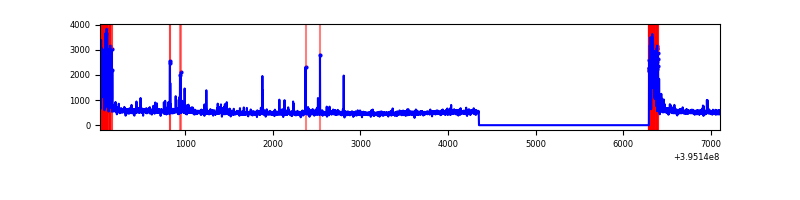 |
| D | 7081 | 5139 | 563 | 563 | 7.95% | 10.96% | 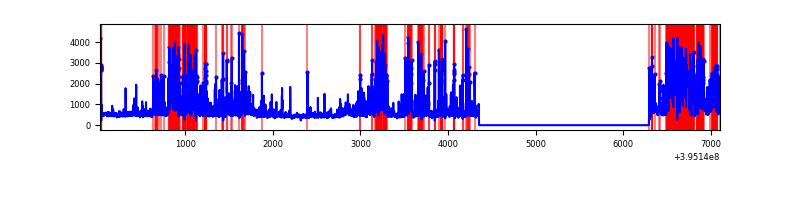 |
Top three noisy pixels from each quadrant. If the there are fewer than three noisy pixels in the level2.evt file, extra rows are filled as -1
| Pixel properties | Quadrant properties | ||||||
|---|---|---|---|---|---|---|---|
| Quadrant | DetID | PixID | Counts | Sigma | Mean | Median | Sigma |
| A | 10 | 83 | 209839 | 1668.4 | 619 | 608 | 125.4 |
| A | 0 | 8 | 58765 | 463.74 | 619 | 608 | 125.4 |
| A | 13 | 6 | 10616 | 79.8 | 619 | 608 | 125.4 |
| B | 5 | 255 | 656721 | 5670.15 | 603 | 587 | 115.7 |
| B | 0 | 189 | 82103 | 704.44 | 603 | 587 | 115.7 |
| B | 0 | 199 | 40519 | 345.08 | 603 | 587 | 115.7 |
| C | 0 | 10 | 484069 | 3558.26 | 586 | 590 | 135.9 |
| C | 15 | 214 | 233970 | 1717.61 | 586 | 590 | 135.9 |
| C | 12 | 249 | 10446 | 72.54 | 586 | 590 | 135.9 |
| D | 2 | 249 | 1102843 | 7982.83 | 563 | 548 | 138.1 |
| D | 12 | 233 | 451808 | 3268.03 | 563 | 548 | 138.1 |
| D | 13 | 249 | 267362 | 1932.27 | 563 | 548 | 138.1 |
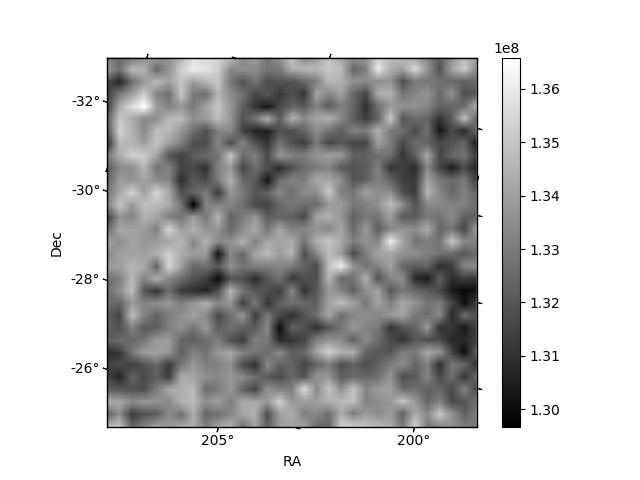
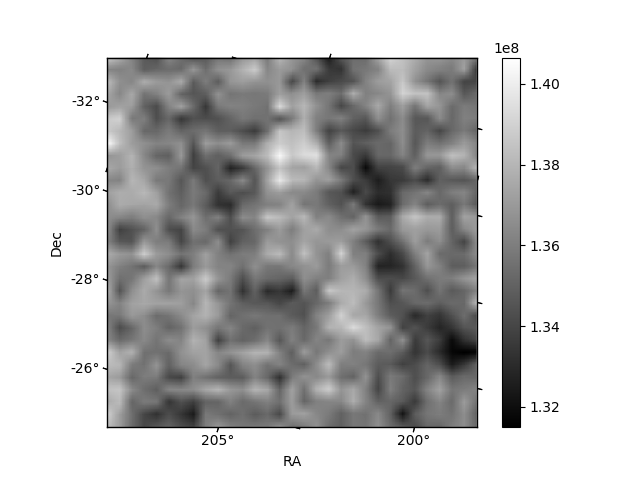
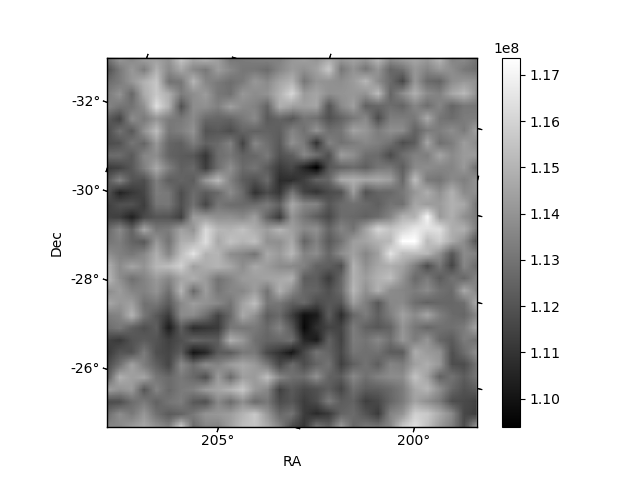
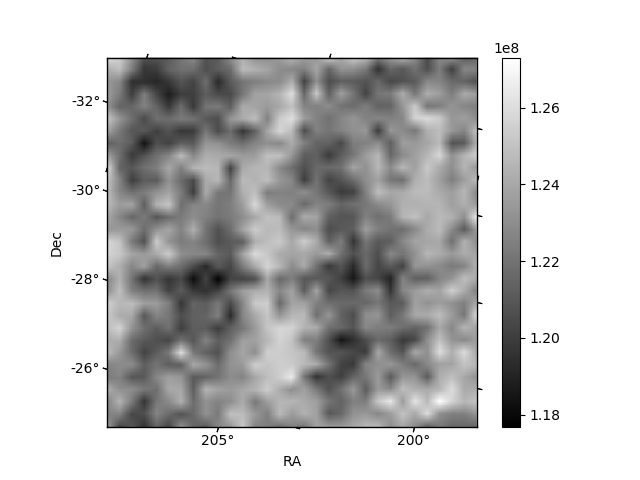
Histogram calculated using DETX and DETY for each event in the final _common_clean file
| Quadrant A | 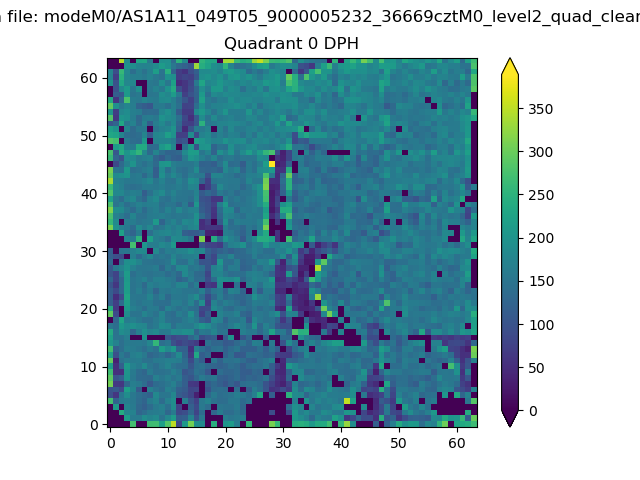 |
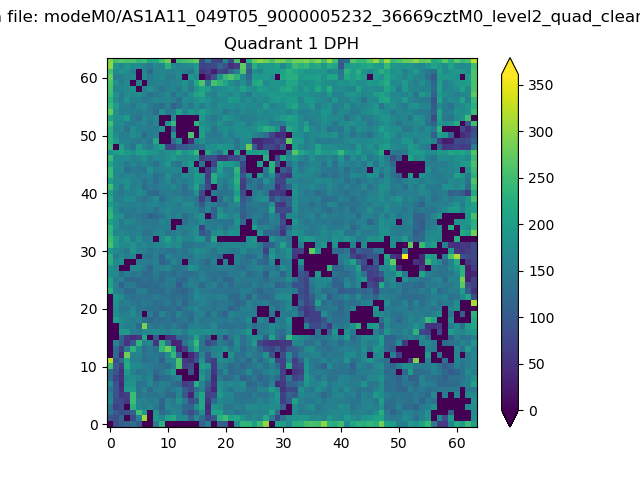 |
Quadrant B |
|---|---|---|---|
| Quadrant D | 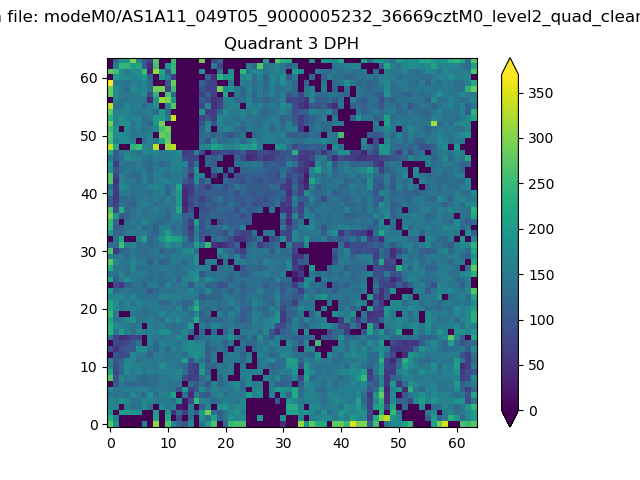 |
 |
Quadrant C |
| Plot type | Count rate plots | Images |
|---|---|---|
| Comparison with Poisson distribution Blue bars denote a histogram of data divided into 1 sec bins. Red curve is a Poisson curve with rate = median count rate of data. |
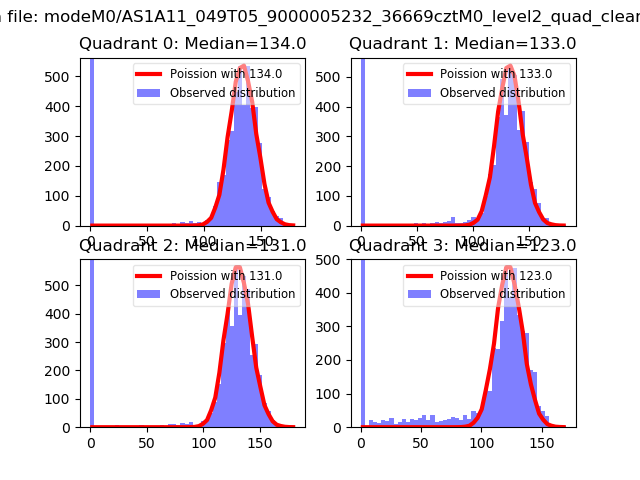 |
 |
| Quadrant-wise count rates Data is divided into 100 sec bins |
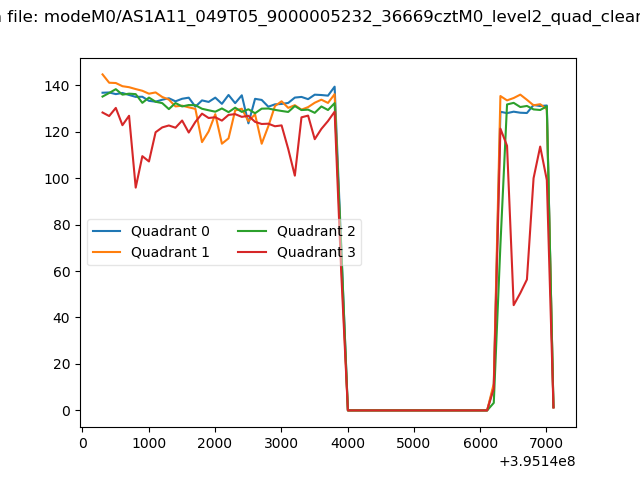 |
|
| Module-wise count rates for Quadrant A Data is divided into 100 sec bins |
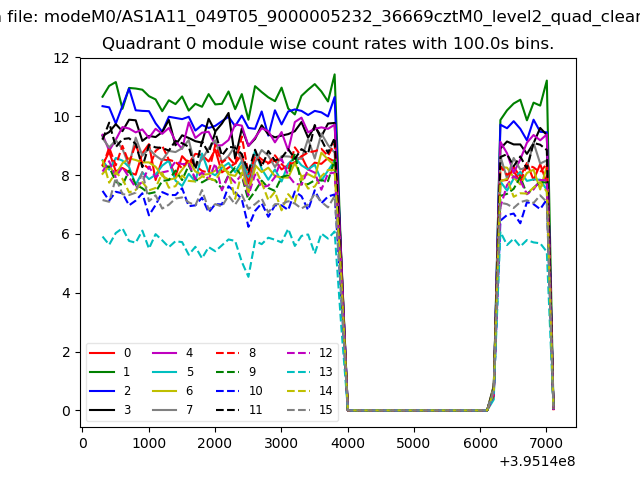 |
 |
| Module-wise count rates for Quadrant B Data is divided into 100 sec bins |
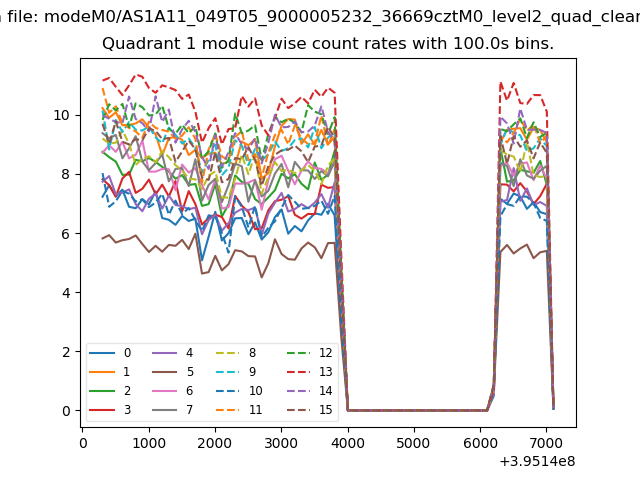 |
 |
| Module-wise count rates for Quadrant C Data is divided into 100 sec bins |
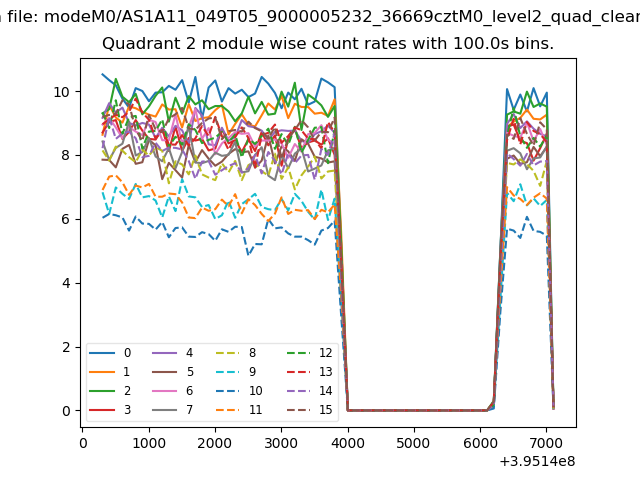 |
 |
| Module-wise count rates for Quadrant D Data is divided into 100 sec bins |
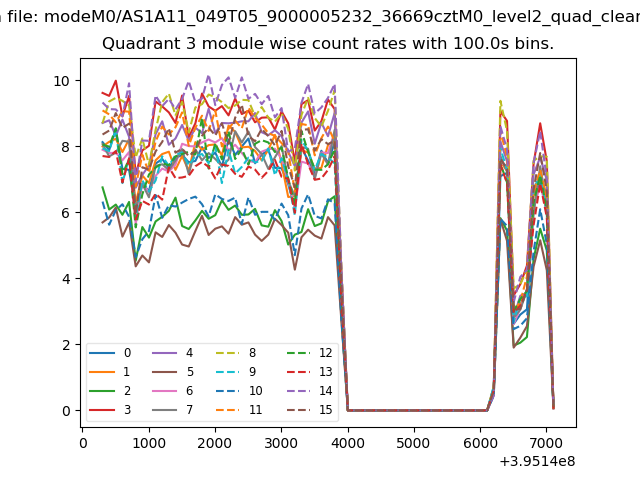 |
 |
| Parameter | Plot |
|---|---|
| CZT HV Monitor | 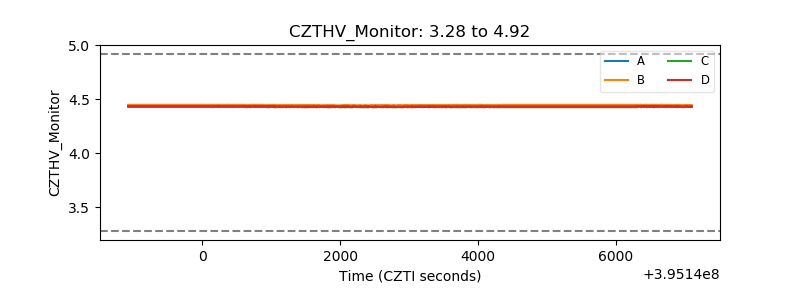 |
| D_VDD | 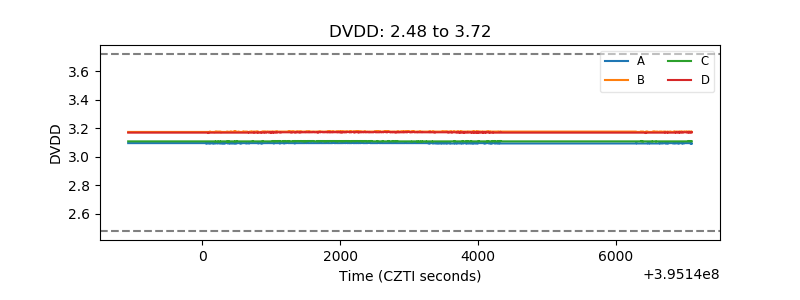 |
| Temperature 1 | 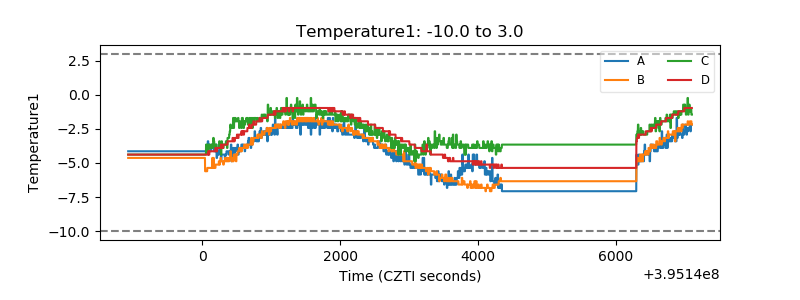 |
| Veto HV Monitor | 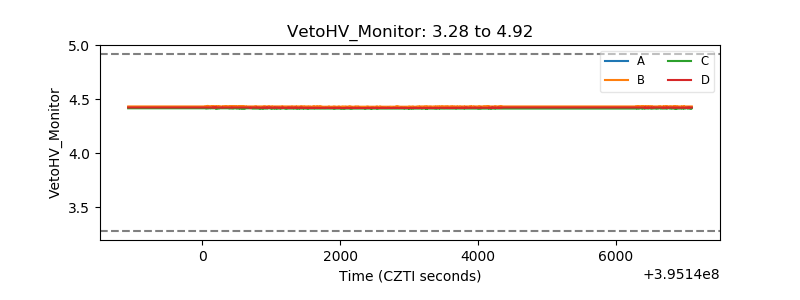 |
| Veto LLD | 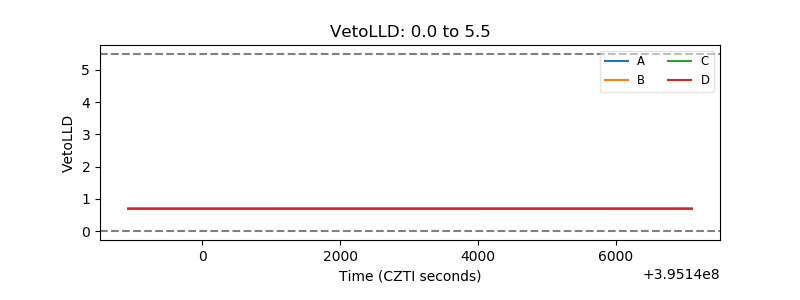 |
| Alpha Counter | 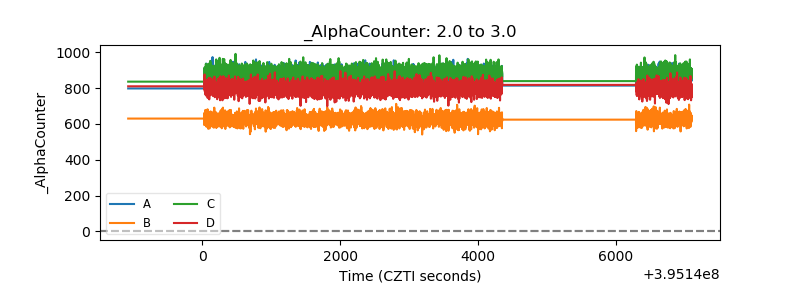 |
| _CPM_Rate | 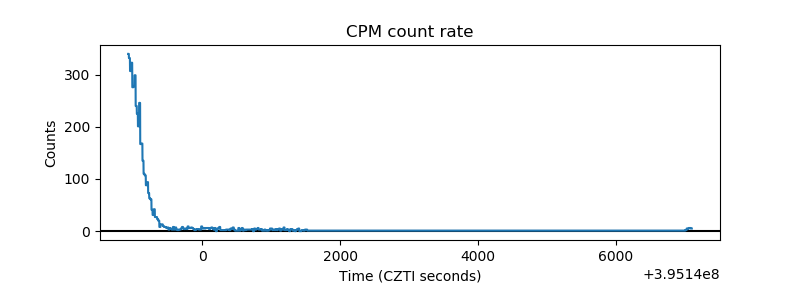 |
| CZT Counter |  |
| +2.5 Volts monitor |  |
| +5 Volts monitor |  |
| _ROLL_ROT |  |
| _Roll_DEC | 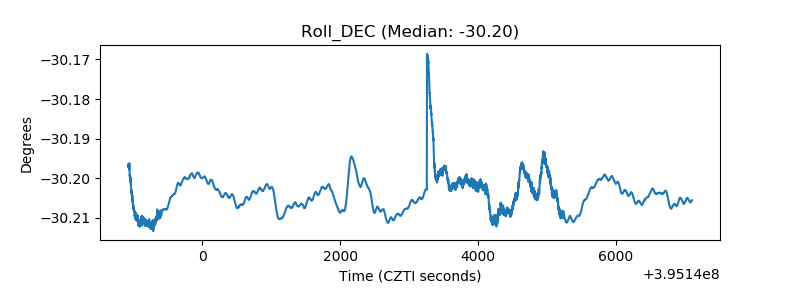 |
| _Roll_RA |  |
| Veto Counter |  |