| Param | Original file | Final file |
|---|---|---|
| Filename | modeM0/AS1A11_049T05_9000005232_36670cztM0_level2.evt | modeM0/AS1A11_049T05_9000005232_36670cztM0_level2_quad_clean.evt |
| Size (bytes) | 455,287,680 | 85,536,000 |
| Size | 434.2 MB | 81.6 MB |
| Events in quadrant A | 2,799,222 | 572,512 |
| Events in quadrant B | 3,202,925 | 567,661 |
| Events in quadrant C | 3,066,240 | 551,960 |
| Events in quadrant D | 4,339,383 | 506,038 |
| Mode M9 | |||
|---|---|---|---|
| Quadrant | BADHDUFLAG | Total packets | Discarded packets |
| A | 0 | 29 | 0 |
| B | 0 | 29 | 0 |
| C | 0 | 29 | 0 |
| D | 0 | 30 | 0 |
| Mode M0 | |||
|---|---|---|---|
| Quadrant | BADHDUFLAG | Total packets | Discarded packets |
| A | 0 | 11780 | 3 |
| B | 0 | 12919 | 2 |
| C | 0 | 12447 | 2 |
| D | 0 | 16676 | 2 |
| Mode SS | |||
|---|---|---|---|
| Quadrant | BADHDUFLAG | Total packets | Discarded packets |
| A | 0 | 114 | 0 |
| B | 0 | 114 | 0 |
| C | 0 | 114 | 0 |
| D | 0 | 114 | 0 |
| Quadrant | Total seconds | Saturated seconds | Saturation percentage |
|---|---|---|---|
| A | 5602 | 9 | 0.160657% |
| B | 5602 | 63 | 1.124598% |
| C | 5602 | 139 | 2.481257% |
| D | 5602 | 516 | 9.210996% |
Noise dominated data is calculated using 1-second bins in cleaned event files. If a bin has >2000 counts, and if more than 50% of those come from <1% of pixels, then it is considered to be noise-dominated and hence unusable.
| Quadrant | # 1 sec bins | Bins with >0 counts | Bins with >2000 counts | High rate bins dominated by noise | Noise dominated (total time) | Noise dominated (detector-on time) | Marked lightcurve |
|---|---|---|---|---|---|---|---|
| A | 7214 | 5603 | 2 | 2 | 0.03% | 0.04% | 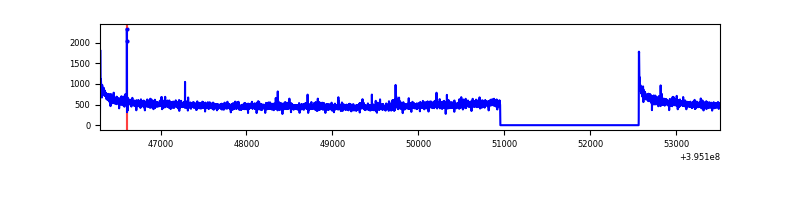 |
| B | 7214 | 5603 | 46 | 46 | 0.64% | 0.82% | 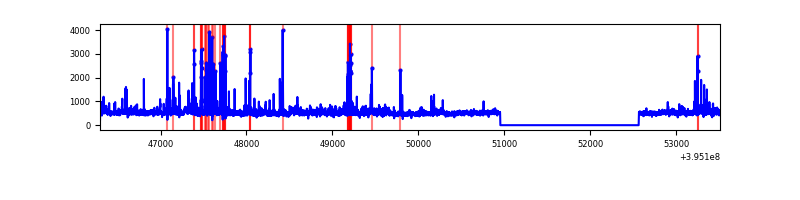 |
| C | 7214 | 5603 | 94 | 94 | 1.30% | 1.68% | 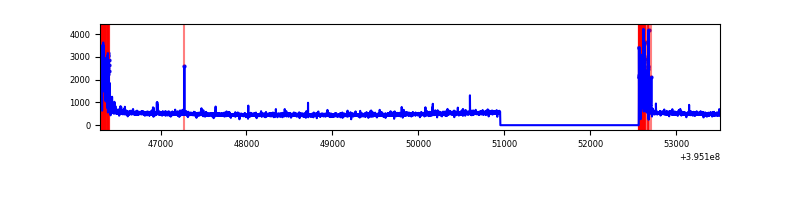 |
| D | 7214 | 5603 | 433 | 433 | 6.00% | 7.73% | 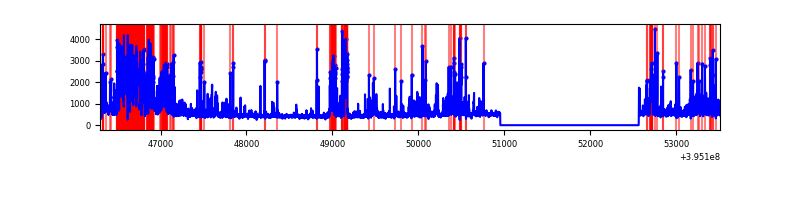 |
Top three noisy pixels from each quadrant. If the there are fewer than three noisy pixels in the level2.evt file, extra rows are filled as -1
| Pixel properties | Quadrant properties | ||||||
|---|---|---|---|---|---|---|---|
| Quadrant | DetID | PixID | Counts | Sigma | Mean | Median | Sigma |
| A | 10 | 83 | 216308 | 1617.62 | 661 | 649 | 133.3 |
| A | 9 | 143 | 11317 | 80.02 | 661 | 649 | 133.3 |
| A | 13 | 254 | 9265 | 64.63 | 661 | 649 | 133.3 |
| B | 5 | 255 | 297227 | 2385.58 | 648 | 631 | 124.3 |
| B | 0 | 189 | 137290 | 1099.17 | 648 | 631 | 124.3 |
| B | 0 | 199 | 112400 | 898.98 | 648 | 631 | 124.3 |
| C | 0 | 10 | 363149 | 2486.26 | 625 | 630 | 145.8 |
| C | 15 | 214 | 251152 | 1718.15 | 625 | 630 | 145.8 |
| C | 14 | 254 | 7090 | 44.3 | 625 | 630 | 145.8 |
| D | 2 | 249 | 907547 | 6082.71 | 609 | 592 | 149.1 |
| D | 13 | 249 | 245790 | 1644.48 | 609 | 592 | 149.1 |
| D | 7 | 55 | 218743 | 1463.08 | 609 | 592 | 149.1 |
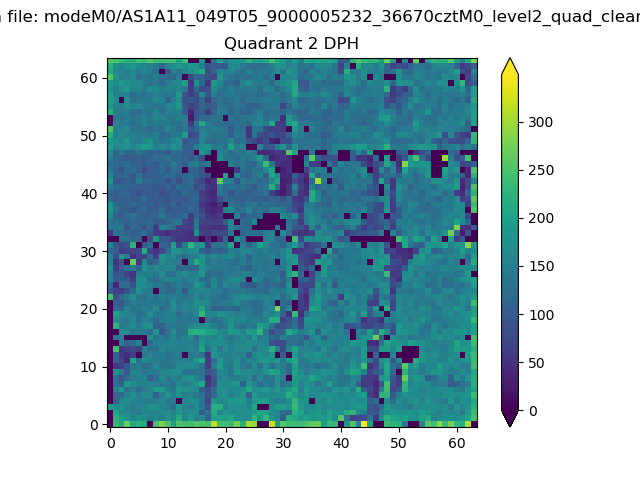
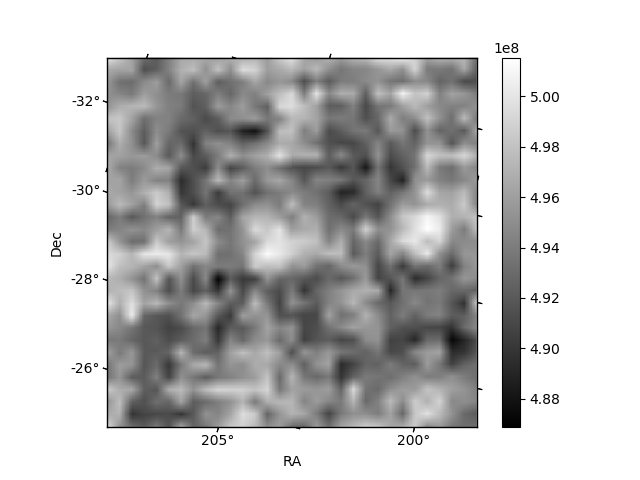
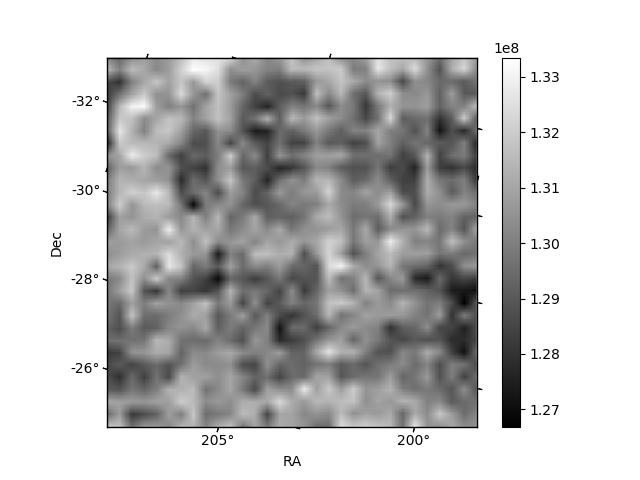
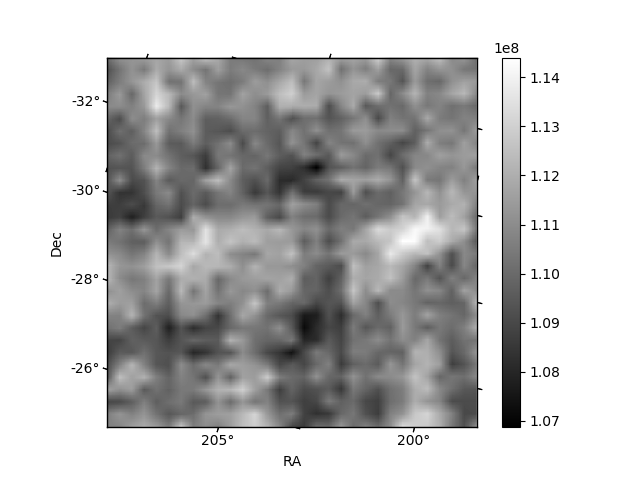
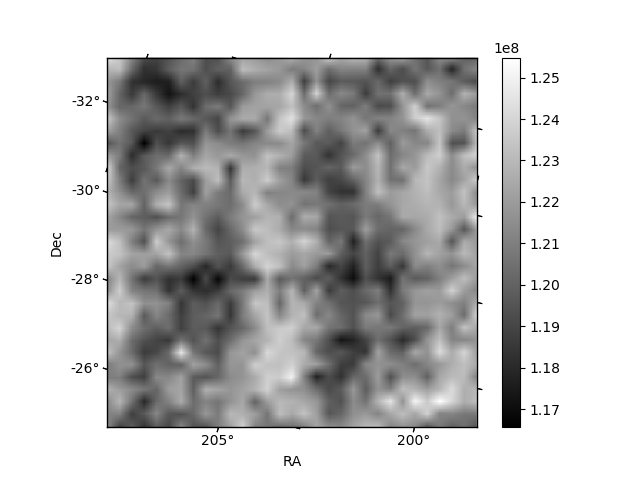
Histogram calculated using DETX and DETY for each event in the final _common_clean file
| Quadrant A | 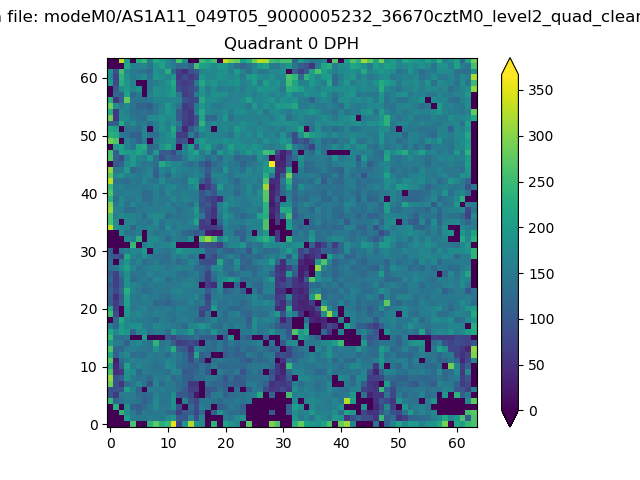 |
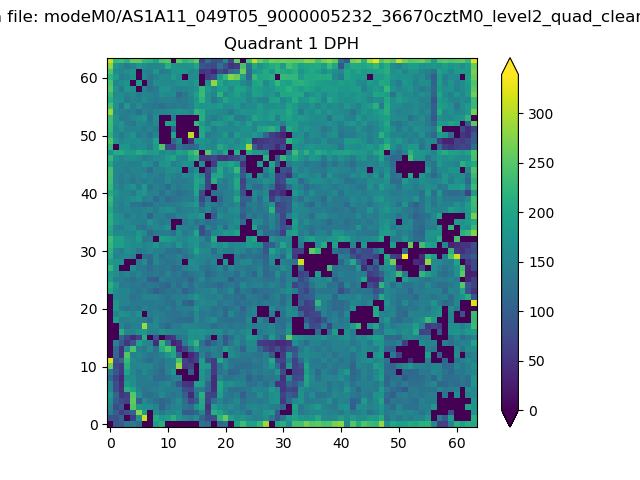 |
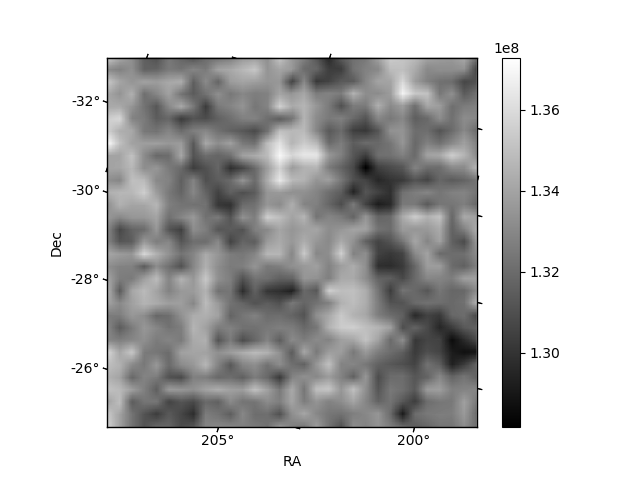
Quadrant B |
|---|---|---|---|
| Quadrant D | 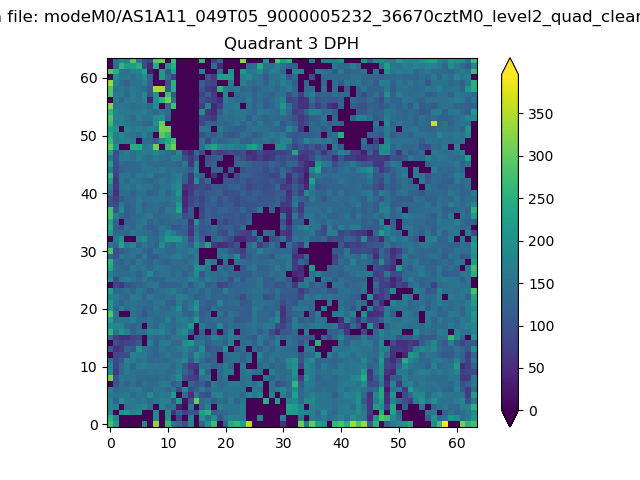 |
 |
Quadrant C |
| Plot type | Count rate plots | Images |
|---|---|---|
| Comparison with Poisson distribution Blue bars denote a histogram of data divided into 1 sec bins. Red curve is a Poisson curve with rate = median count rate of data. |
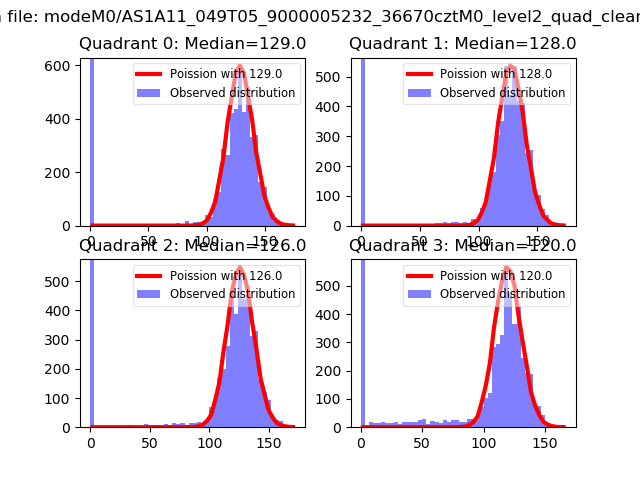 |
 |
| Quadrant-wise count rates Data is divided into 100 sec bins |
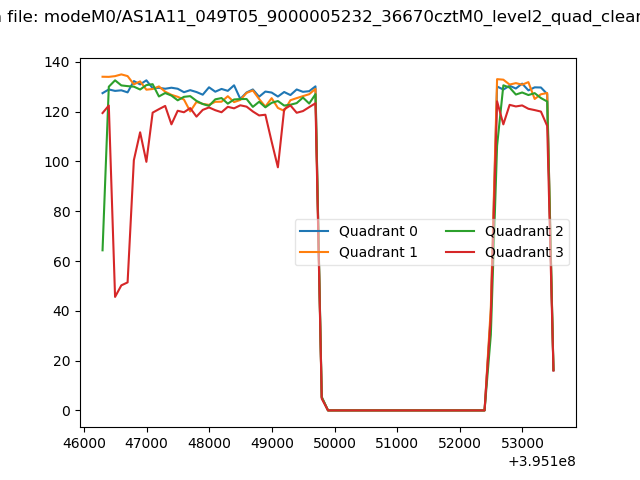 |
|
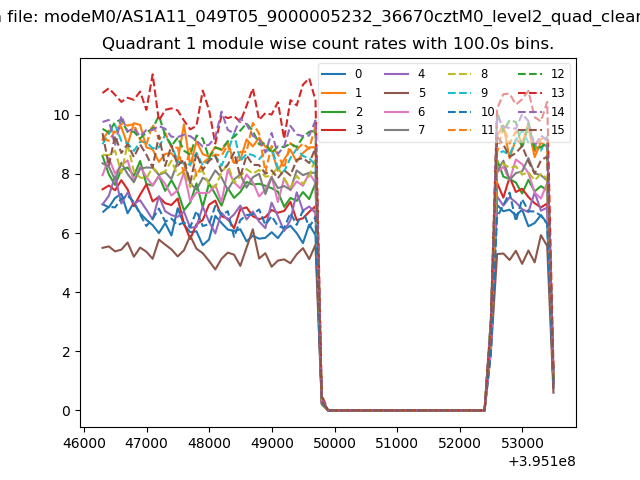
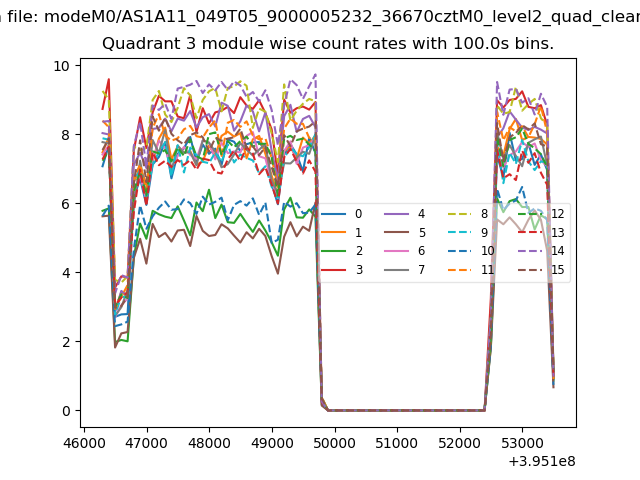
| Module-wise count rates for Quadrant A Data is divided into 100 sec bins |
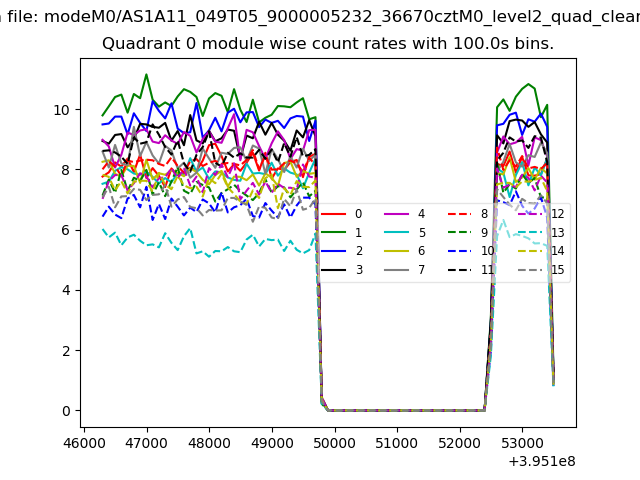 |
 |
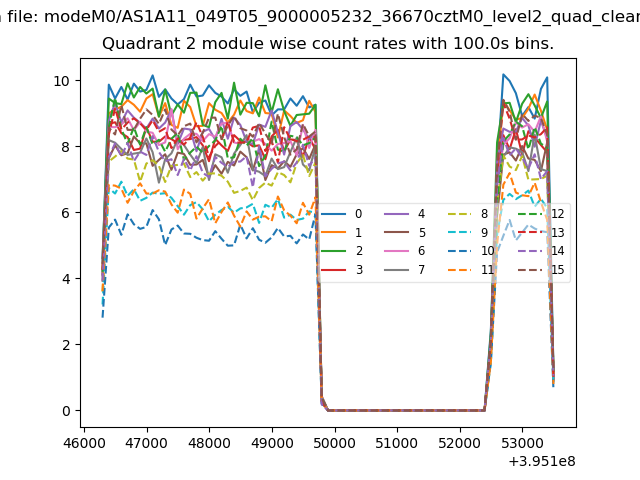
| Module-wise count rates for Quadrant B Data is divided into 100 sec bins |
 |
 |
| Module-wise count rates for Quadrant C Data is divided into 100 sec bins |
 |
 |
| Module-wise count rates for Quadrant D Data is divided into 100 sec bins |
 |
 |
| Parameter | Plot |
|---|---|
| CZT HV Monitor | 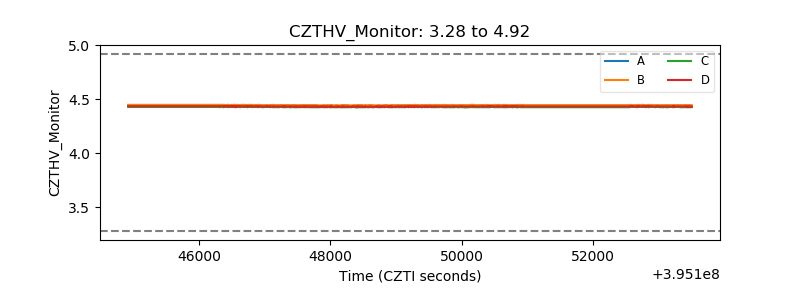 |
| D_VDD | 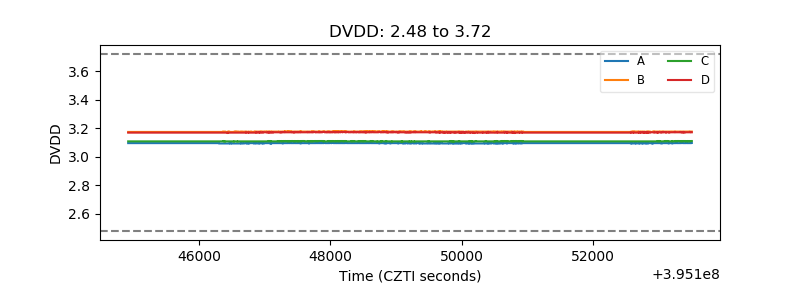 |
| Temperature 1 |  |
| Veto HV Monitor | 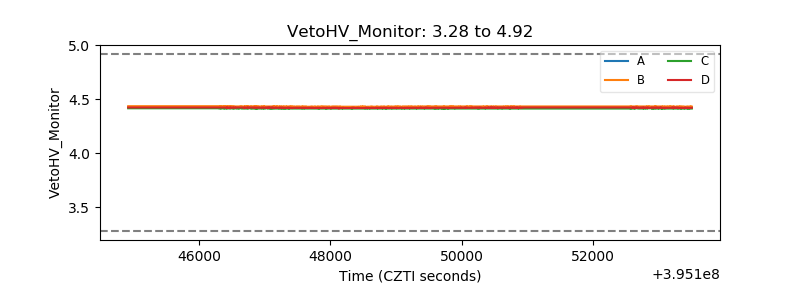 |
| Veto LLD | 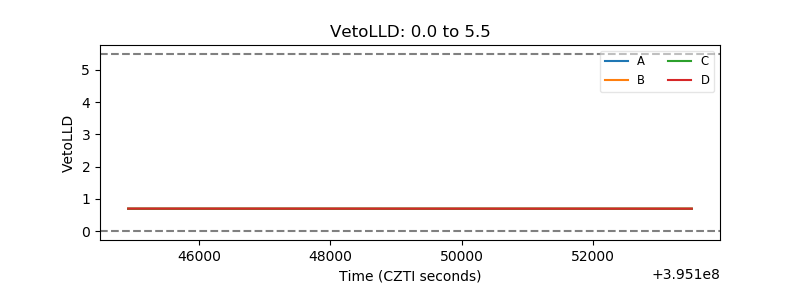 |
| Alpha Counter | 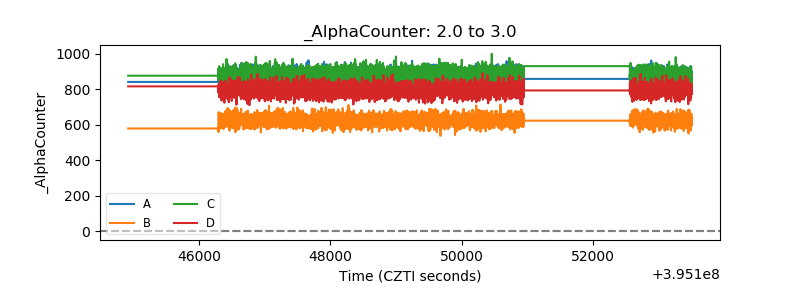 |
| _CPM_Rate | 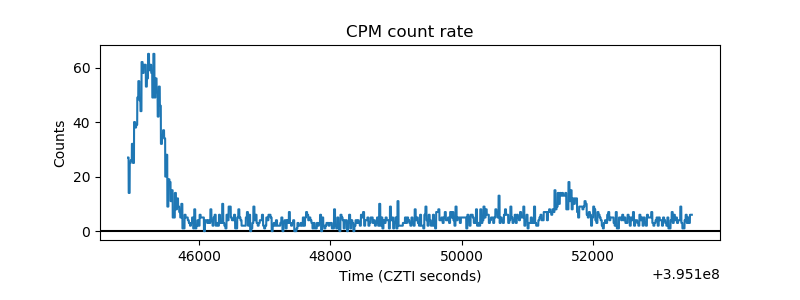 |
| CZT Counter | 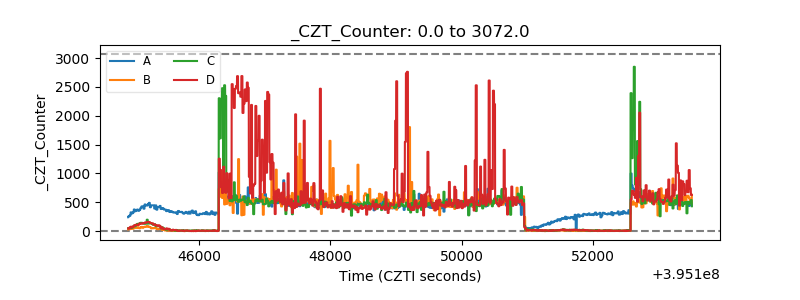 |
| +2.5 Volts monitor |  |
| +5 Volts monitor |  |
| _ROLL_ROT | 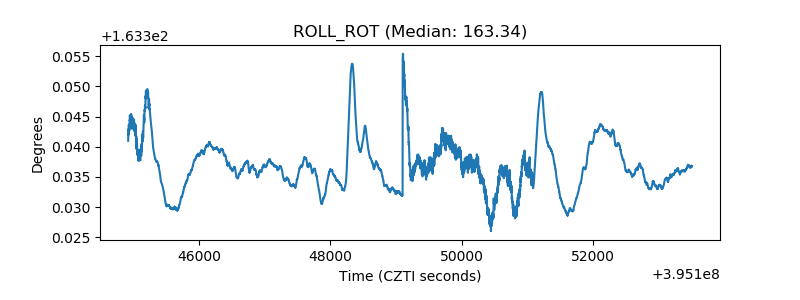 |
| _Roll_DEC | 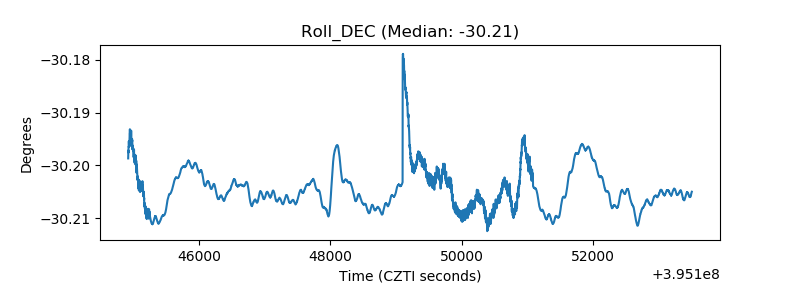 |
| _Roll_RA | 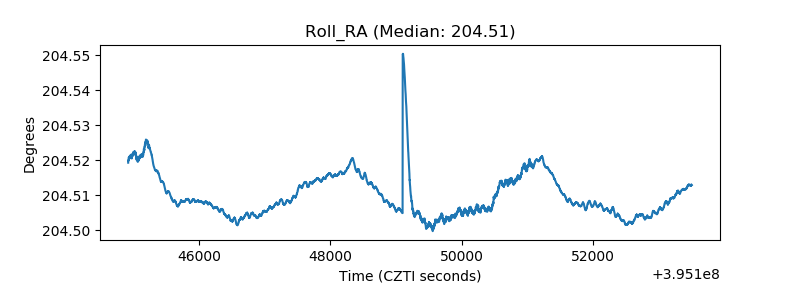 |
| Veto Counter | 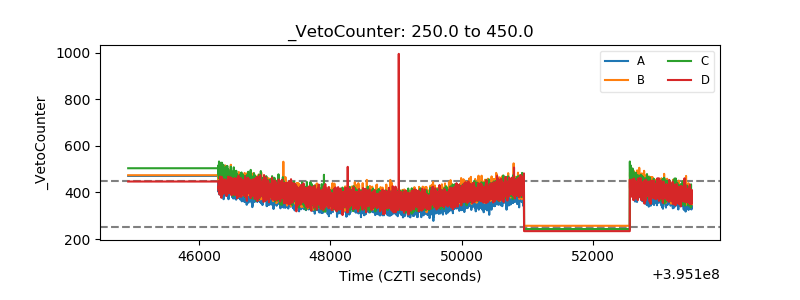 |