| Param | Original file | Final file |
|---|---|---|
| Filename | modeM0/AS1A11_049T05_9000005232_36672cztM0_level2.evt | modeM0/AS1A11_049T05_9000005232_36672cztM0_level2_quad_clean.evt |
| Size (bytes) | 479,554,560 | 71,323,200 |
| Size | 457.3 MB | 68.0 MB |
| Events in quadrant A | 2,883,052 | 453,857 |
| Events in quadrant B | 3,313,991 | 445,583 |
| Events in quadrant C | 3,484,814 | 436,800 |
| Events in quadrant D | 4,447,135 | 417,055 |
| Mode M9 | |||
|---|---|---|---|
| Quadrant | BADHDUFLAG | Total packets | Discarded packets |
| A | 0 | 14 | 0 |
| B | 0 | 14 | 0 |
| C | 0 | 14 | 0 |
| D | 0 | 15 | 0 |
| Mode M0 | |||
|---|---|---|---|
| Quadrant | BADHDUFLAG | Total packets | Discarded packets |
| A | 0 | 12217 | 3 |
| B | 0 | 13550 | 2 |
| C | 0 | 14038 | 2 |
| D | 0 | 17121 | 2 |
| Mode SS | |||
|---|---|---|---|
| Quadrant | BADHDUFLAG | Total packets | Discarded packets |
| A | 0 | 118 | 0 |
| B | 0 | 118 | 0 |
| C | 0 | 118 | 0 |
| D | 0 | 118 | 0 |
| Quadrant | Total seconds | Saturated seconds | Saturation percentage |
|---|---|---|---|
| A | 5814 | 15 | 0.257998% |
| B | 5814 | 118 | 2.029584% |
| C | 5814 | 224 | 3.852769% |
| D | 5814 | 266 | 4.575163% |
Noise dominated data is calculated using 1-second bins in cleaned event files. If a bin has >2000 counts, and if more than 50% of those come from <1% of pixels, then it is considered to be noise-dominated and hence unusable.
| Quadrant | # 1 sec bins | Bins with >0 counts | Bins with >2000 counts | High rate bins dominated by noise | Noise dominated (total time) | Noise dominated (detector-on time) | Marked lightcurve |
|---|---|---|---|---|---|---|---|
| A | 7127 | 5815 | 4 | 4 | 0.06% | 0.07% | 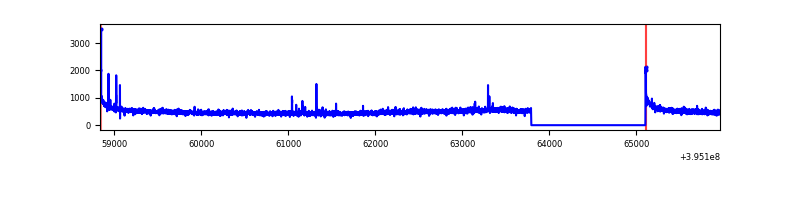 |
| B | 7127 | 5815 | 65 | 65 | 0.91% | 1.12% | 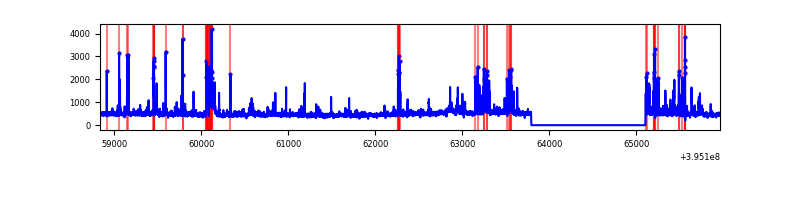 |
| C | 7127 | 5815 | 163 | 163 | 2.29% | 2.80% | 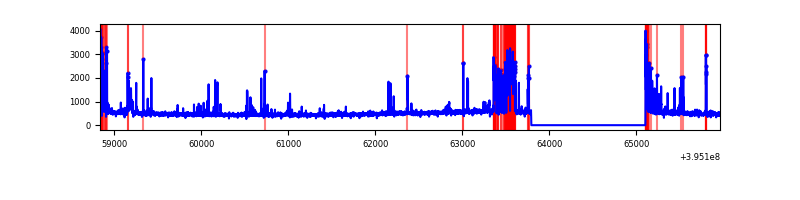 |
| D | 7127 | 5815 | 238 | 238 | 3.34% | 4.09% | 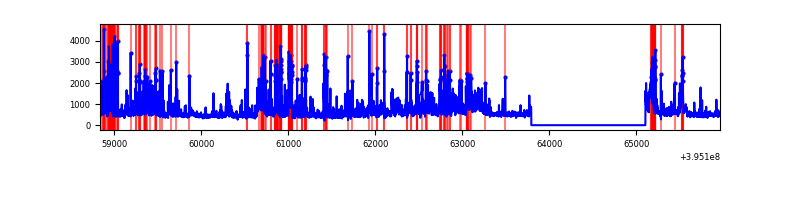 |
Top three noisy pixels from each quadrant. If the there are fewer than three noisy pixels in the level2.evt file, extra rows are filled as -1
| Pixel properties | Quadrant properties | ||||||
|---|---|---|---|---|---|---|---|
| Quadrant | DetID | PixID | Counts | Sigma | Mean | Median | Sigma |
| A | 10 | 83 | 228303 | 1647.7 | 675 | 662 | 138.2 |
| A | 9 | 143 | 24588 | 173.18 | 675 | 662 | 138.2 |
| A | 13 | 6 | 19729 | 138.01 | 675 | 662 | 138.2 |
| B | 5 | 255 | 300404 | 2338.1 | 664 | 646 | 128.2 |
| B | 5 | 200 | 108960 | 844.85 | 664 | 646 | 128.2 |
| B | 0 | 189 | 83928 | 649.6 | 664 | 646 | 128.2 |
| C | 0 | 207 | 336800 | 2255.82 | 640 | 643 | 149.0 |
| C | 15 | 214 | 265352 | 1776.36 | 640 | 643 | 149.0 |
| C | 0 | 10 | 198648 | 1328.74 | 640 | 643 | 149.0 |
| D | 7 | 223 | 559329 | 3550.49 | 642 | 622 | 157.4 |
| D | 2 | 249 | 268557 | 1702.68 | 642 | 622 | 157.4 |
| D | 12 | 227 | 211738 | 1341.61 | 642 | 622 | 157.4 |
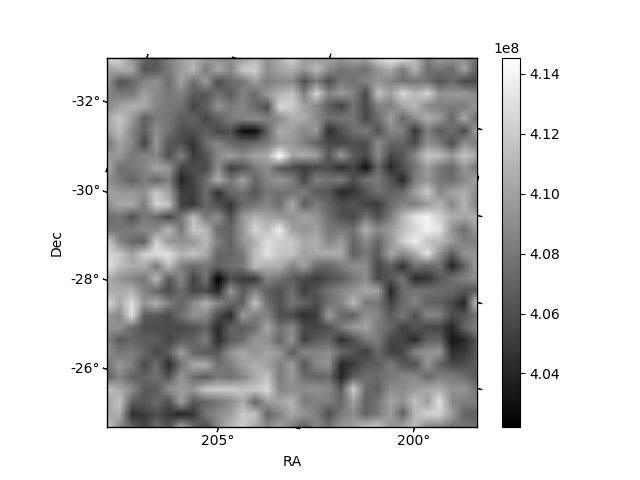
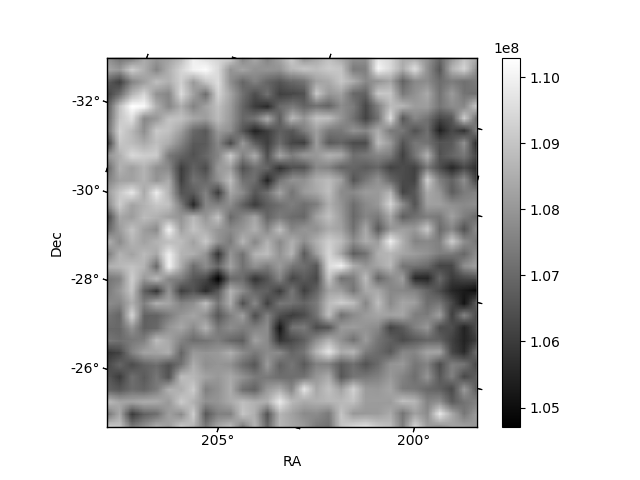
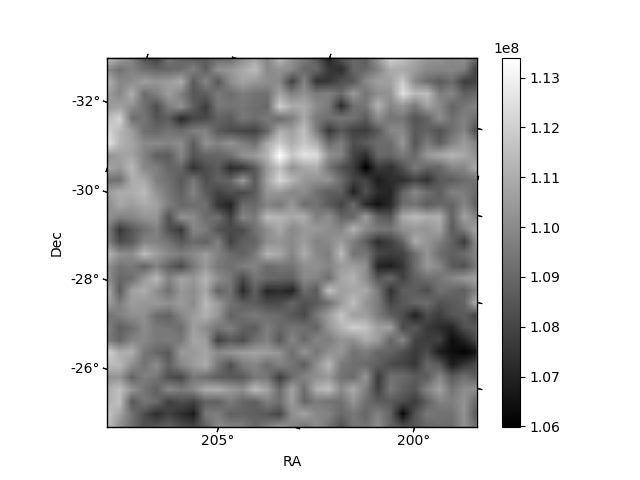
Histogram calculated using DETX and DETY for each event in the final _common_clean file
| Quadrant A |  |
 |
Quadrant B |
|---|---|---|---|
| Quadrant D |  |
 |
Quadrant C |
| Plot type | Count rate plots | Images |
|---|---|---|
| Comparison with Poisson distribution Blue bars denote a histogram of data divided into 1 sec bins. Red curve is a Poisson curve with rate = median count rate of data. |
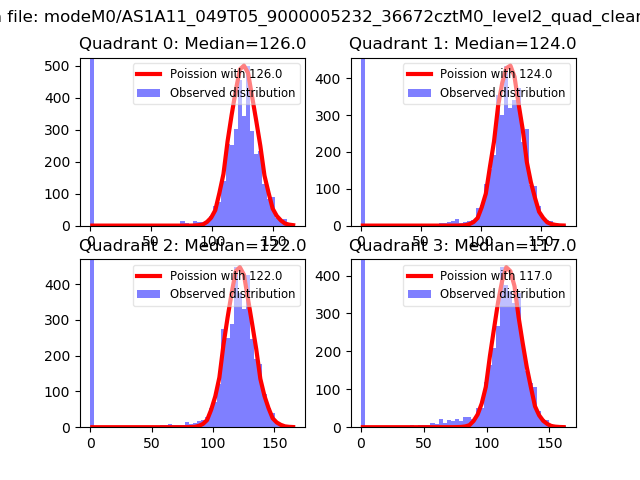 |
 |
| Quadrant-wise count rates Data is divided into 100 sec bins |
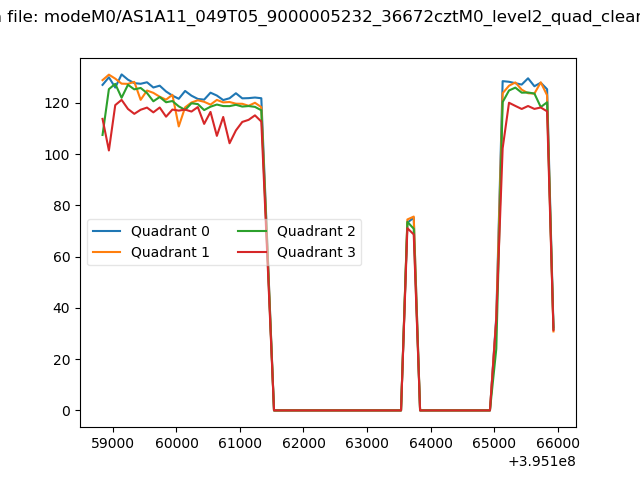 |
|
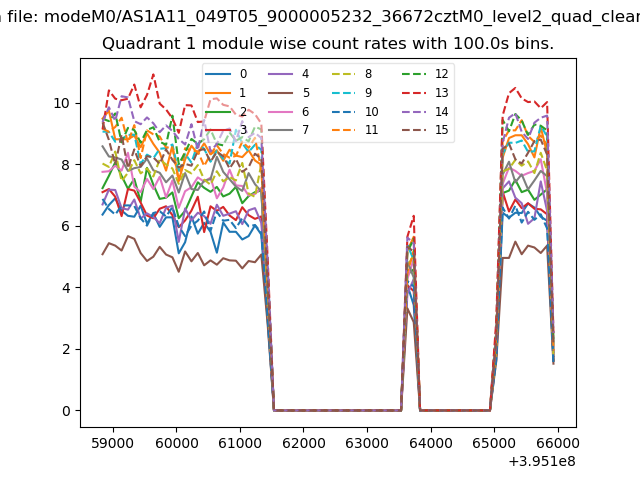
| Module-wise count rates for Quadrant A Data is divided into 100 sec bins |
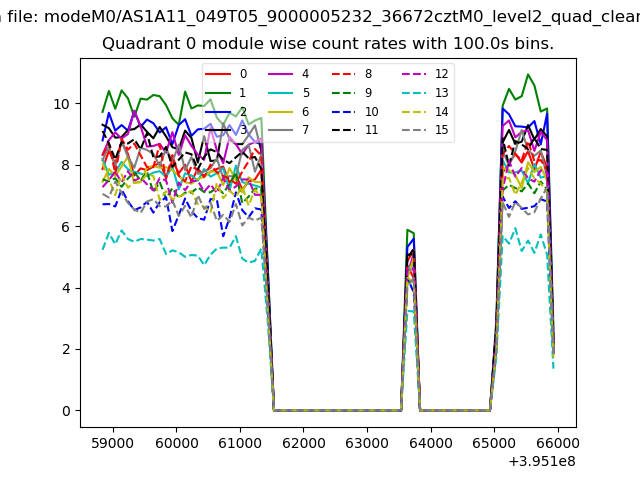 |
 |
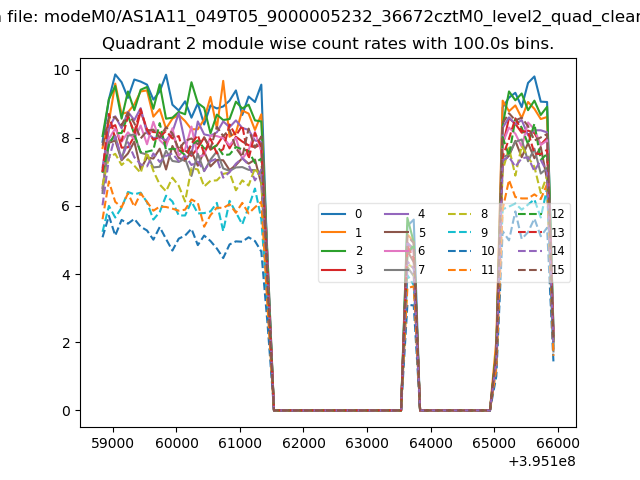
| Module-wise count rates for Quadrant B Data is divided into 100 sec bins |
 |
 |
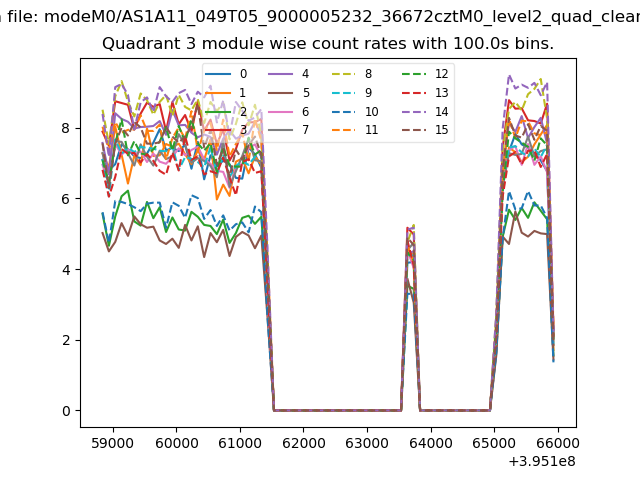
| Module-wise count rates for Quadrant C Data is divided into 100 sec bins |
 |
 |
| Module-wise count rates for Quadrant D Data is divided into 100 sec bins |
 |
 |
| Parameter | Plot |
|---|---|
| CZT HV Monitor | 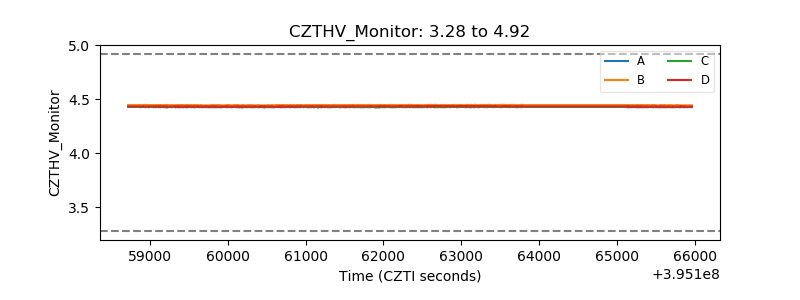 |
| D_VDD |  |
| Temperature 1 | 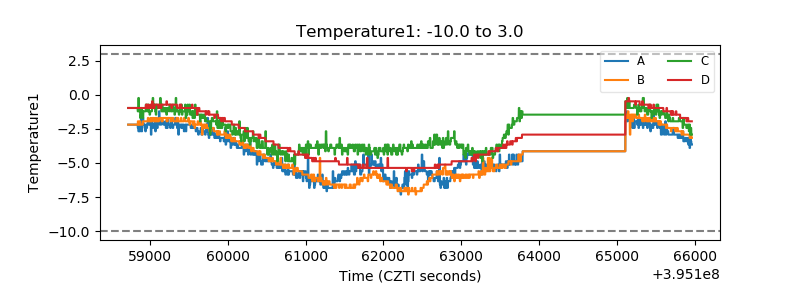 |
| Veto HV Monitor |  |
| Veto LLD | 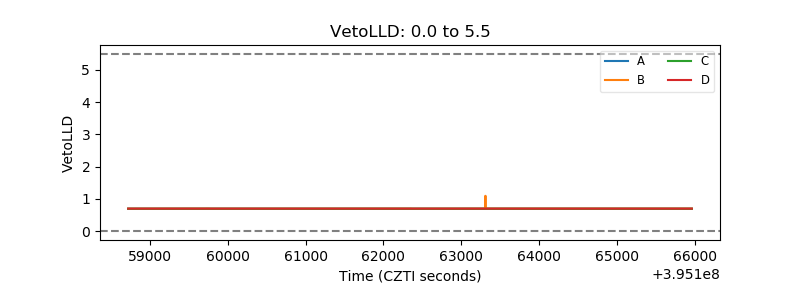 |
| Alpha Counter | 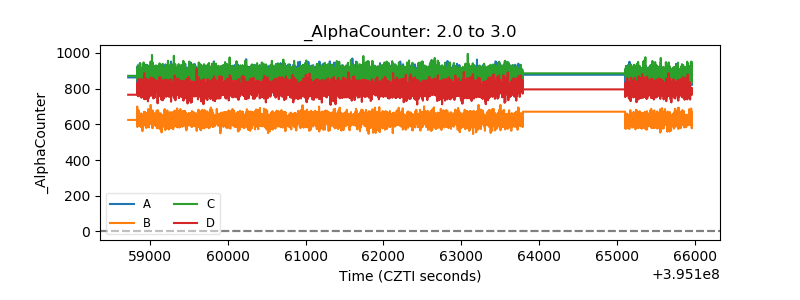 |
| _CPM_Rate |  |
| CZT Counter | 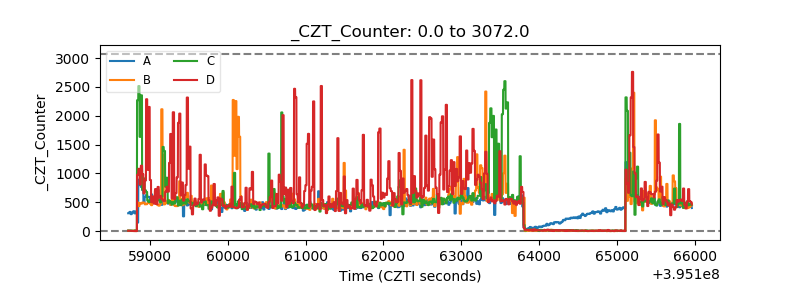 |
| +2.5 Volts monitor |  |
| +5 Volts monitor | 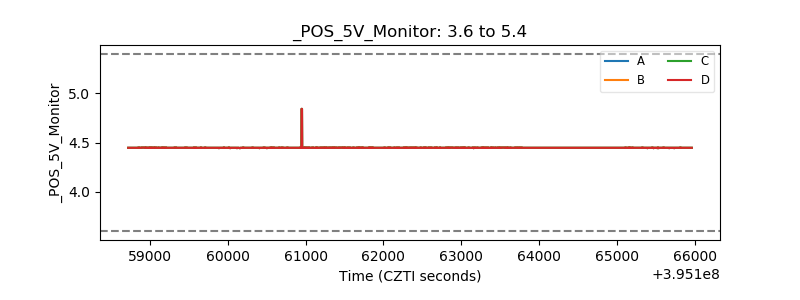 |
| _ROLL_ROT | 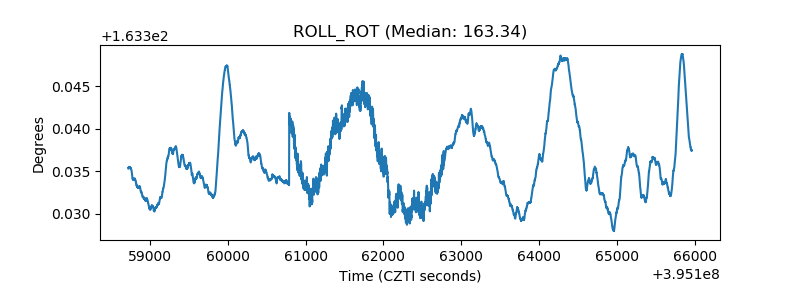 |
| _Roll_DEC |  |
| _Roll_RA | 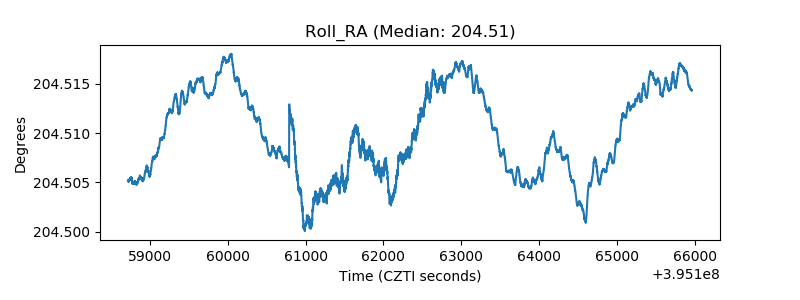 |
| Veto Counter | 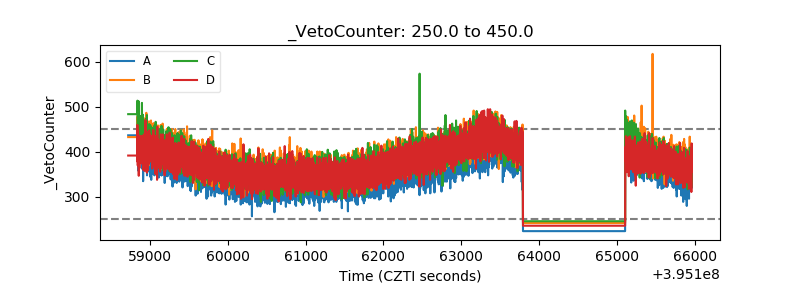 |