| Param | Original file | Final file |
|---|---|---|
| Filename | modeM0/AS1A11_049T05_9000005232_36674cztM0_level2.evt | modeM0/AS1A11_049T05_9000005232_36674cztM0_level2_quad_clean.evt |
| Size (bytes) | 444,792,960 | 70,629,120 |
| Size | 424.2 MB | 67.4 MB |
| Events in quadrant A | 2,855,968 | 448,196 |
| Events in quadrant B | 3,155,996 | 441,981 |
| Events in quadrant C | 3,286,070 | 429,410 |
| Events in quadrant D | 3,780,701 | 415,580 |
| Mode M9 | |||
|---|---|---|---|
| Quadrant | BADHDUFLAG | Total packets | Discarded packets |
| A | 0 | 18 | 0 |
| B | 0 | 18 | 0 |
| C | 0 | 18 | 0 |
| D | 0 | 19 | 0 |
| Mode M0 | |||
|---|---|---|---|
| Quadrant | BADHDUFLAG | Total packets | Discarded packets |
| A | 0 | 12145 | 2 |
| B | 0 | 13066 | 2 |
| C | 0 | 13446 | 2 |
| D | 0 | 15054 | 2 |
| Mode SS | |||
|---|---|---|---|
| Quadrant | BADHDUFLAG | Total packets | Discarded packets |
| A | 0 | 118 | 0 |
| B | 0 | 118 | 0 |
| C | 0 | 118 | 0 |
| D | 0 | 118 | 0 |
| Quadrant | Total seconds | Saturated seconds | Saturation percentage |
|---|---|---|---|
| A | 5769 | 16 | 0.277344% |
| B | 5769 | 70 | 1.213382% |
| C | 5769 | 96 | 1.664067% |
| D | 5769 | 139 | 2.409430% |
Noise dominated data is calculated using 1-second bins in cleaned event files. If a bin has >2000 counts, and if more than 50% of those come from <1% of pixels, then it is considered to be noise-dominated and hence unusable.
| Quadrant | # 1 sec bins | Bins with >0 counts | Bins with >2000 counts | High rate bins dominated by noise | Noise dominated (total time) | Noise dominated (detector-on time) | Marked lightcurve |
|---|---|---|---|---|---|---|---|
| A | 7113 | 5770 | 7 | 7 | 0.10% | 0.12% | 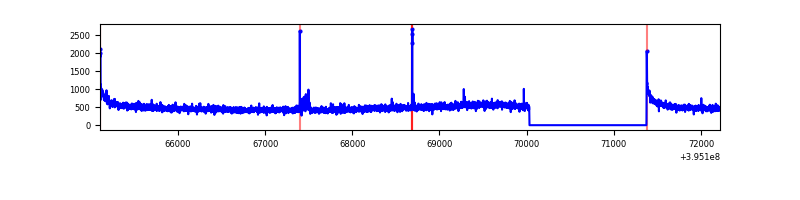 |
| B | 7113 | 5770 | 40 | 40 | 0.56% | 0.69% | 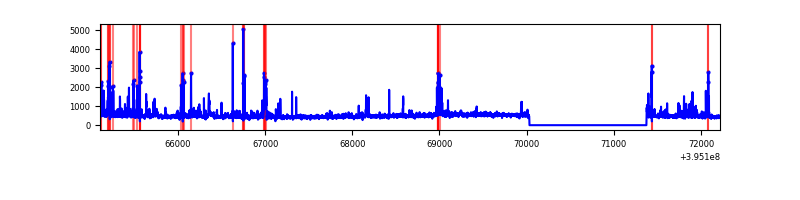 |
| C | 7113 | 5770 | 81 | 81 | 1.14% | 1.40% | 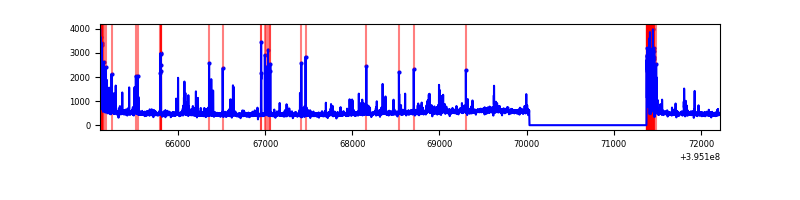 |
| D | 7113 | 5770 | 139 | 139 | 1.95% | 2.41% | 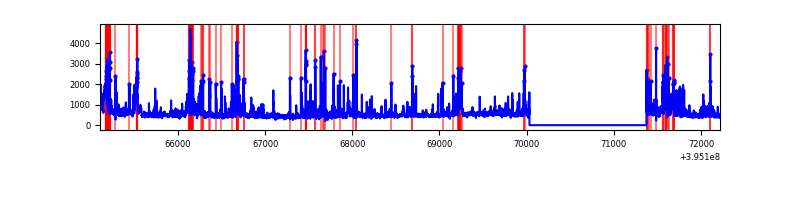 |
Top three noisy pixels from each quadrant. If the there are fewer than three noisy pixels in the level2.evt file, extra rows are filled as -1
| Pixel properties | Quadrant properties | ||||||
|---|---|---|---|---|---|---|---|
| Quadrant | DetID | PixID | Counts | Sigma | Mean | Median | Sigma |
| A | 10 | 83 | 229079 | 1686.15 | 668 | 654 | 135.5 |
| A | 9 | 143 | 33756 | 244.35 | 668 | 654 | 135.5 |
| A | 13 | 254 | 10384 | 71.82 | 668 | 654 | 135.5 |
| B | 5 | 255 | 306905 | 2408.62 | 660 | 642 | 127.2 |
| B | 0 | 229 | 99140 | 774.64 | 660 | 642 | 127.2 |
| B | 0 | 199 | 42259 | 327.3 | 660 | 642 | 127.2 |
| C | 0 | 10 | 330470 | 2212.19 | 639 | 643 | 149.1 |
| C | 15 | 214 | 261295 | 1748.23 | 639 | 643 | 149.1 |
| C | 14 | 254 | 154064 | 1029.01 | 639 | 643 | 149.1 |
| D | 13 | 36 | 212288 | 1337.69 | 640 | 623 | 158.2 |
| D | 12 | 227 | 193898 | 1221.47 | 640 | 623 | 158.2 |
| D | 13 | 171 | 133220 | 837.99 | 640 | 623 | 158.2 |
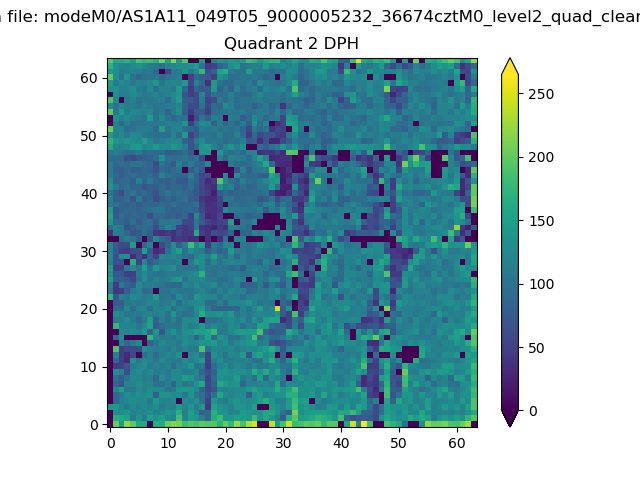
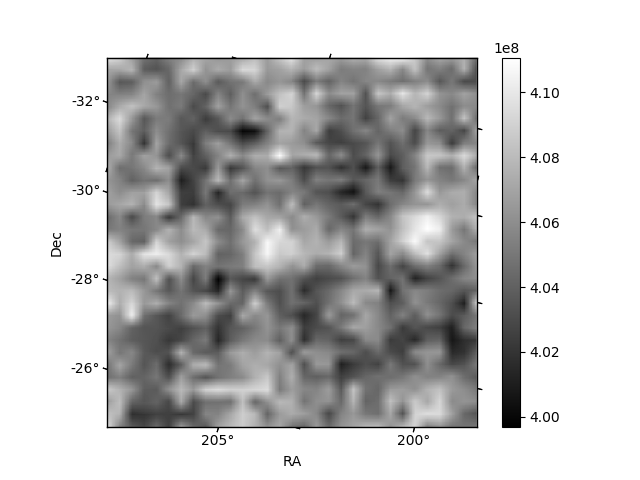
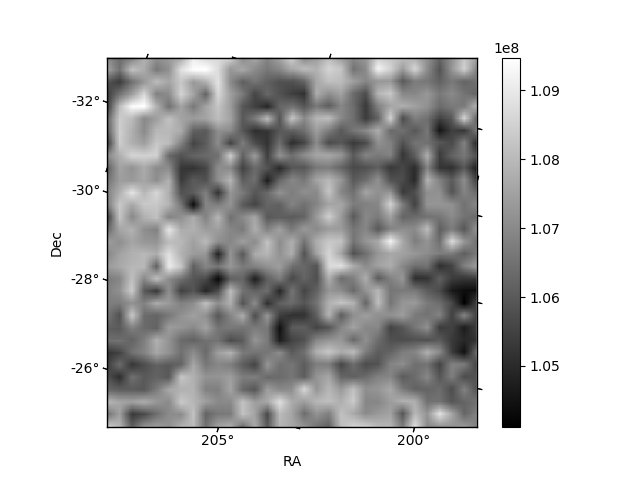
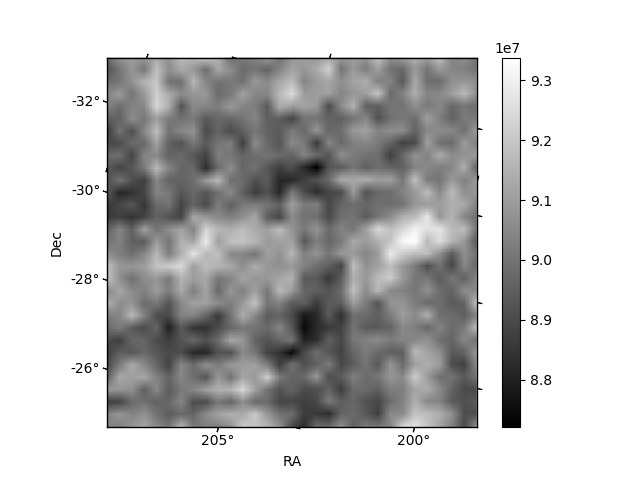
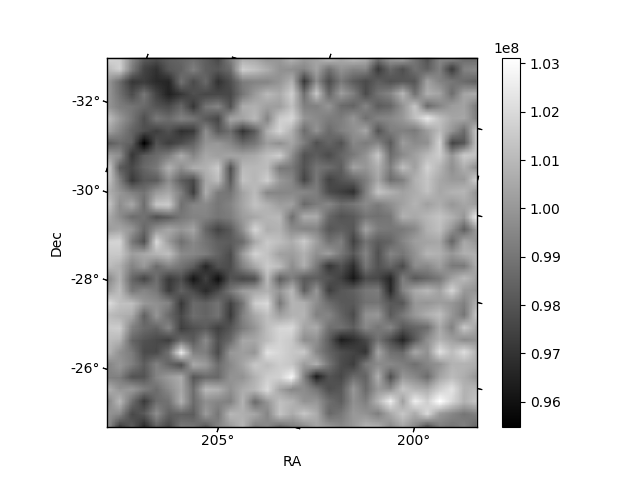
Histogram calculated using DETX and DETY for each event in the final _common_clean file
| Quadrant A | 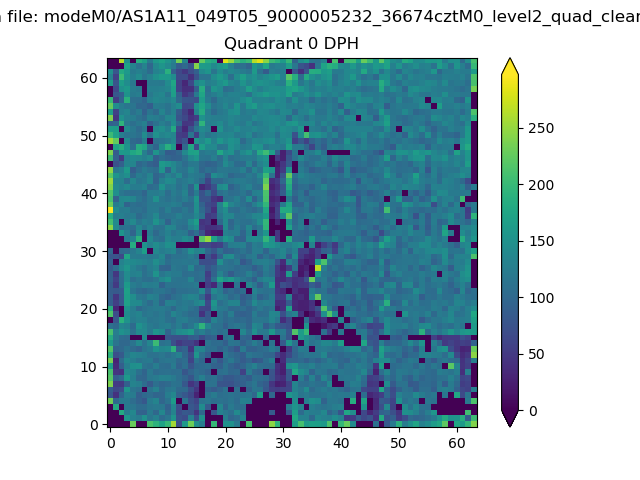 |
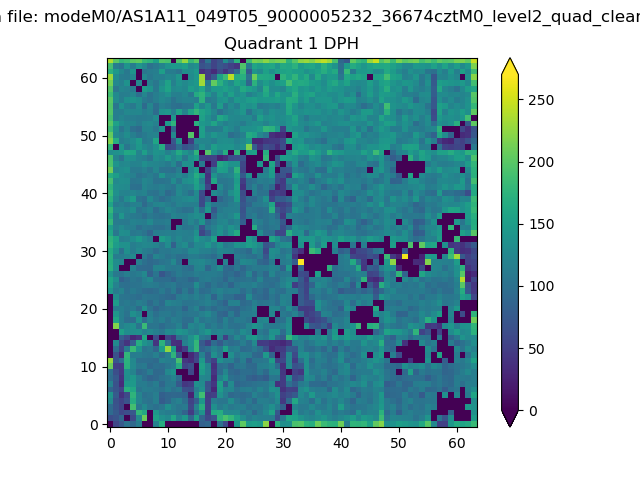 |
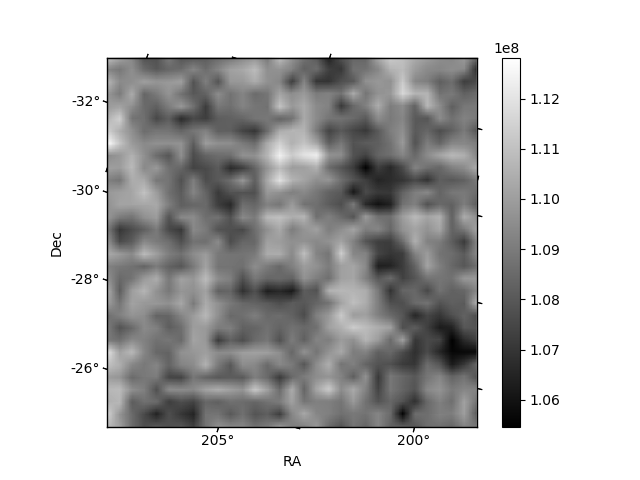
Quadrant B |
|---|---|---|---|
| Quadrant D | 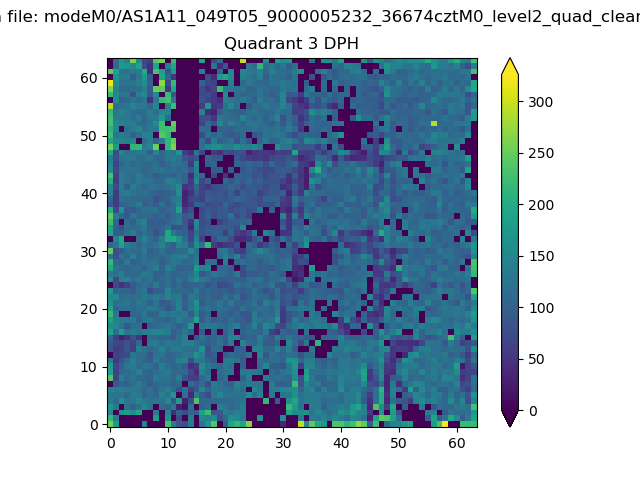 |
 |
Quadrant C |
| Plot type | Count rate plots | Images |
|---|---|---|
| Comparison with Poisson distribution Blue bars denote a histogram of data divided into 1 sec bins. Red curve is a Poisson curve with rate = median count rate of data. |
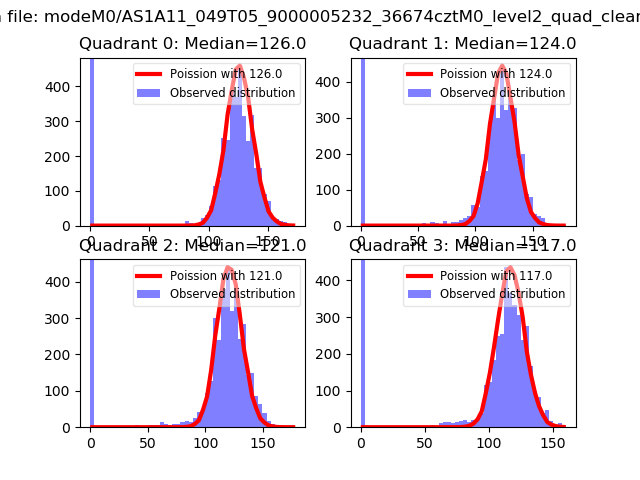 |
 |
| Quadrant-wise count rates Data is divided into 100 sec bins |
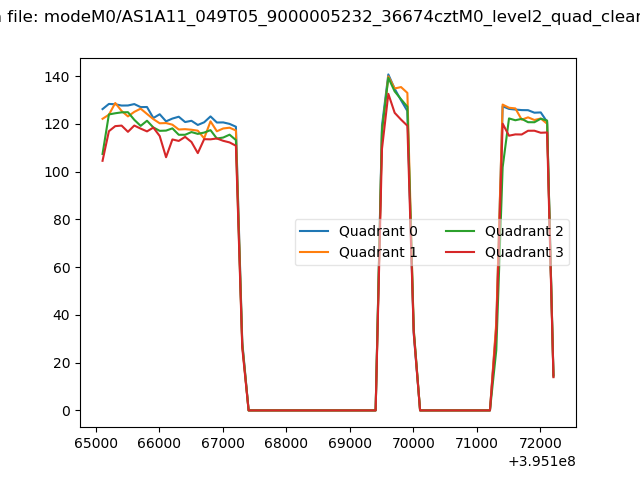 |
|
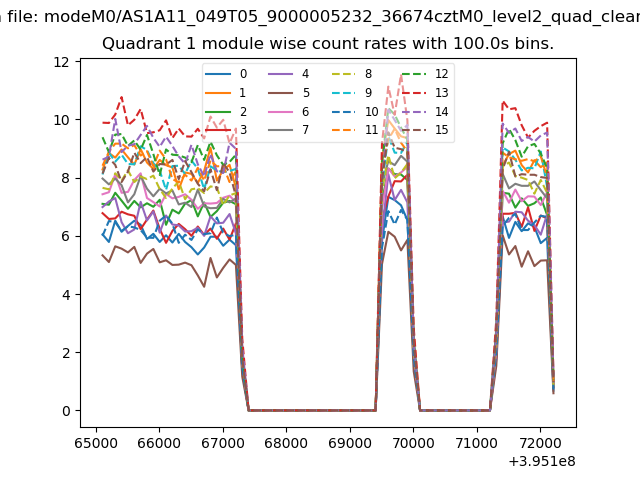
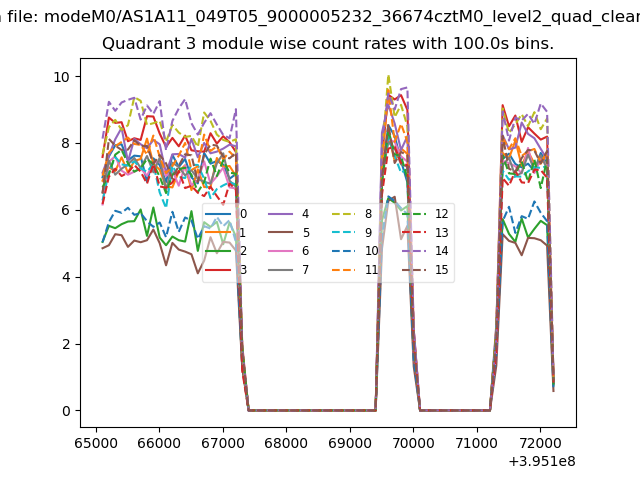
| Module-wise count rates for Quadrant A Data is divided into 100 sec bins |
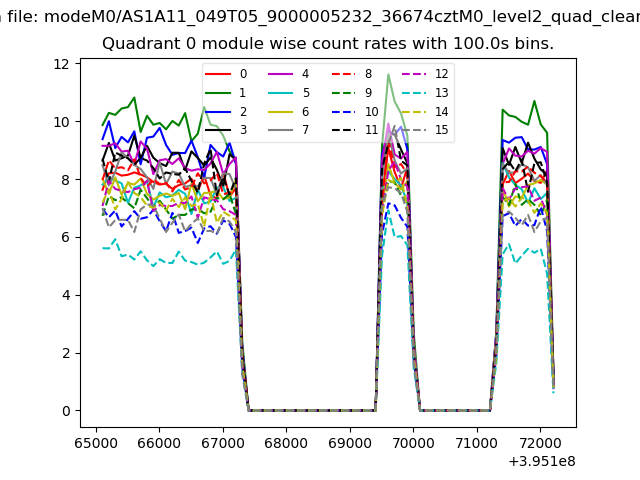 |
 |
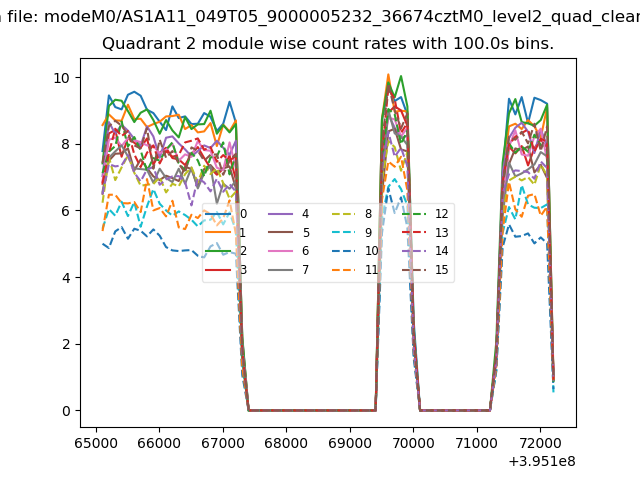
| Module-wise count rates for Quadrant B Data is divided into 100 sec bins |
 |
 |
| Module-wise count rates for Quadrant C Data is divided into 100 sec bins |
 |
 |
| Module-wise count rates for Quadrant D Data is divided into 100 sec bins |
 |
 |
| Parameter | Plot |
|---|---|
| CZT HV Monitor | 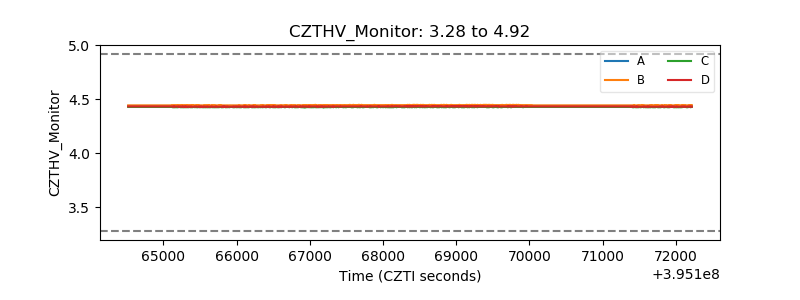 |
| D_VDD | 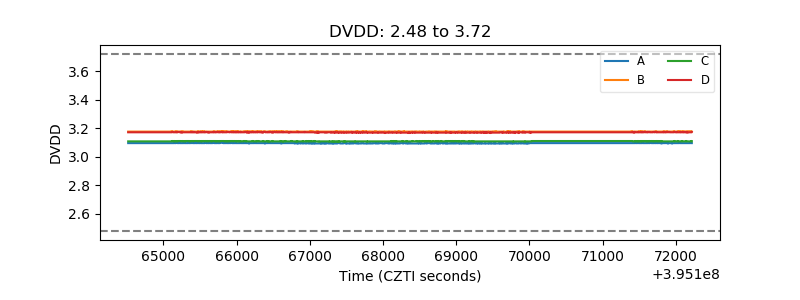 |
| Temperature 1 | 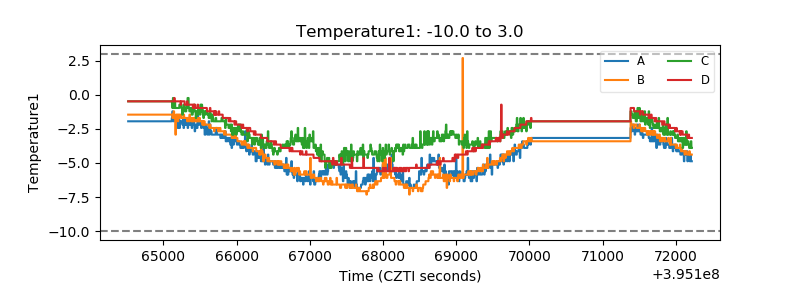 |
| Veto HV Monitor | 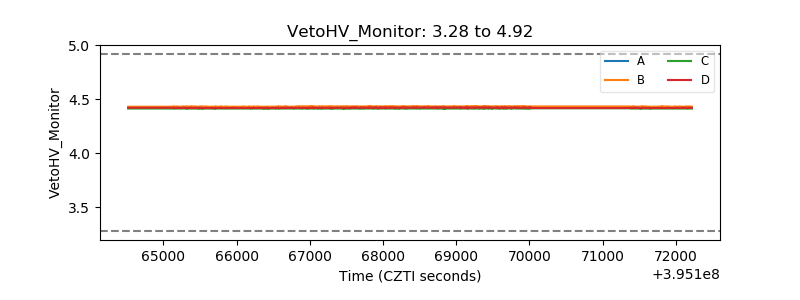 |
| Veto LLD | 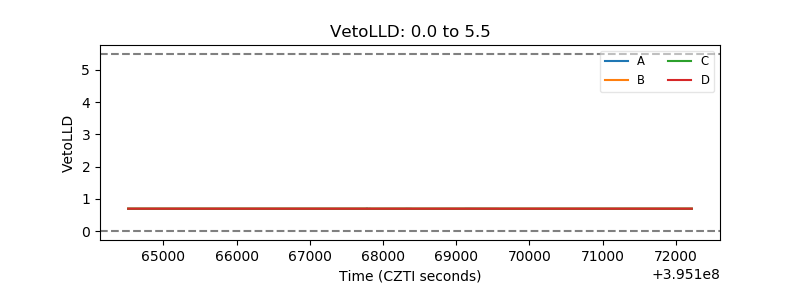 |
| Alpha Counter | 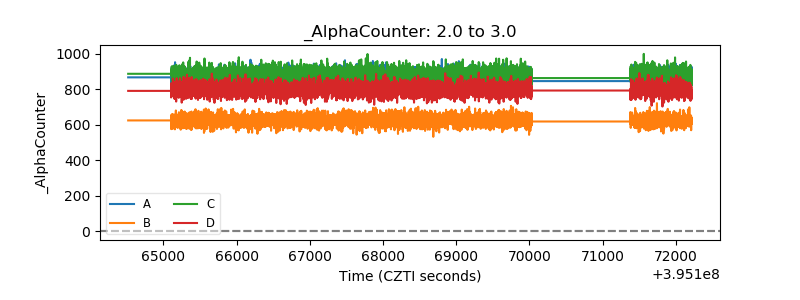 |
| _CPM_Rate | 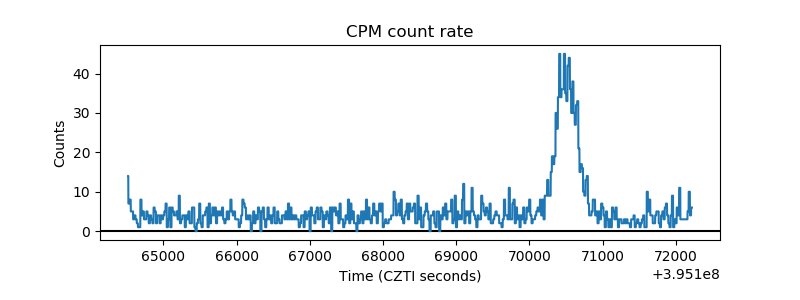 |
| CZT Counter | 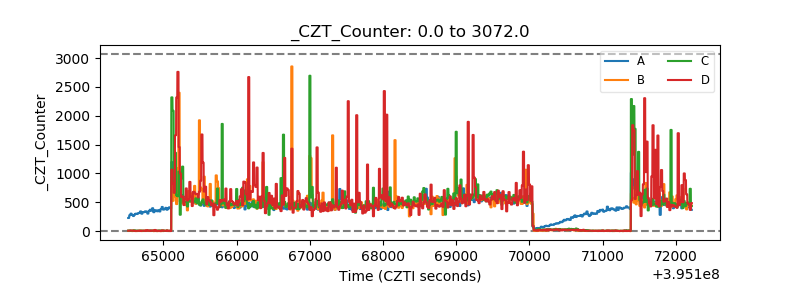 |
| +2.5 Volts monitor | 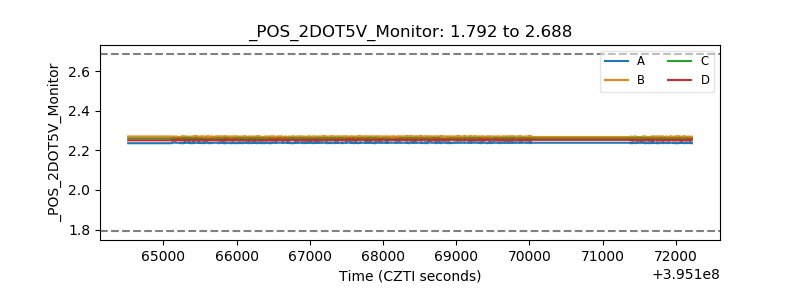 |
| +5 Volts monitor |  |
| _ROLL_ROT | 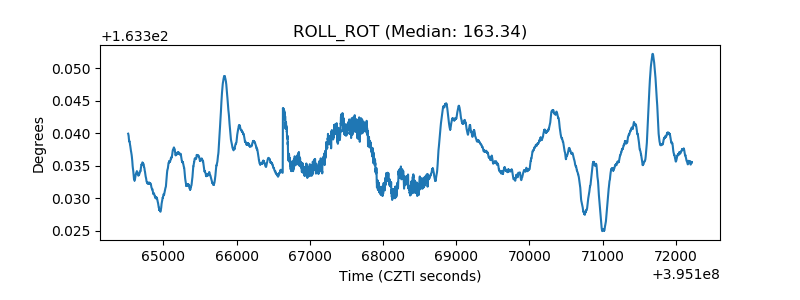 |
| _Roll_DEC | 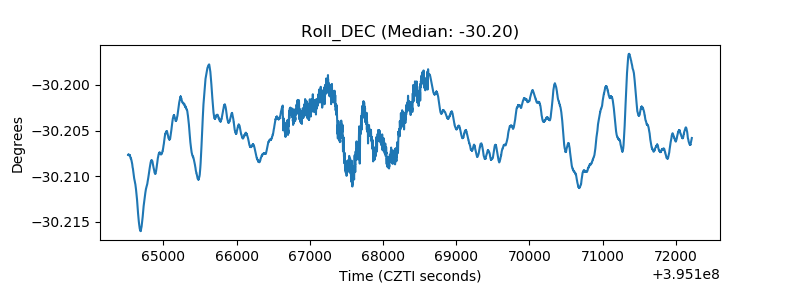 |
| _Roll_RA | 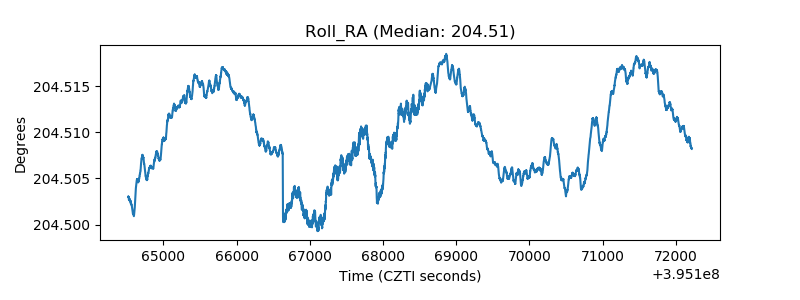 |
| Veto Counter | 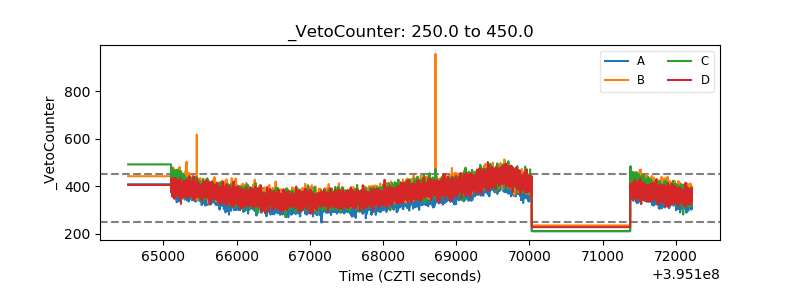 |