| Param | Original file | Final file |
|---|---|---|
| Filename | modeM0/AS1T05_041T01_9000005234cztM0_level2.fits | modeM0/AS1T05_041T01_9000005234cztM0_level2_quad_clean.evt |
| Size (bytes) | 260,824,320 | 350,657,280 |
| Size | 248.7 MB | 334.4 MB |
| Events in quadrant A | 1,547,834 | 2,270,902 |
| Events in quadrant B | 1,436,640 | 2,154,995 |
| Events in quadrant C | 1,516,600 | 2,161,187 |
| Events in quadrant D | 1,307,130 | 1,943,095 |
| Mode M9 | |||
|---|---|---|---|
| Quadrant | BADHDUFLAG | Total packets | Discarded packets |
| A | 0 | 106 | 0 |
| B | 0 | 108 | 0 |
| C | 0 | 105 | 0 |
| D | 0 | 106 | 0 |
| Mode M0 | |||
|---|---|---|---|
| Quadrant | BADHDUFLAG | Total packets | Discarded packets |
| A | 0 | 55466 | 0 |
| B | 0 | 65666 | 0 |
| C | 0 | 62341 | 0 |
| D | 0 | 73312 | 0 |
| Mode SS | |||
|---|---|---|---|
| Quadrant | BADHDUFLAG | Total packets | Discarded packets |
| A | 0 | 1774 | 0 |
| B | 0 | 1774 | 0 |
| C | 0 | 1774 | 0 |
| D | 0 | 1774 | 0 |
| Quadrant | Total seconds | Saturated seconds | Saturation percentage |
|---|---|---|---|
| A | 26467 | 64 | 0.241811% |
| B | 26513 | 1434 | 5.408667% |
| C | 26467 | 707 | 2.671251% |
| D | 26472 | 1045 | 3.947567% |
Noise dominated data is calculated using 1-second bins in cleaned event files. If a bin has >2000 counts, and if more than 50% of those come from <1% of pixels, then it is considered to be noise-dominated and hence unusable.
| Quadrant | # 1 sec bins | Bins with >0 counts | Bins with >2000 counts | High rate bins dominated by noise | Noise dominated (total time) | Noise dominated (detector-on time) | Marked lightcurve |
|---|---|---|---|---|---|---|---|
| A | 36797 | 26473 | 0 | 0 | 0.00% | 0.00% | 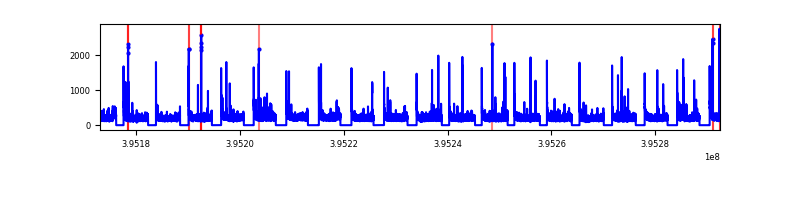 |
| B | 36797 | 26450 | 0 | 0 | 0.00% | 0.00% |  |
| C | 36797 | 26470 | 0 | 0 | 0.00% | 0.00% | 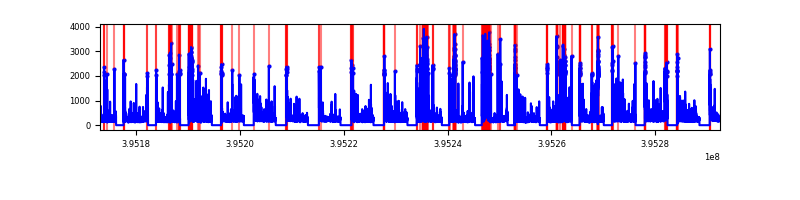 |
| D | 36797 | 26481 | 0 | 0 | 0.00% | 0.00% |  |
Top three noisy pixels from each quadrant. If the there are fewer than three noisy pixels in the level2.evt file, extra rows are filled as -1
| Pixel properties | Quadrant properties | ||||||
|---|---|---|---|---|---|---|---|
| Quadrant | DetID | PixID | Counts | Sigma | Mean | Median | Sigma |
| A | 9 | 19 | 1254 | 8.66 | 404 | 381 | 100.9 |
| A | 7 | 110 | 1215 | 8.27 | 404 | 381 | 100.9 |
| A | 0 | 29 | 1209 | 8.21 | 404 | 381 | 100.9 |
| B | 2 | 9 | 1227 | 11.64 | 380 | 365 | 74.1 |
| B | 3 | 80 | 1097 | 9.88 | 380 | 365 | 74.1 |
| B | 2 | 8 | 980 | 8.3 | 380 | 365 | 74.1 |
| C | 1 | 81 | 1259 | 8.51 | 400 | 377 | 103.6 |
| C | 3 | 202 | 1222 | 8.16 | 400 | 377 | 103.6 |
| C | 3 | 203 | 1214 | 8.08 | 400 | 377 | 103.6 |
| D | 6 | 62 | 957 | 6.14 | 374 | 342 | 100.2 |
| D | 7 | 3 | 951 | 6.08 | 374 | 342 | 100.2 |
| D | 6 | 38 | 938 | 5.95 | 374 | 342 | 100.2 |
Histogram calculated using DETX and DETY for each event in the final _common_clean file
| Quadrant A |  |
 |
Quadrant B |
|---|---|---|---|
| Quadrant D |  |
 |
Quadrant C |
| Plot type | Count rate plots | Images |
|---|---|---|
| Comparison with Poisson distribution Blue bars denote a histogram of data divided into 1 sec bins. Red curve is a Poisson curve with rate = median count rate of data. |
 |
 |
| Quadrant-wise count rates Data is divided into 100 sec bins |
 |
|
| Module-wise count rates for Quadrant A Data is divided into 100 sec bins |
 |
 |
| Module-wise count rates for Quadrant B Data is divided into 100 sec bins |
 |
 |
| Module-wise count rates for Quadrant C Data is divided into 100 sec bins |
 |
 |
| Module-wise count rates for Quadrant D Data is divided into 100 sec bins |
 |
 |
| Parameter | Plot |
|---|---|
| CZT HV Monitor | 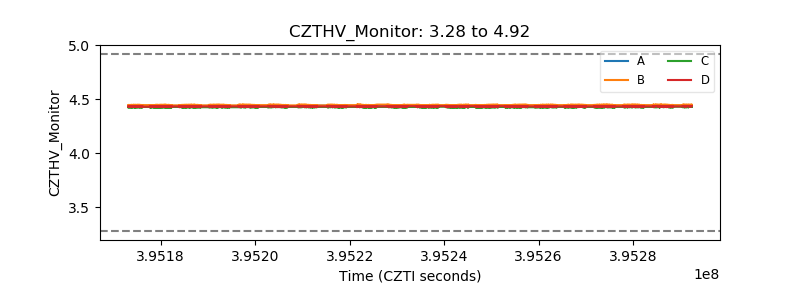 |
| D_VDD |  |
| Temperature 1 |  |
| Veto HV Monitor |  |
| Veto LLD |  |
| Alpha Counter |  |
| _CPM_Rate |  |
| CZT Counter |  |
| +2.5 Volts monitor |  |
| +5 Volts monitor |  |
| _ROLL_ROT |  |
| _Roll_DEC |  |
| _Roll_RA |  |
| Veto Counter |  |