| Param | Original file | Final file |
|---|---|---|
| Filename | modeM0/AS1T05_041T01_9000005234_36675cztM0_level2.evt | modeM0/AS1T05_041T01_9000005234_36675cztM0_level2_quad_clean.evt |
| Size (bytes) | 445,072,320 | 103,311,360 |
| Size | 424.5 MB | 98.5 MB |
| Events in quadrant A | 2,735,342 | 696,828 |
| Events in quadrant B | 2,928,376 | 701,113 |
| Events in quadrant C | 3,165,208 | 688,827 |
| Events in quadrant D | 4,264,398 | 645,068 |
| Mode M9 | |||
|---|---|---|---|
| Quadrant | BADHDUFLAG | Total packets | Discarded packets |
| A | 0 | 23 | 0 |
| B | 0 | 23 | 0 |
| C | 0 | 23 | 0 |
| D | 0 | 24 | 0 |
| Mode M0 | |||
|---|---|---|---|
| Quadrant | BADHDUFLAG | Total packets | Discarded packets |
| A | 0 | 11890 | 3 |
| B | 0 | 12419 | 2 |
| C | 0 | 12877 | 2 |
| D | 0 | 16597 | 2 |
| Mode SS | |||
|---|---|---|---|
| Quadrant | BADHDUFLAG | Total packets | Discarded packets |
| A | 0 | 116 | 0 |
| B | 0 | 116 | 0 |
| C | 0 | 116 | 0 |
| D | 0 | 116 | 0 |
| Quadrant | Total seconds | Saturated seconds | Saturation percentage |
|---|---|---|---|
| A | 5675 | 21 | 0.370044% |
| B | 5675 | 44 | 0.775330% |
| C | 5675 | 107 | 1.885463% |
| D | 5675 | 342 | 6.026432% |
Noise dominated data is calculated using 1-second bins in cleaned event files. If a bin has >2000 counts, and if more than 50% of those come from <1% of pixels, then it is considered to be noise-dominated and hence unusable.
| Quadrant | # 1 sec bins | Bins with >0 counts | Bins with >2000 counts | High rate bins dominated by noise | Noise dominated (total time) | Noise dominated (detector-on time) | Marked lightcurve |
|---|---|---|---|---|---|---|---|
| A | 7198 | 5676 | 8 | 8 | 0.11% | 0.14% | 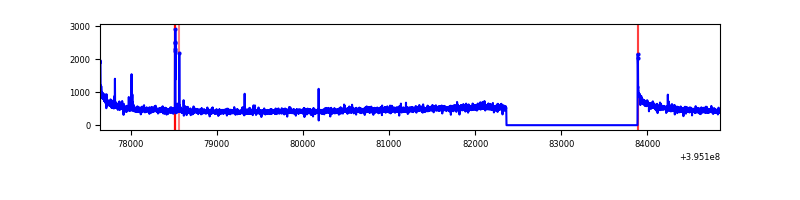 |
| B | 7198 | 5676 | 20 | 20 | 0.28% | 0.35% | 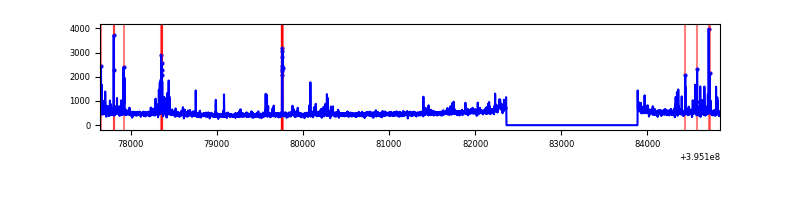 |
| C | 7198 | 5676 | 76 | 76 | 1.06% | 1.34% | 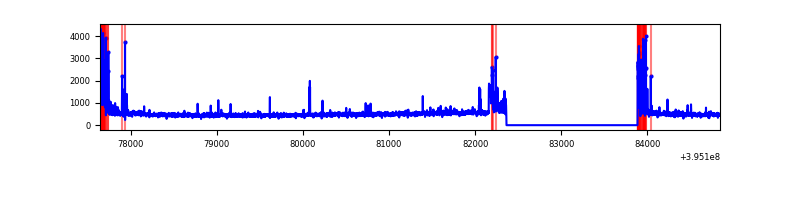 |
| D | 7198 | 5676 | 273 | 273 | 3.79% | 4.81% | 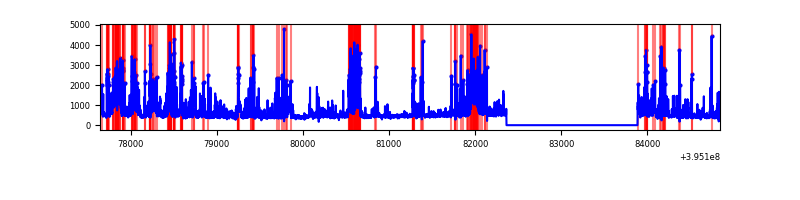 |
Top three noisy pixels from each quadrant. If the there are fewer than three noisy pixels in the level2.evt file, extra rows are filled as -1
| Pixel properties | Quadrant properties | ||||||
|---|---|---|---|---|---|---|---|
| Quadrant | DetID | PixID | Counts | Sigma | Mean | Median | Sigma |
| A | 10 | 83 | 217070 | 1682.66 | 638 | 625 | 128.6 |
| A | 9 | 143 | 15923 | 118.93 | 638 | 625 | 128.6 |
| A | 0 | 8 | 13635 | 101.14 | 638 | 625 | 128.6 |
| B | 5 | 255 | 162723 | 1333.86 | 635 | 616 | 121.5 |
| B | 0 | 189 | 115920 | 948.75 | 635 | 616 | 121.5 |
| B | 4 | 171 | 27864 | 224.2 | 635 | 616 | 121.5 |
| C | 0 | 10 | 296562 | 2039.68 | 621 | 625 | 145.1 |
| C | 15 | 214 | 257568 | 1770.93 | 621 | 625 | 145.1 |
| C | 8 | 111 | 104940 | 718.97 | 621 | 625 | 145.1 |
| D | 2 | 249 | 786650 | 5281.62 | 610 | 594 | 148.8 |
| D | 13 | 249 | 179921 | 1204.92 | 610 | 594 | 148.8 |
| D | 12 | 227 | 141842 | 949.07 | 610 | 594 | 148.8 |
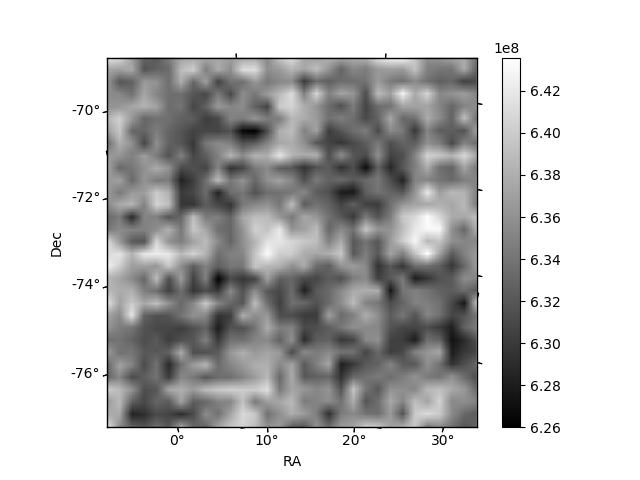
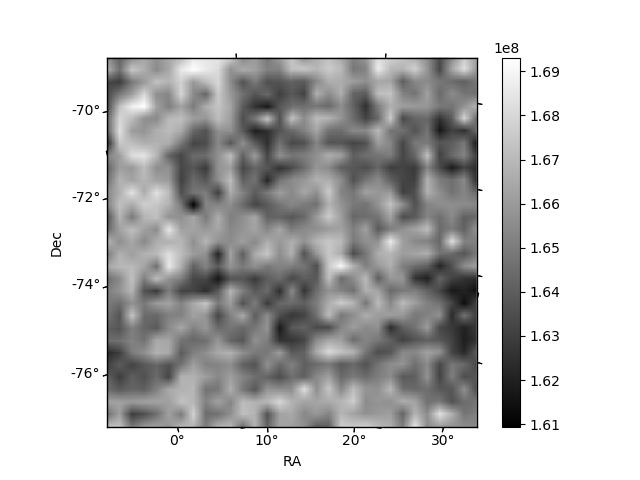
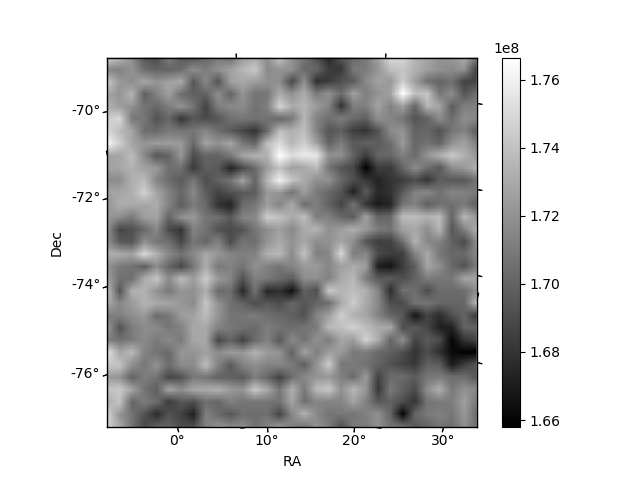
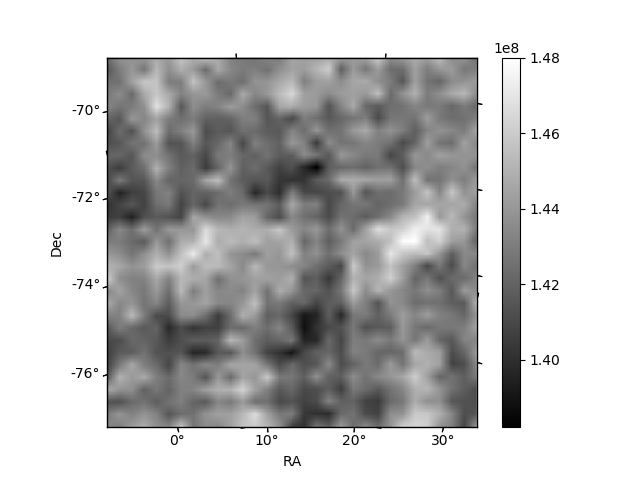
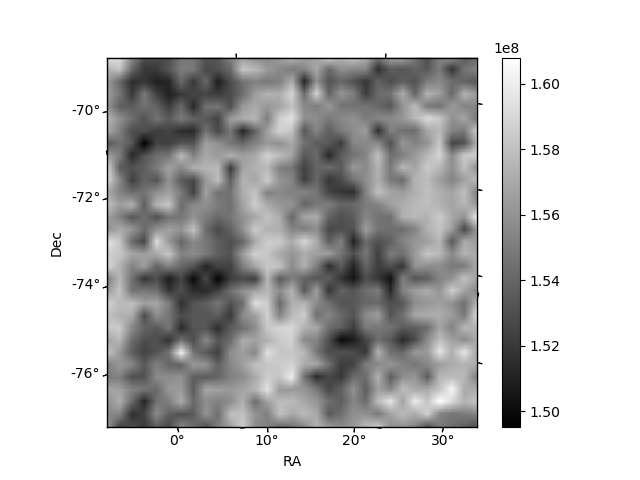
Histogram calculated using DETX and DETY for each event in the final _common_clean file
| Quadrant A | 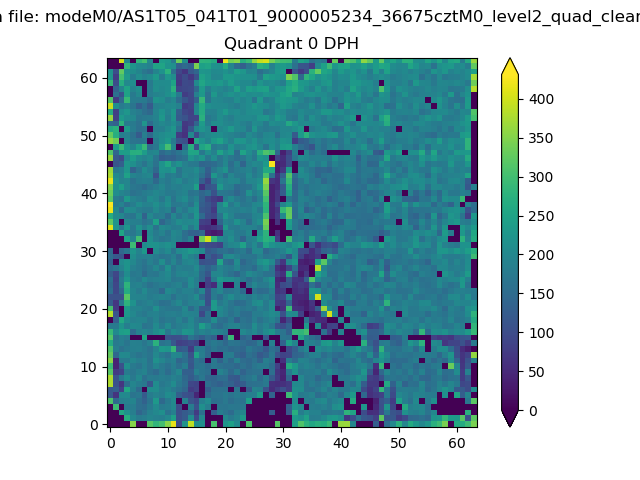 |
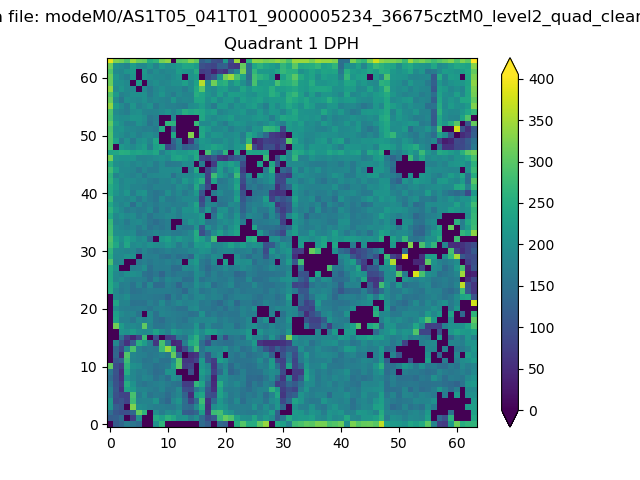 |
Quadrant B |
|---|---|---|---|
| Quadrant D | 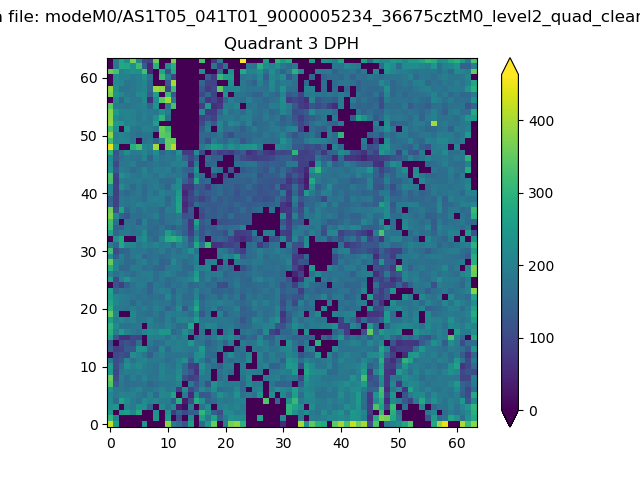 |
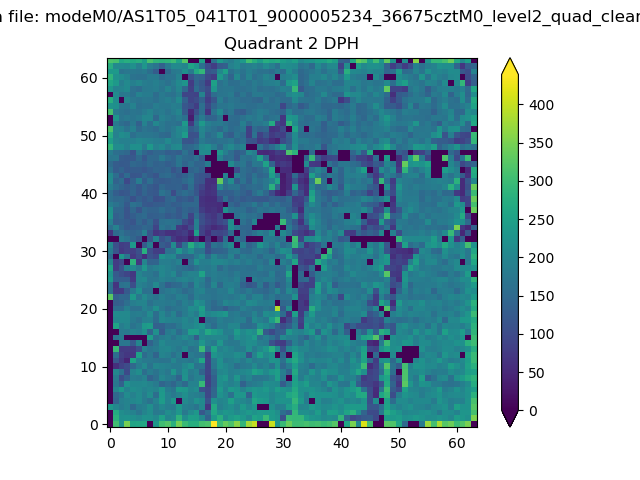 |
Quadrant C |
| Plot type | Count rate plots | Images |
|---|---|---|
| Comparison with Poisson distribution Blue bars denote a histogram of data divided into 1 sec bins. Red curve is a Poisson curve with rate = median count rate of data. |
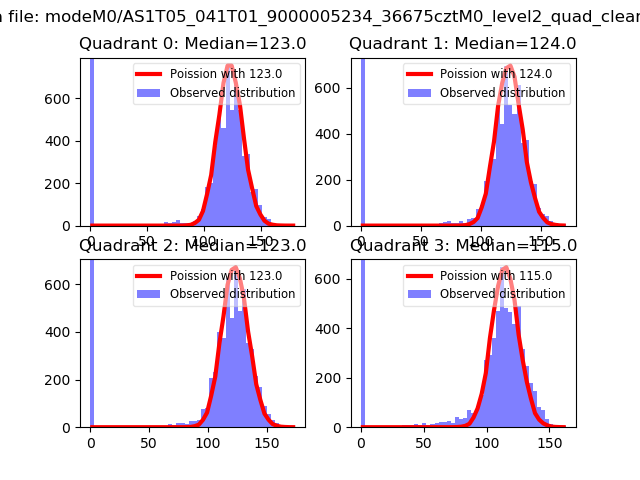 |
 |
| Quadrant-wise count rates Data is divided into 100 sec bins |
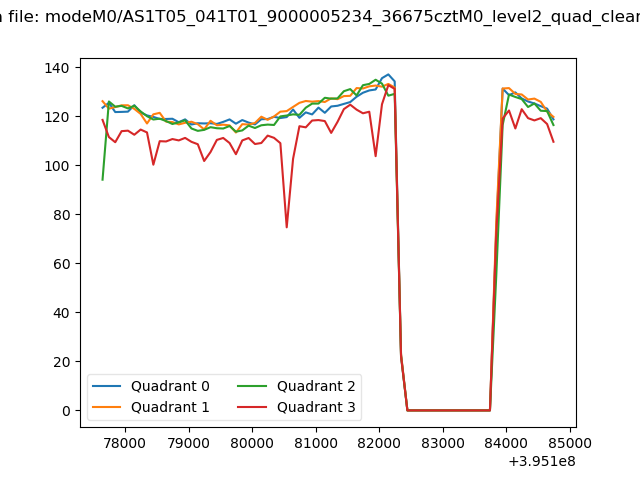 |
|
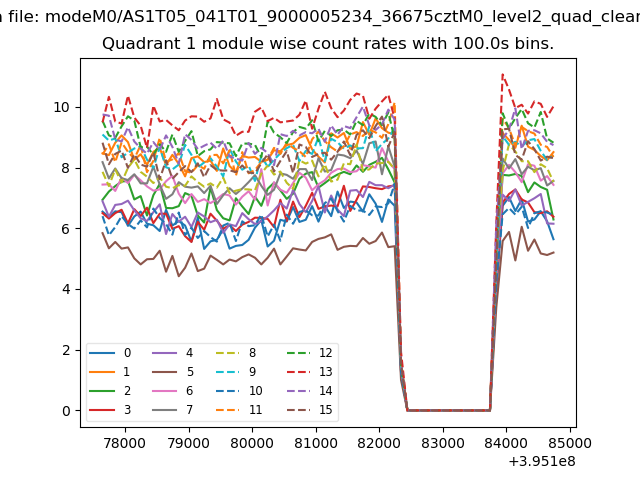
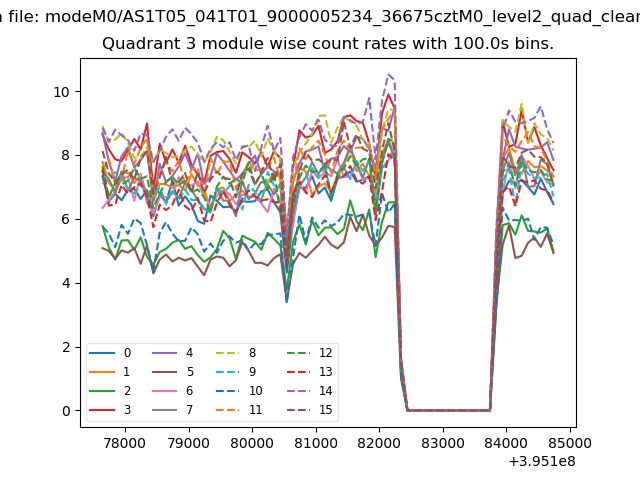
| Module-wise count rates for Quadrant A Data is divided into 100 sec bins |
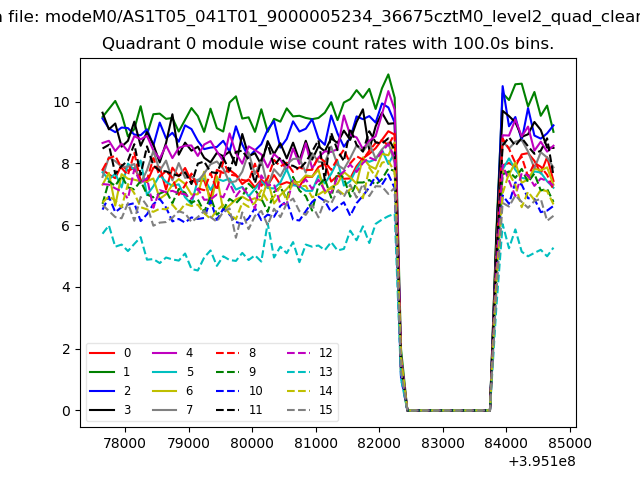 |
 |
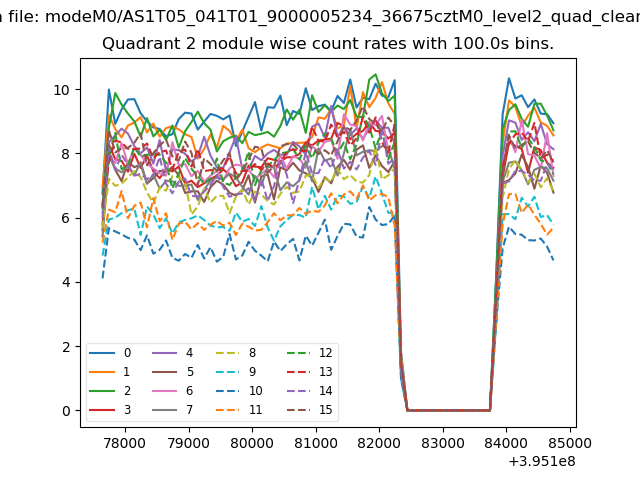
| Module-wise count rates for Quadrant B Data is divided into 100 sec bins |
 |
 |
| Module-wise count rates for Quadrant C Data is divided into 100 sec bins |
 |
 |
| Module-wise count rates for Quadrant D Data is divided into 100 sec bins |
 |
 |
| Parameter | Plot |
|---|---|
| CZT HV Monitor | 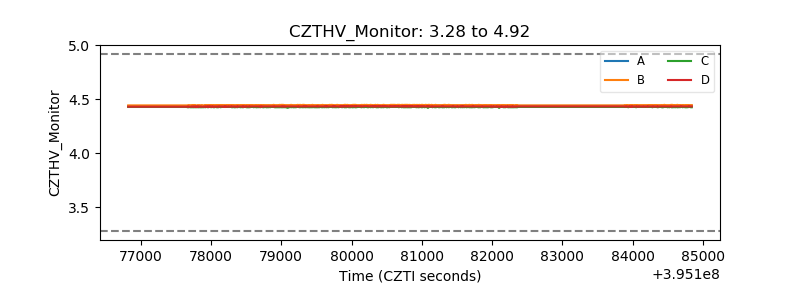 |
| D_VDD |  |
| Temperature 1 | 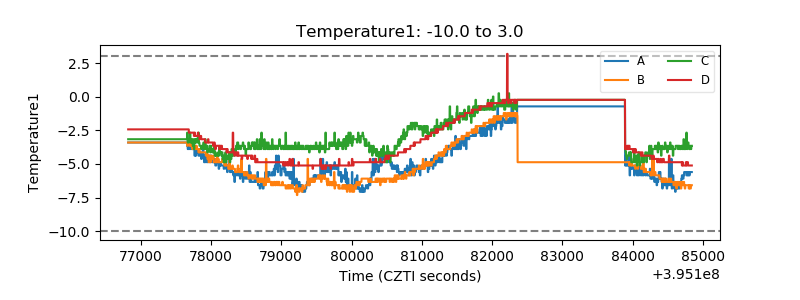 |
| Veto HV Monitor | 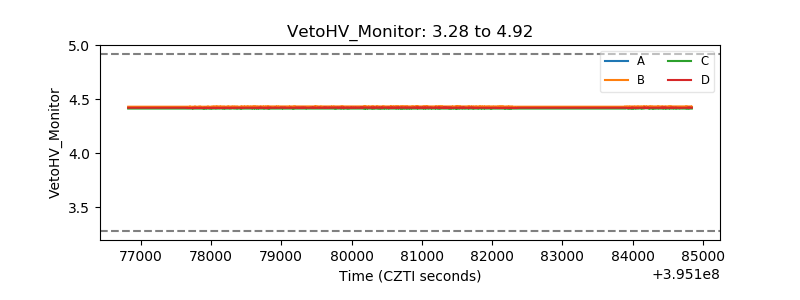 |
| Veto LLD | 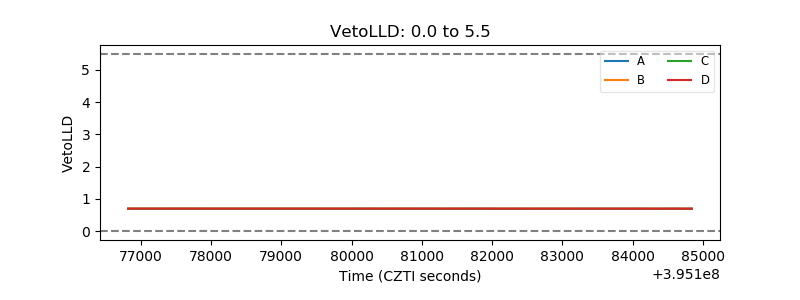 |
| Alpha Counter | 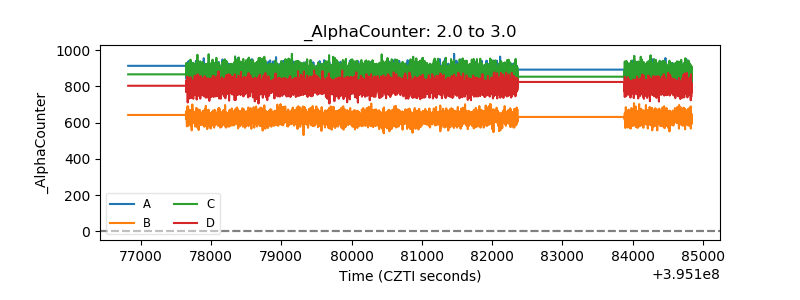 |
| _CPM_Rate | 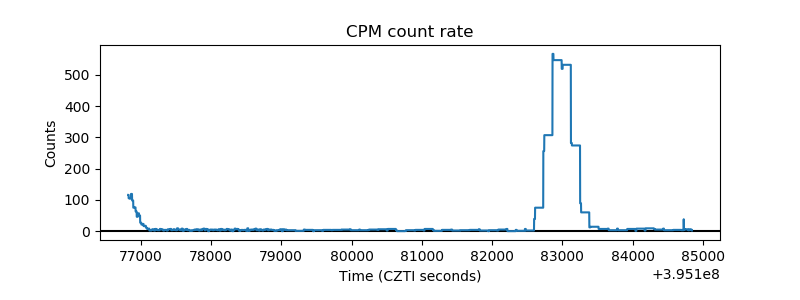 |
| CZT Counter | 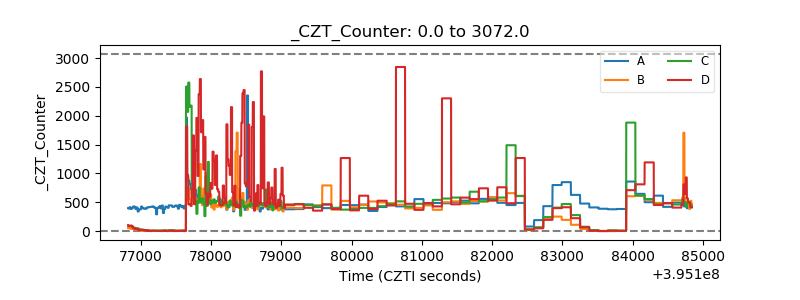 |
| +2.5 Volts monitor | 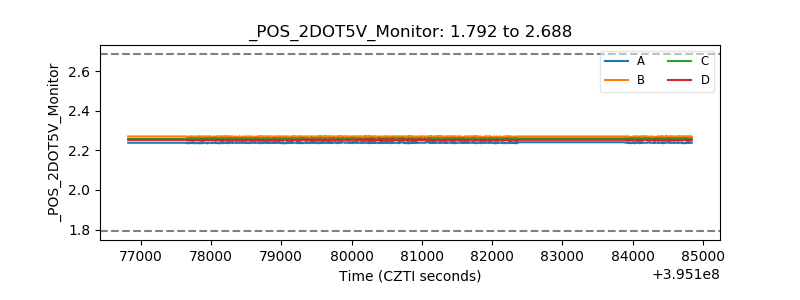 |
| +5 Volts monitor |  |
| _ROLL_ROT | 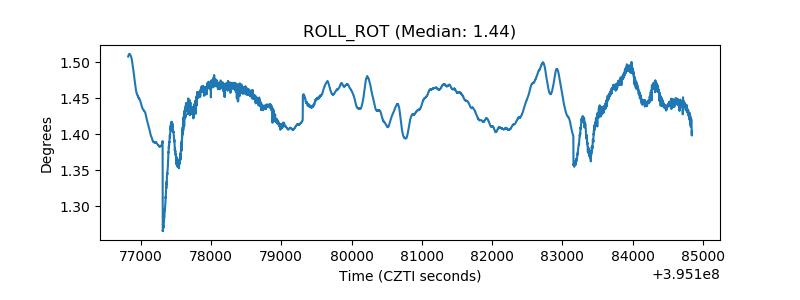 |
| _Roll_DEC | 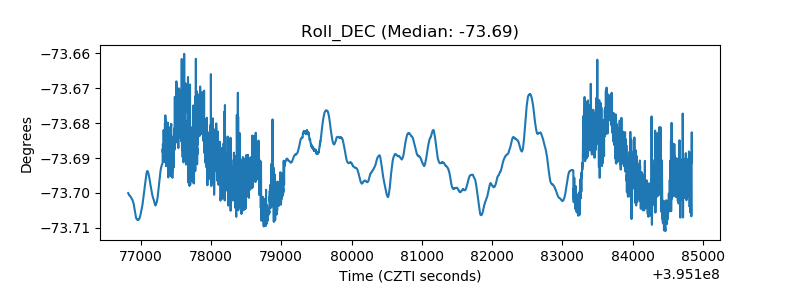 |
| _Roll_RA | 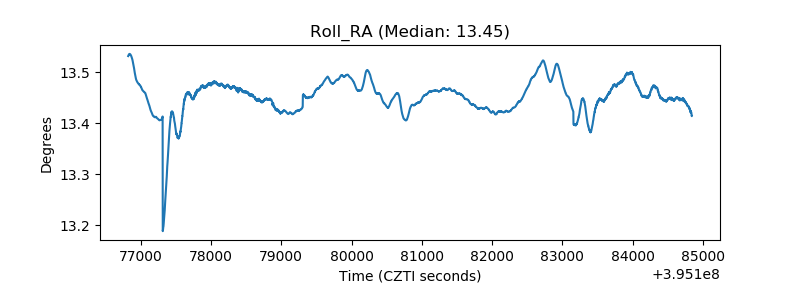 |
| Veto Counter | 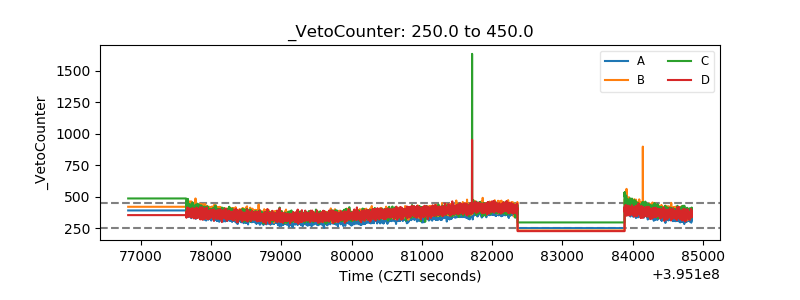 |