| Param | Original file | Final file |
|---|---|---|
| Filename | modeM0/AS1T05_041T01_9000005234_36678cztM0_level2.evt | modeM0/AS1T05_041T01_9000005234_36678cztM0_level2_quad_clean.evt |
| Size (bytes) | 459,322,560 | 106,027,200 |
| Size | 438.0 MB | 101.1 MB |
| Events in quadrant A | 2,738,290 | 717,431 |
| Events in quadrant B | 3,015,852 | 727,562 |
| Events in quadrant C | 3,885,129 | 703,438 |
| Events in quadrant D | 3,895,913 | 675,721 |
| Mode M9 | |||
|---|---|---|---|
| Quadrant | BADHDUFLAG | Total packets | Discarded packets |
| A | 0 | 27 | 0 |
| B | 0 | 27 | 0 |
| C | 0 | 27 | 0 |
| D | 0 | 28 | 0 |
| Mode M0 | |||
|---|---|---|---|
| Quadrant | BADHDUFLAG | Total packets | Discarded packets |
| A | 0 | 11679 | 3 |
| B | 0 | 12413 | 2 |
| C | 0 | 14839 | 2 |
| D | 0 | 15341 | 2 |
| Mode SS | |||
|---|---|---|---|
| Quadrant | BADHDUFLAG | Total packets | Discarded packets |
| A | 0 | 112 | 0 |
| B | 0 | 112 | 0 |
| C | 0 | 112 | 0 |
| D | 0 | 112 | 0 |
| Quadrant | Total seconds | Saturated seconds | Saturation percentage |
|---|---|---|---|
| A | 5530 | 22 | 0.397830% |
| B | 5530 | 59 | 1.066908% |
| C | 5530 | 319 | 5.768535% |
| D | 5530 | 189 | 3.417722% |
Noise dominated data is calculated using 1-second bins in cleaned event files. If a bin has >2000 counts, and if more than 50% of those come from <1% of pixels, then it is considered to be noise-dominated and hence unusable.
| Quadrant | # 1 sec bins | Bins with >0 counts | Bins with >2000 counts | High rate bins dominated by noise | Noise dominated (total time) | Noise dominated (detector-on time) | Marked lightcurve |
|---|---|---|---|---|---|---|---|
| A | 7323 | 5531 | 16 | 16 | 0.22% | 0.29% | 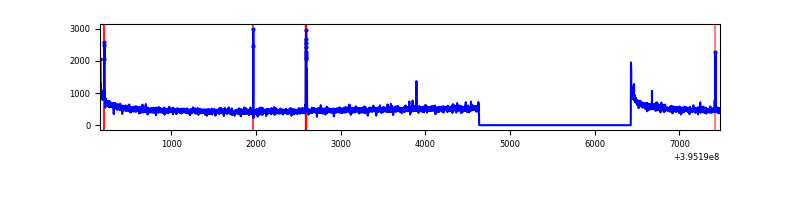 |
| B | 7323 | 5531 | 35 | 35 | 0.48% | 0.63% | 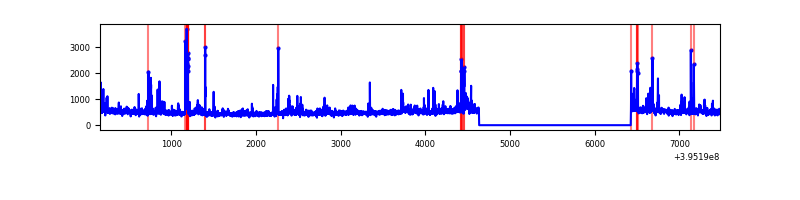 |
| C | 7323 | 5531 | 269 | 269 | 3.67% | 4.86% | 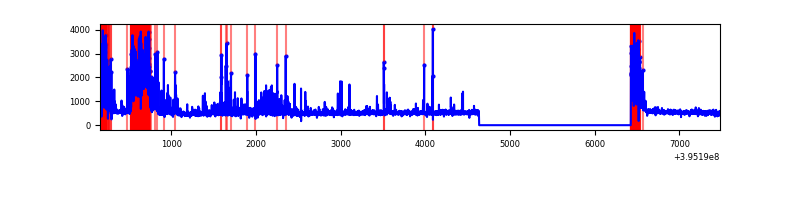 |
| D | 7323 | 5531 | 142 | 142 | 1.94% | 2.57% | 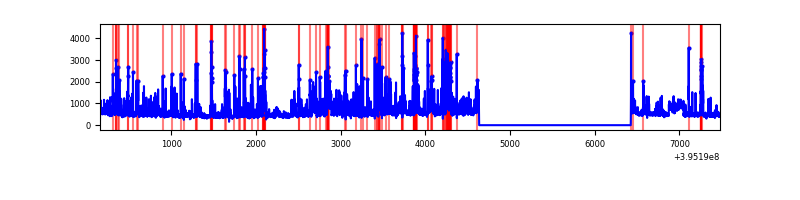 |
Top three noisy pixels from each quadrant. If the there are fewer than three noisy pixels in the level2.evt file, extra rows are filled as -1
| Pixel properties | Quadrant properties | ||||||
|---|---|---|---|---|---|---|---|
| Quadrant | DetID | PixID | Counts | Sigma | Mean | Median | Sigma |
| A | 10 | 83 | 206234 | 1606.49 | 638 | 625 | 128.0 |
| A | 9 | 143 | 39114 | 300.73 | 638 | 625 | 128.0 |
| A | 13 | 6 | 15417 | 115.57 | 638 | 625 | 128.0 |
| B | 0 | 189 | 200379 | 1651.51 | 637 | 620 | 121.0 |
| B | 5 | 255 | 176523 | 1454.28 | 637 | 620 | 121.0 |
| B | 0 | 221 | 29303 | 237.14 | 637 | 620 | 121.0 |
| C | 0 | 10 | 579927 | 4042.64 | 622 | 626 | 143.3 |
| C | 4 | 254 | 420791 | 2932.11 | 622 | 626 | 143.3 |
| C | 15 | 214 | 250641 | 1744.72 | 622 | 626 | 143.3 |
| D | 13 | 249 | 487456 | 3203.1 | 622 | 605 | 152.0 |
| D | 13 | 171 | 228809 | 1501.4 | 622 | 605 | 152.0 |
| D | 2 | 250 | 140412 | 919.82 | 622 | 605 | 152.0 |
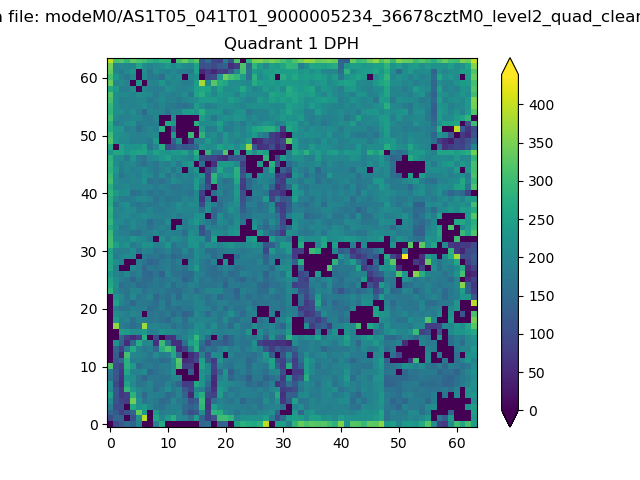
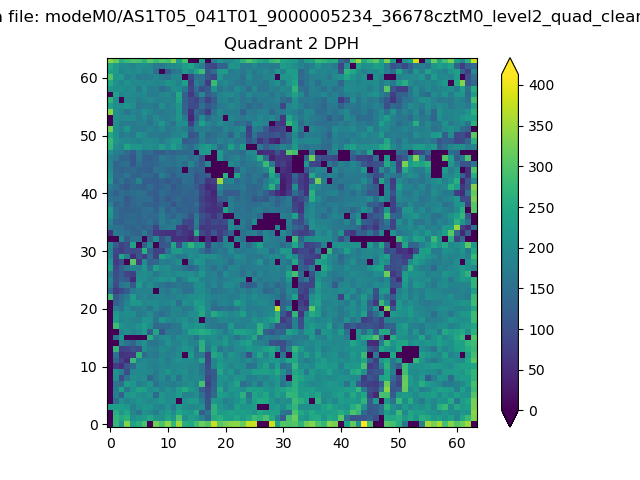
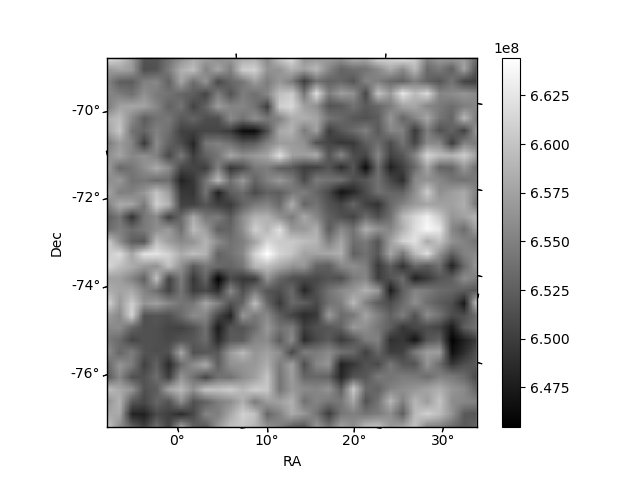
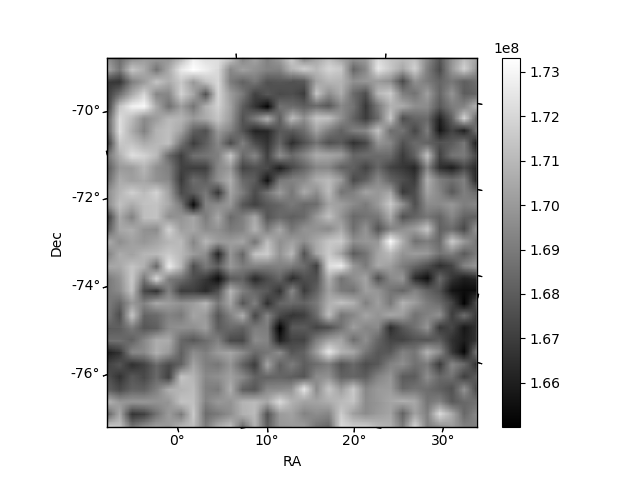
Histogram calculated using DETX and DETY for each event in the final _common_clean file
| Quadrant A |  |
 |
Quadrant B |
|---|---|---|---|
| Quadrant D | 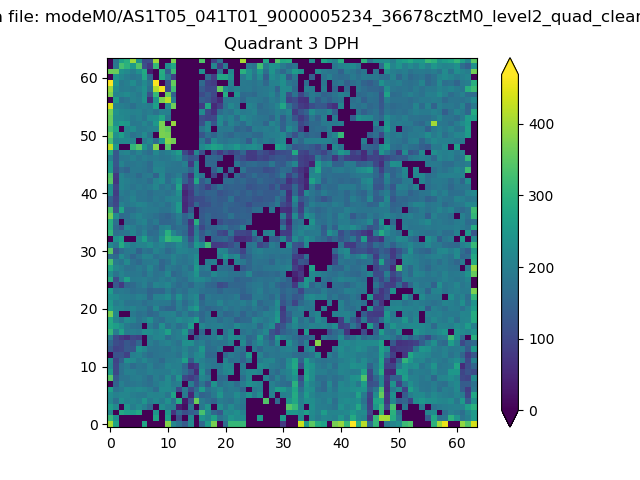 |
 |
Quadrant C |
| Plot type | Count rate plots | Images |
|---|---|---|
| Comparison with Poisson distribution Blue bars denote a histogram of data divided into 1 sec bins. Red curve is a Poisson curve with rate = median count rate of data. |
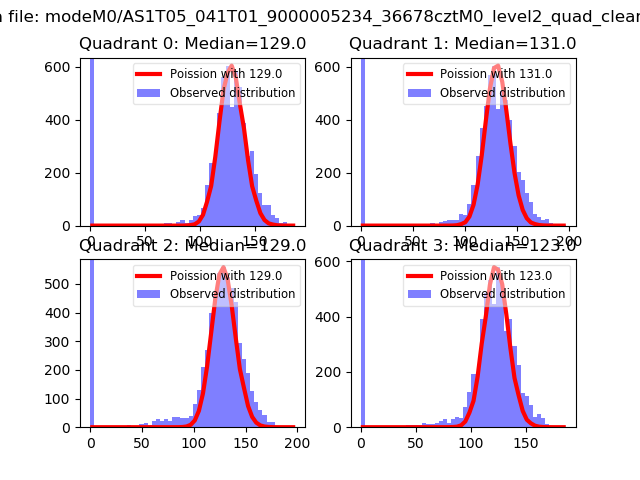 |
 |
| Quadrant-wise count rates Data is divided into 100 sec bins |
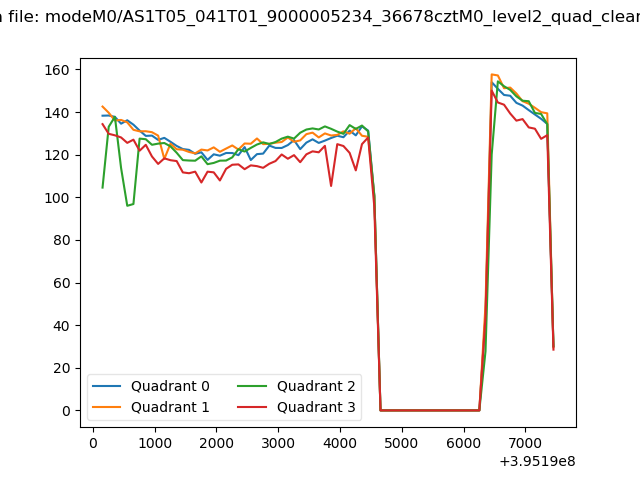 |
|
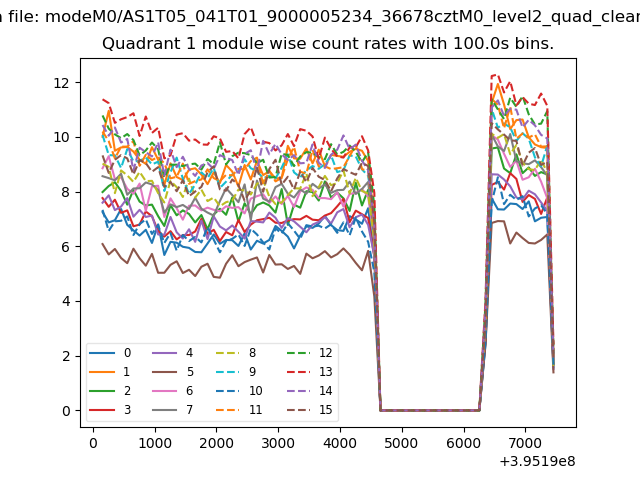
| Module-wise count rates for Quadrant A Data is divided into 100 sec bins |
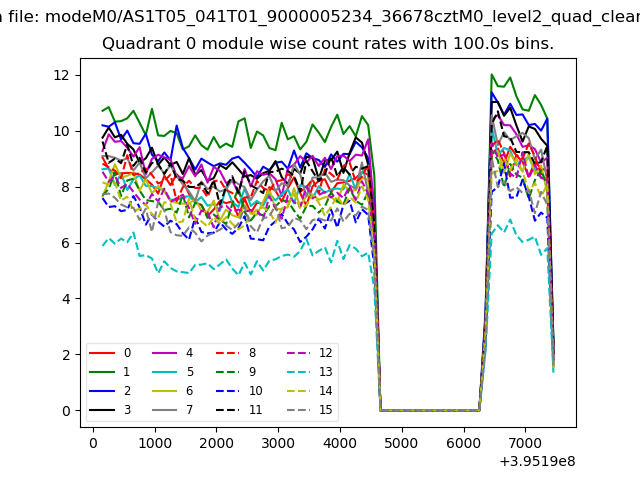 |
 |
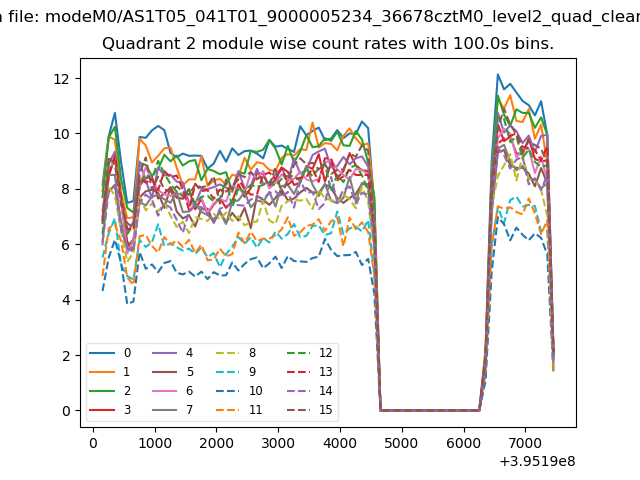
| Module-wise count rates for Quadrant B Data is divided into 100 sec bins |
 |
 |
| Module-wise count rates for Quadrant C Data is divided into 100 sec bins |
 |
 |
| Module-wise count rates for Quadrant D Data is divided into 100 sec bins |
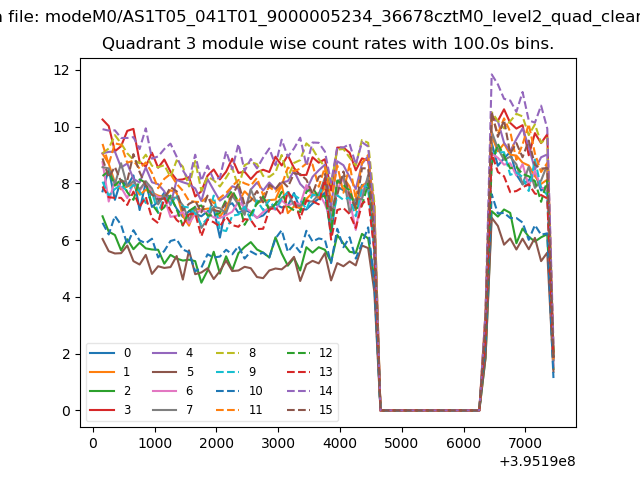 |
 |
| Parameter | Plot |
|---|---|
| CZT HV Monitor | 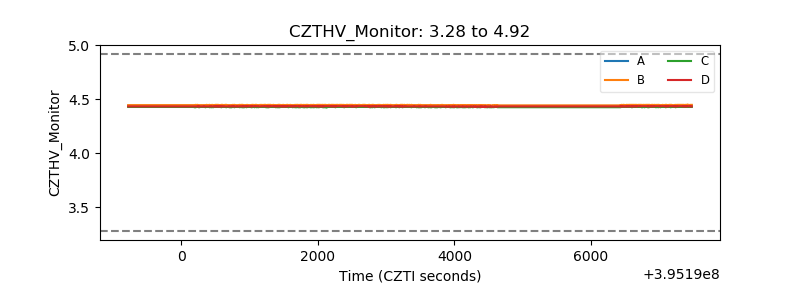 |
| D_VDD | 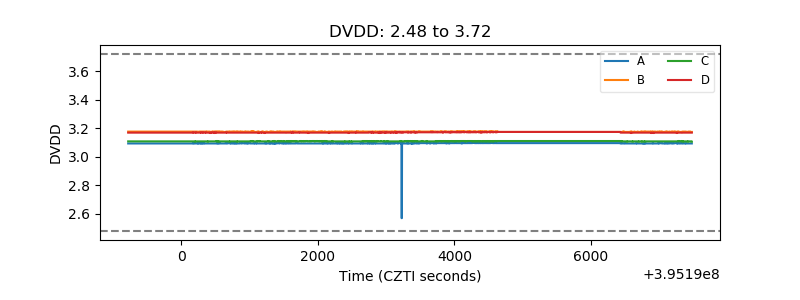 |
| Temperature 1 | 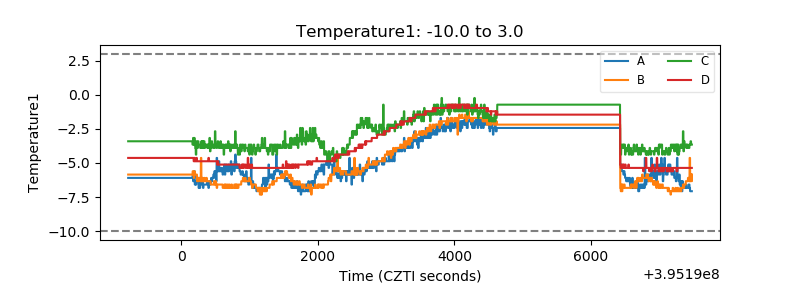 |
| Veto HV Monitor |  |
| Veto LLD | 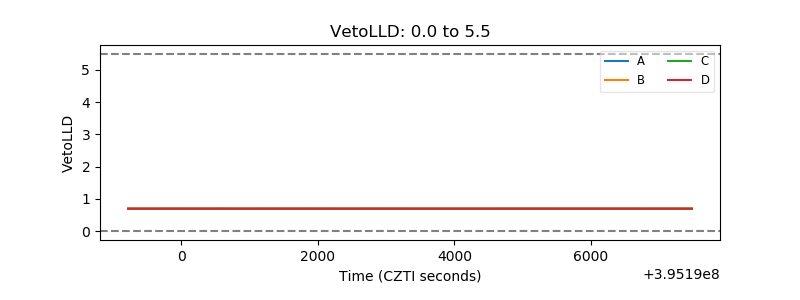 |
| Alpha Counter | 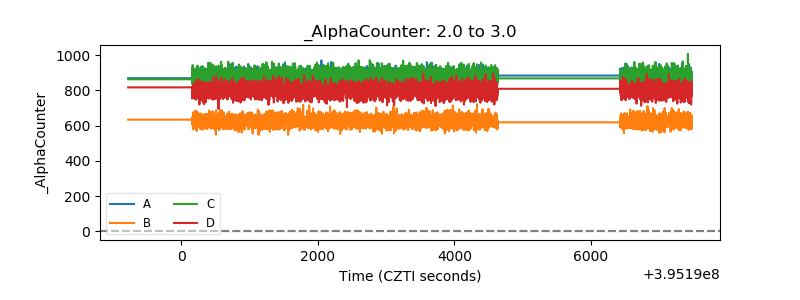 |
| _CPM_Rate |  |
| CZT Counter | 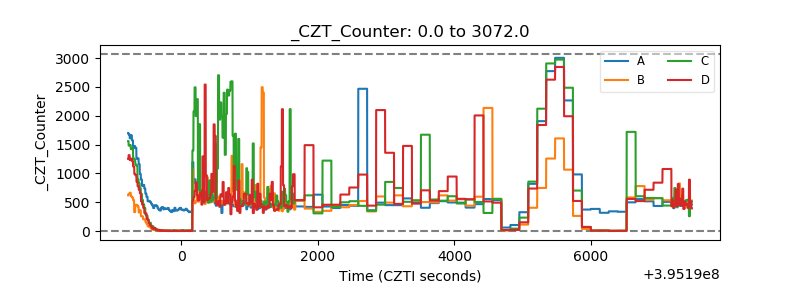 |
| +2.5 Volts monitor |  |
| +5 Volts monitor |  |
| _ROLL_ROT | 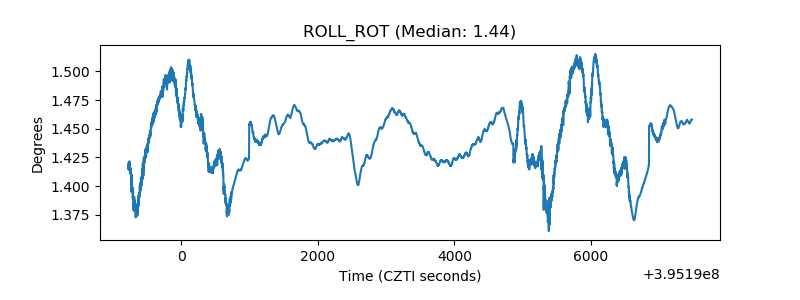 |
| _Roll_DEC | 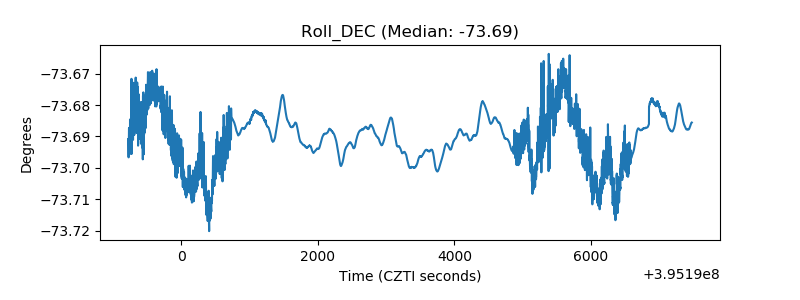 |
| _Roll_RA | 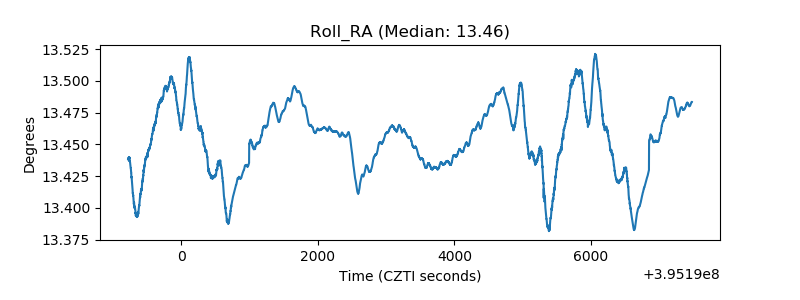 |
| Veto Counter |  |