| Param | Original file | Final file |
|---|---|---|
| Filename | modeM0/AS1T05_041T01_9000005234_36679cztM0_level2.evt | modeM0/AS1T05_041T01_9000005234_36679cztM0_level2_quad_clean.evt |
| Size (bytes) | 435,225,600 | 109,160,640 |
| Size | 415.1 MB | 104.1 MB |
| Events in quadrant A | 2,735,792 | 735,678 |
| Events in quadrant B | 3,114,063 | 750,458 |
| Events in quadrant C | 3,186,745 | 744,567 |
| Events in quadrant D | 3,779,860 | 699,712 |
| Mode M9 | |||
|---|---|---|---|
| Quadrant | BADHDUFLAG | Total packets | Discarded packets |
| A | 0 | 29 | 0 |
| B | 0 | 29 | 0 |
| C | 0 | 29 | 0 |
| D | 0 | 30 | 0 |
| Mode M0 | |||
|---|---|---|---|
| Quadrant | BADHDUFLAG | Total packets | Discarded packets |
| A | 0 | 11394 | 3 |
| B | 0 | 12568 | 2 |
| C | 0 | 12501 | 2 |
| D | 0 | 14797 | 2 |
| Mode SS | |||
|---|---|---|---|
| Quadrant | BADHDUFLAG | Total packets | Discarded packets |
| A | 0 | 108 | 0 |
| B | 0 | 108 | 0 |
| C | 0 | 108 | 0 |
| D | 0 | 108 | 0 |
| Quadrant | Total seconds | Saturated seconds | Saturation percentage |
|---|---|---|---|
| A | 5371 | 9 | 0.167567% |
| B | 5371 | 92 | 1.712903% |
| C | 5371 | 134 | 2.494880% |
| D | 5371 | 191 | 3.556135% |
Noise dominated data is calculated using 1-second bins in cleaned event files. If a bin has >2000 counts, and if more than 50% of those come from <1% of pixels, then it is considered to be noise-dominated and hence unusable.
| Quadrant | # 1 sec bins | Bins with >0 counts | Bins with >2000 counts | High rate bins dominated by noise | Noise dominated (total time) | Noise dominated (detector-on time) | Marked lightcurve |
|---|---|---|---|---|---|---|---|
| A | 7284 | 5372 | 3 | 3 | 0.04% | 0.06% | 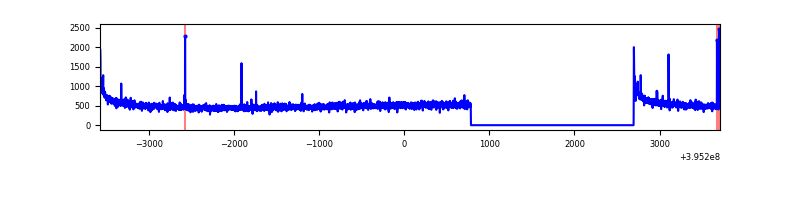 |
| B | 7284 | 5372 | 70 | 70 | 0.96% | 1.30% | 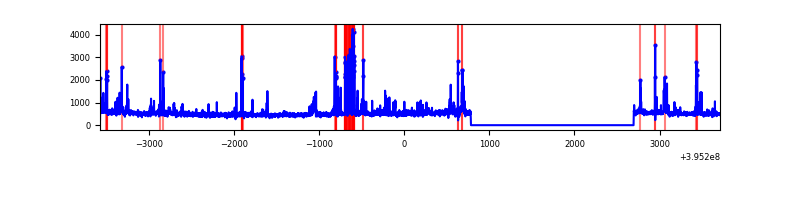 |
| C | 7284 | 5372 | 97 | 97 | 1.33% | 1.81% | 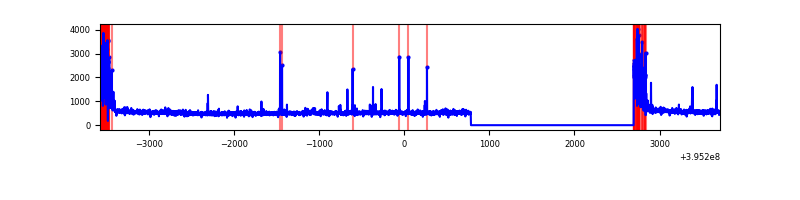 |
| D | 7284 | 5372 | 151 | 151 | 2.07% | 2.81% | 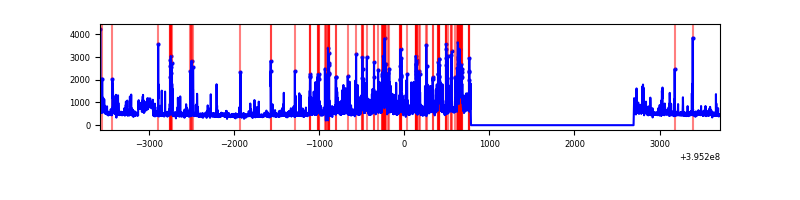 |
Top three noisy pixels from each quadrant. If the there are fewer than three noisy pixels in the level2.evt file, extra rows are filled as -1
| Pixel properties | Quadrant properties | ||||||
|---|---|---|---|---|---|---|---|
| Quadrant | DetID | PixID | Counts | Sigma | Mean | Median | Sigma |
| A | 10 | 83 | 209597 | 1617.4 | 642 | 629 | 129.2 |
| A | 9 | 143 | 27852 | 210.71 | 642 | 629 | 129.2 |
| A | 13 | 6 | 13250 | 97.69 | 642 | 629 | 129.2 |
| B | 5 | 255 | 350758 | 2945.54 | 639 | 622 | 118.9 |
| B | 0 | 189 | 84261 | 703.62 | 639 | 622 | 118.9 |
| B | 0 | 229 | 36961 | 305.7 | 639 | 622 | 118.9 |
| C | 0 | 10 | 435294 | 2963.01 | 638 | 645 | 146.7 |
| C | 15 | 214 | 246515 | 1676.1 | 638 | 645 | 146.7 |
| C | 14 | 254 | 7127 | 44.19 | 638 | 645 | 146.7 |
| D | 2 | 249 | 313552 | 2066.51 | 632 | 614 | 151.4 |
| D | 13 | 171 | 165677 | 1090.01 | 632 | 614 | 151.4 |
| D | 13 | 249 | 118299 | 777.14 | 632 | 614 | 151.4 |
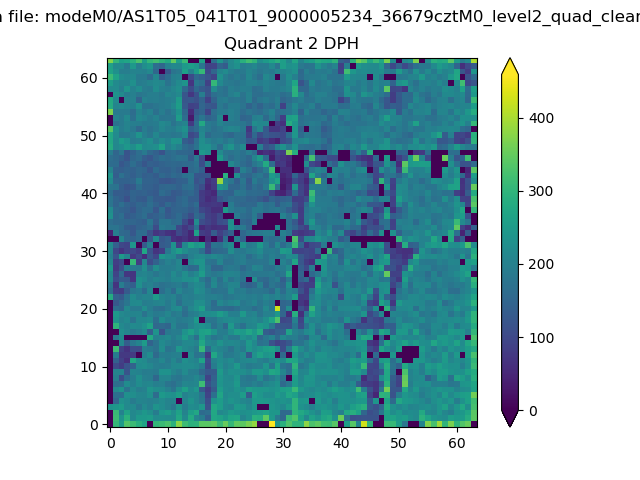
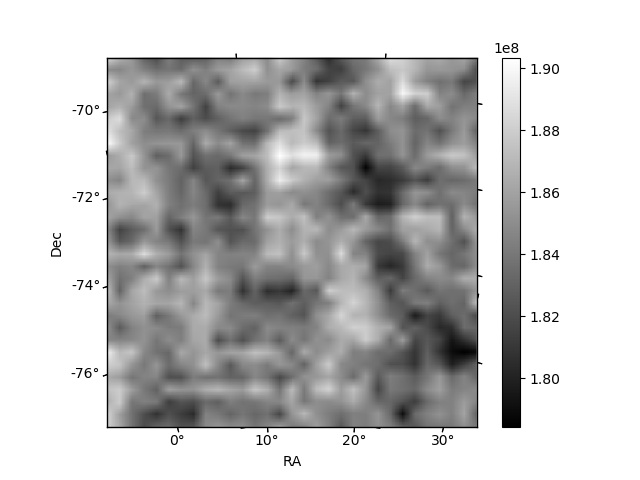
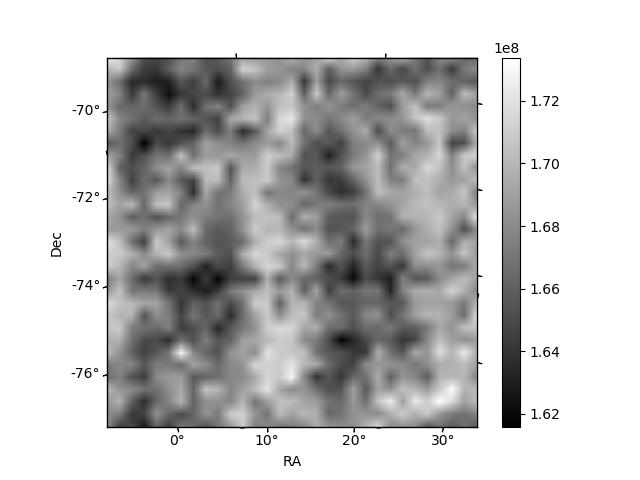
Histogram calculated using DETX and DETY for each event in the final _common_clean file
| Quadrant A | 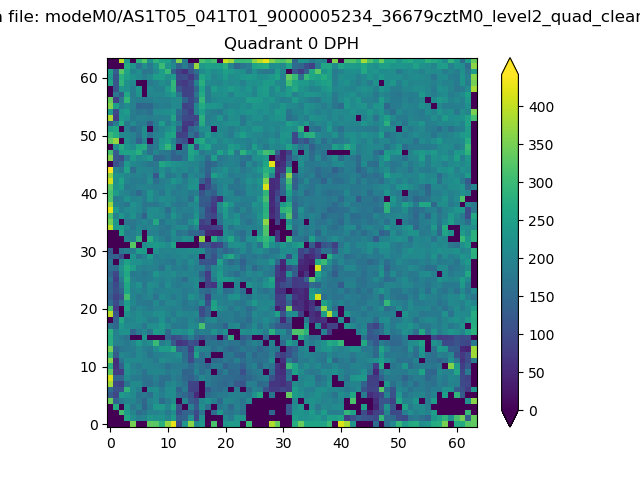 |
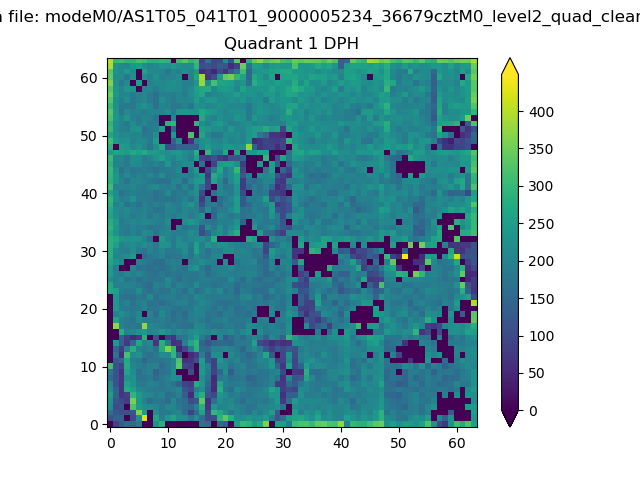 |
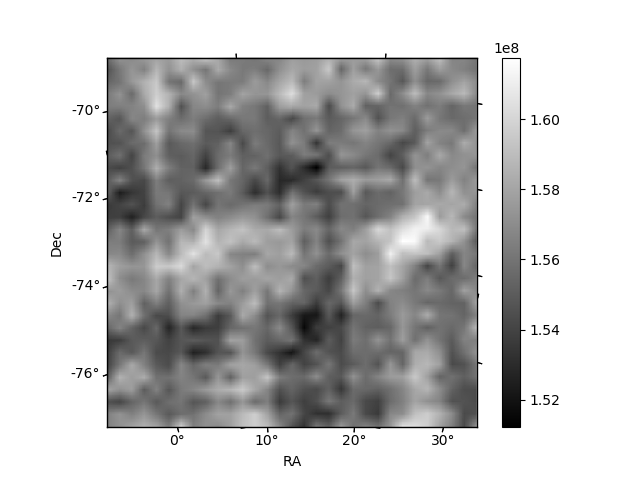
Quadrant B |
|---|---|---|---|
| Quadrant D | 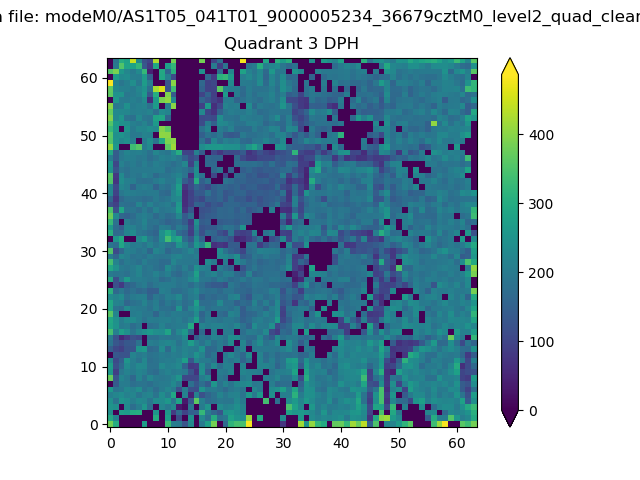 |
 |
Quadrant C |
| Plot type | Count rate plots | Images |
|---|---|---|
| Comparison with Poisson distribution Blue bars denote a histogram of data divided into 1 sec bins. Red curve is a Poisson curve with rate = median count rate of data. |
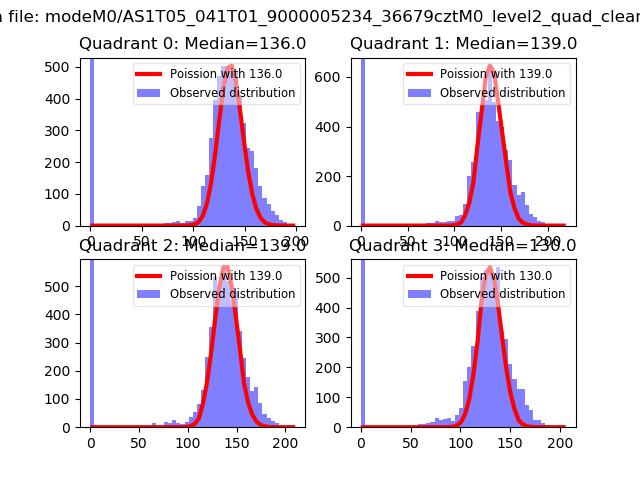 |
 |
| Quadrant-wise count rates Data is divided into 100 sec bins |
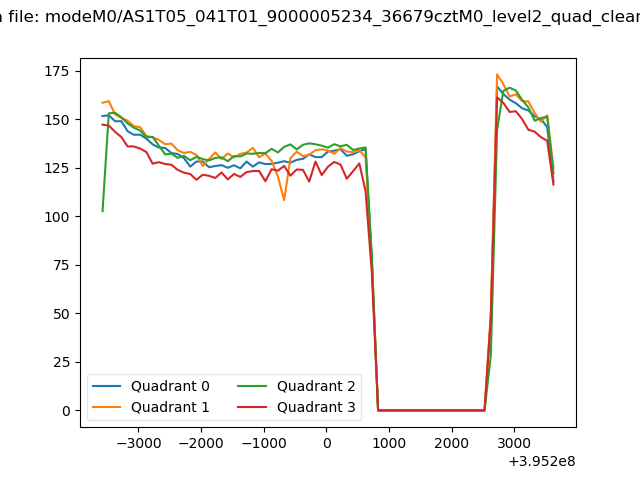 |
|
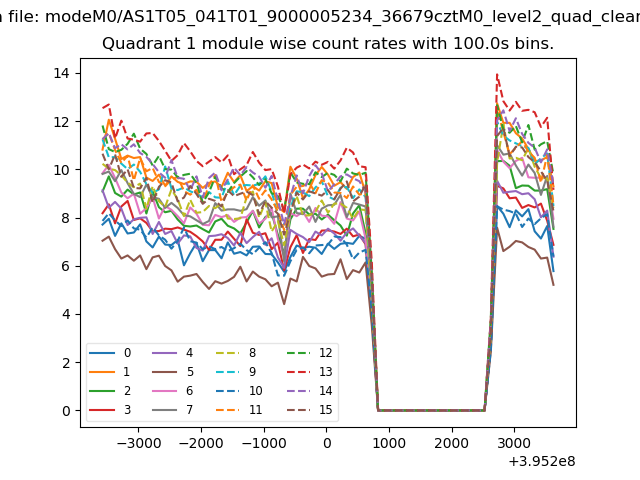
| Module-wise count rates for Quadrant A Data is divided into 100 sec bins |
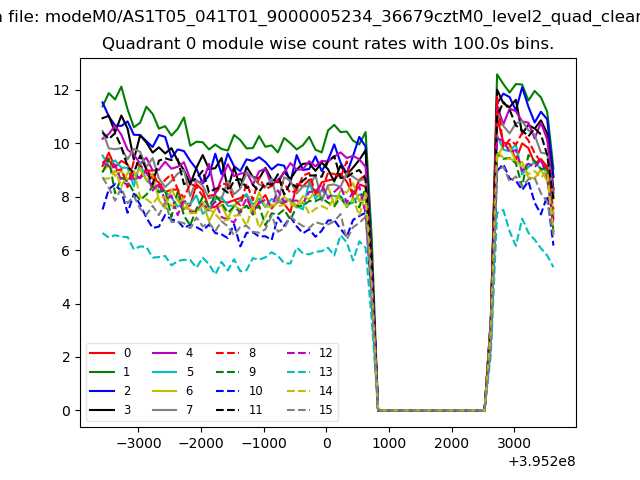 |
 |
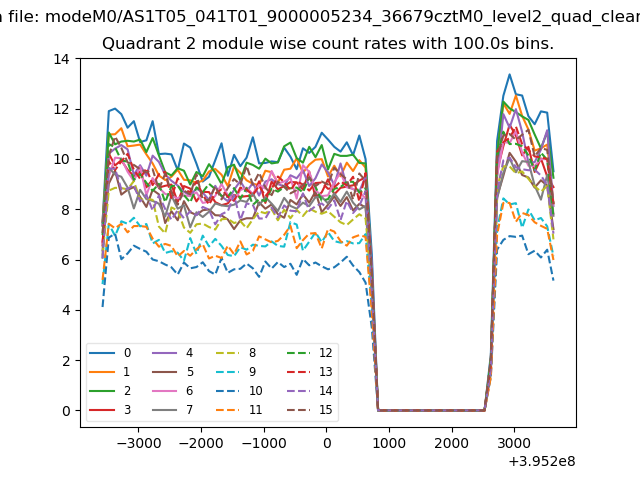
| Module-wise count rates for Quadrant B Data is divided into 100 sec bins |
 |
 |
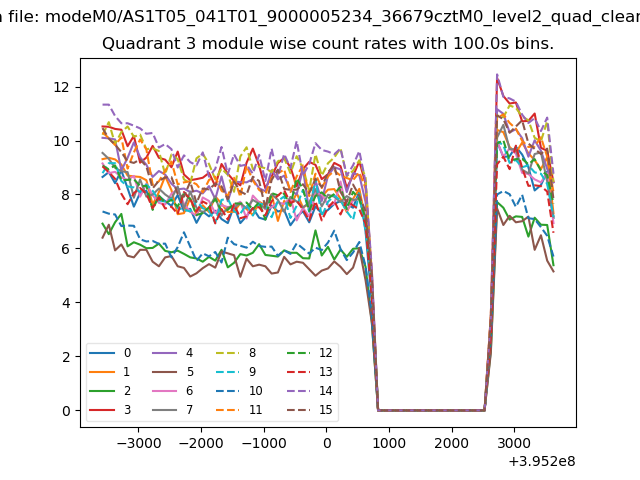
| Module-wise count rates for Quadrant C Data is divided into 100 sec bins |
 |
 |
| Module-wise count rates for Quadrant D Data is divided into 100 sec bins |
 |
 |
| Parameter | Plot |
|---|---|
| CZT HV Monitor | 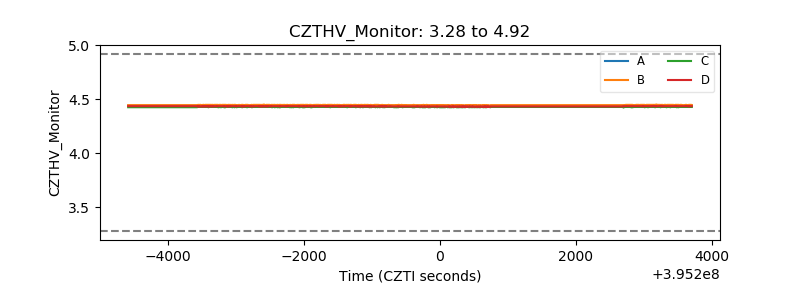 |
| D_VDD | 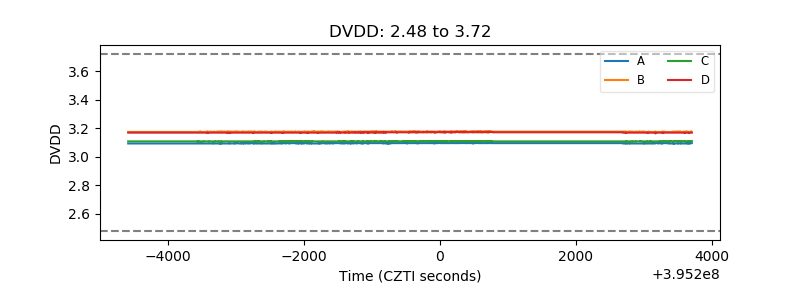 |
| Temperature 1 | 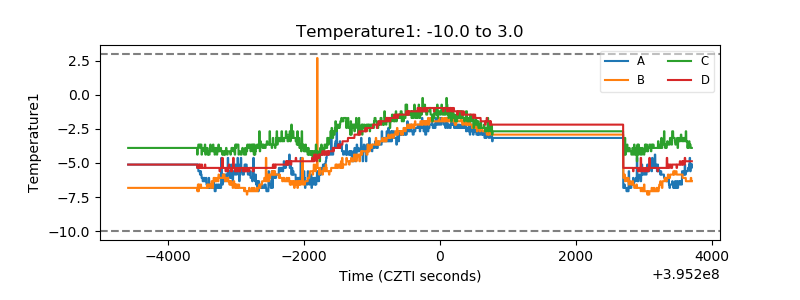 |
| Veto HV Monitor | 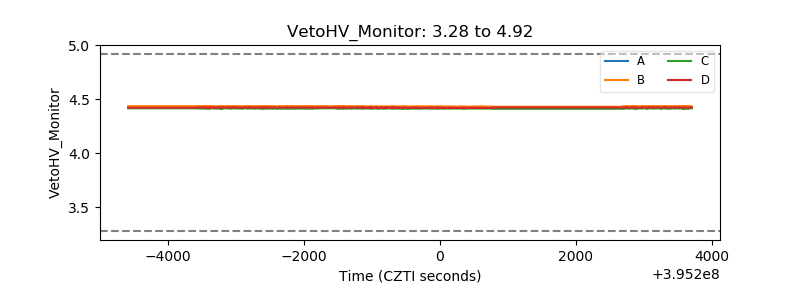 |
| Veto LLD | 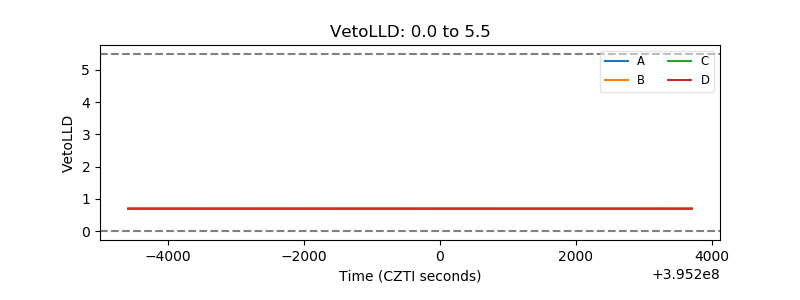 |
| Alpha Counter | 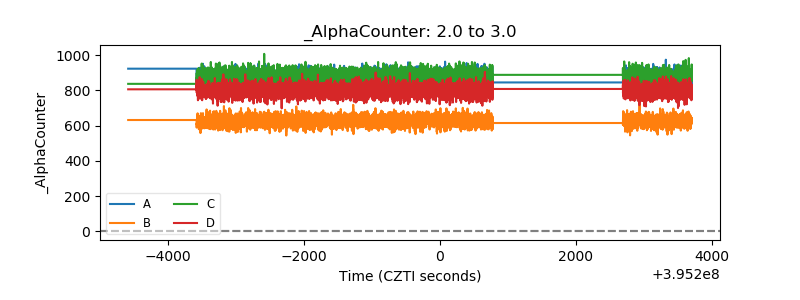 |
| _CPM_Rate | 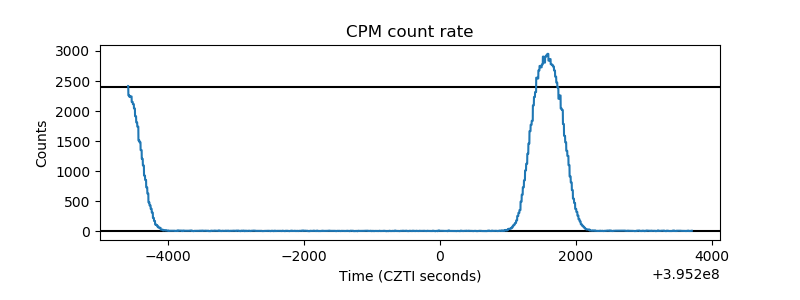 |
| CZT Counter | 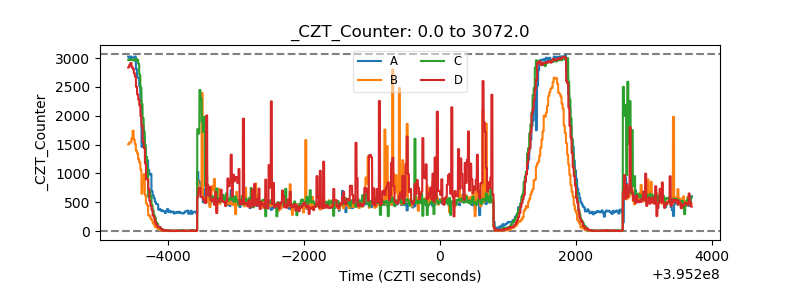 |
| +2.5 Volts monitor |  |
| +5 Volts monitor |  |
| _ROLL_ROT | 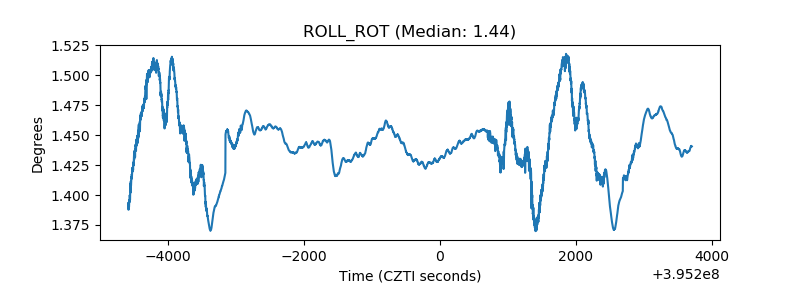 |
| _Roll_DEC |  |
| _Roll_RA | 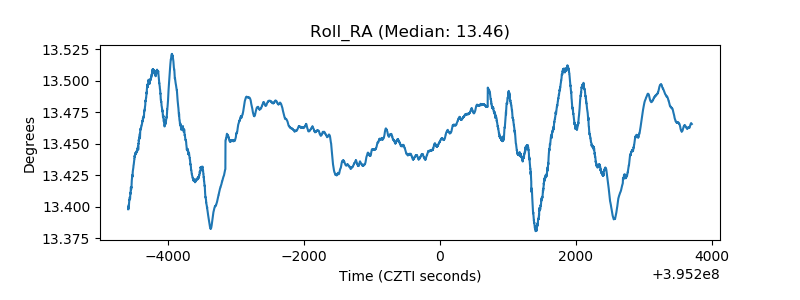 |
| Veto Counter | 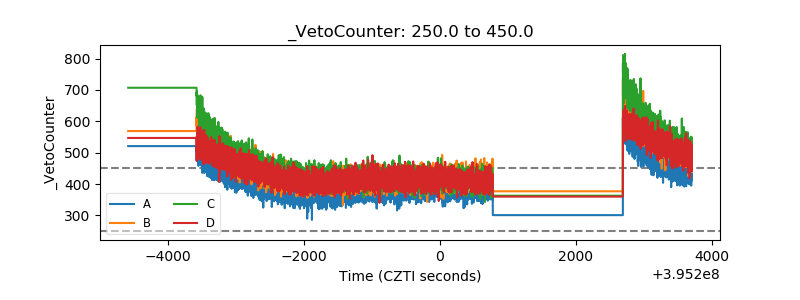 |