| Param | Original file | Final file |
|---|---|---|
| Filename | modeM0/AS1T05_041T01_9000005234_36680cztM0_level2.evt | modeM0/AS1T05_041T01_9000005234_36680cztM0_level2_quad_clean.evt |
| Size (bytes) | 482,883,840 | 107,559,360 |
| Size | 460.5 MB | 102.6 MB |
| Events in quadrant A | 2,730,557 | 742,594 |
| Events in quadrant B | 4,915,634 | 678,037 |
| Events in quadrant C | 3,179,119 | 758,812 |
| Events in quadrant D | 3,446,946 | 714,515 |
| Mode M9 | |||
|---|---|---|---|
| Quadrant | BADHDUFLAG | Total packets | Discarded packets |
| A | 0 | 31 | 0 |
| B | 0 | 31 | 0 |
| C | 0 | 31 | 0 |
| D | 0 | 32 | 0 |
| Mode M0 | |||
|---|---|---|---|
| Quadrant | BADHDUFLAG | Total packets | Discarded packets |
| A | 0 | 11148 | 3 |
| B | 0 | 17826 | 2 |
| C | 0 | 12413 | 2 |
| D | 0 | 13537 | 2 |
| Mode SS | |||
|---|---|---|---|
| Quadrant | BADHDUFLAG | Total packets | Discarded packets |
| A | 0 | 106 | 0 |
| B | 0 | 106 | 0 |
| C | 0 | 106 | 0 |
| D | 0 | 106 | 0 |
| Quadrant | Total seconds | Saturated seconds | Saturation percentage |
|---|---|---|---|
| A | 5182 | 11 | 0.212273% |
| B | 5182 | 1098 | 21.188730% |
| C | 5182 | 123 | 2.373601% |
| D | 5182 | 164 | 3.164801% |
Noise dominated data is calculated using 1-second bins in cleaned event files. If a bin has >2000 counts, and if more than 50% of those come from <1% of pixels, then it is considered to be noise-dominated and hence unusable.
| Quadrant | # 1 sec bins | Bins with >0 counts | Bins with >2000 counts | High rate bins dominated by noise | Noise dominated (total time) | Noise dominated (detector-on time) | Marked lightcurve |
|---|---|---|---|---|---|---|---|
| A | 7215 | 5183 | 3 | 3 | 0.04% | 0.06% | 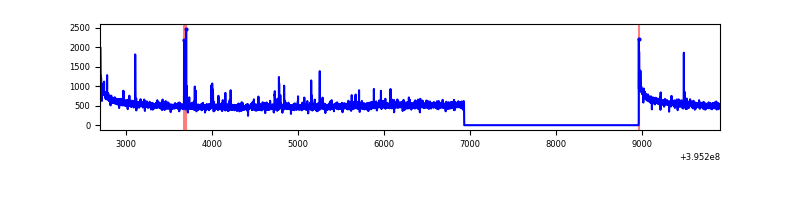 |
| B | 7215 | 5183 | 802 | 802 | 11.12% | 15.47% | 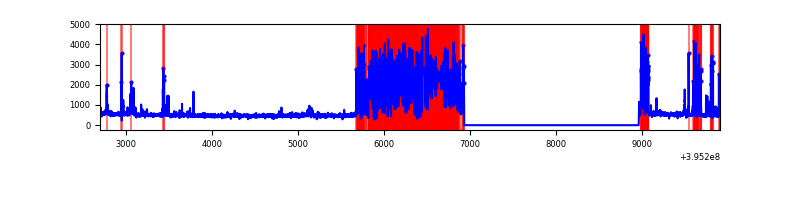 |
| C | 7215 | 5183 | 77 | 77 | 1.07% | 1.49% | 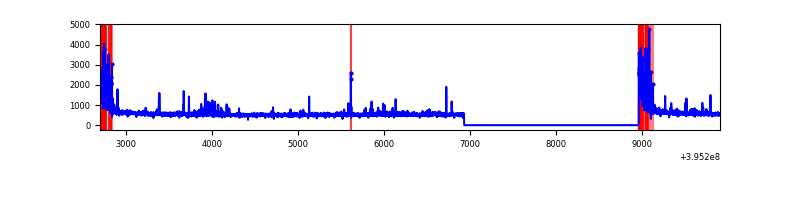 |
| D | 7215 | 5183 | 149 | 149 | 2.07% | 2.87% | 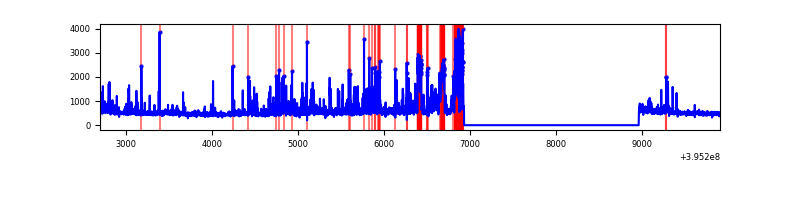 |
Top three noisy pixels from each quadrant. If the there are fewer than three noisy pixels in the level2.evt file, extra rows are filled as -1
| Pixel properties | Quadrant properties | ||||||
|---|---|---|---|---|---|---|---|
| Quadrant | DetID | PixID | Counts | Sigma | Mean | Median | Sigma |
| A | 10 | 83 | 203839 | 1609.85 | 638 | 627 | 126.2 |
| A | 9 | 143 | 49217 | 384.93 | 638 | 627 | 126.2 |
| A | 13 | 254 | 8587 | 63.06 | 638 | 627 | 126.2 |
| B | 5 | 255 | 1887020 | 17724.79 | 571 | 556 | 106.4 |
| B | 0 | 229 | 685626 | 6436.76 | 571 | 556 | 106.4 |
| B | 0 | 190 | 45212 | 419.58 | 571 | 556 | 106.4 |
| C | 0 | 10 | 437697 | 3009.23 | 637 | 643 | 145.2 |
| C | 15 | 214 | 237188 | 1628.68 | 637 | 643 | 145.2 |
| C | 14 | 254 | 12844 | 84.01 | 637 | 643 | 145.2 |
| D | 13 | 36 | 430593 | 2872.03 | 633 | 618 | 149.7 |
| D | 2 | 249 | 131530 | 874.43 | 633 | 618 | 149.7 |
| D | 13 | 171 | 110468 | 733.75 | 633 | 618 | 149.7 |
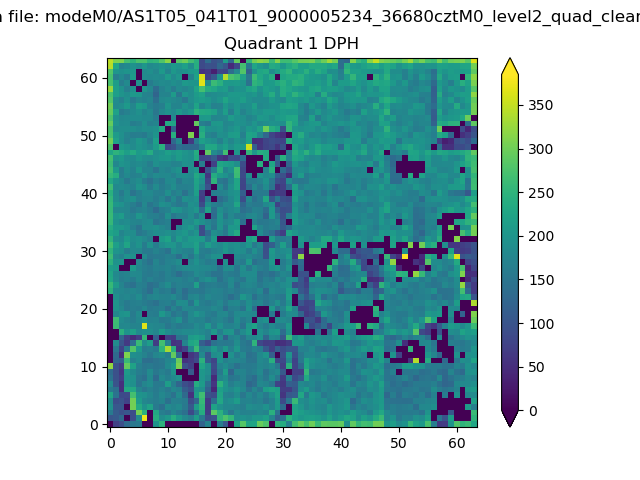
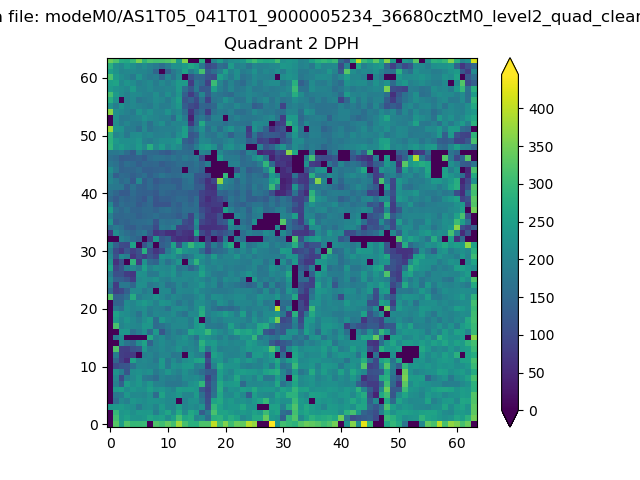
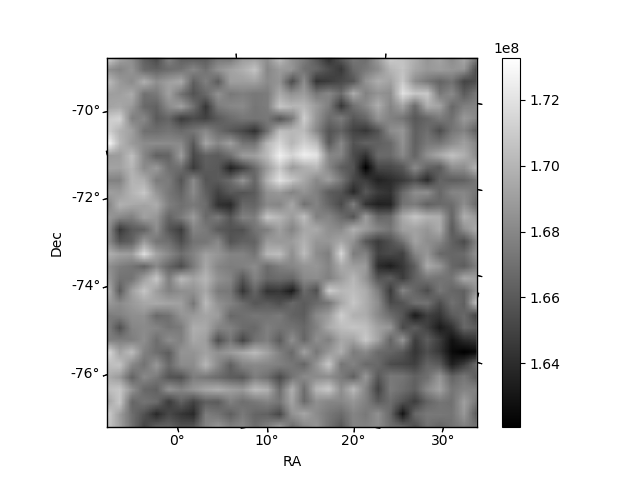
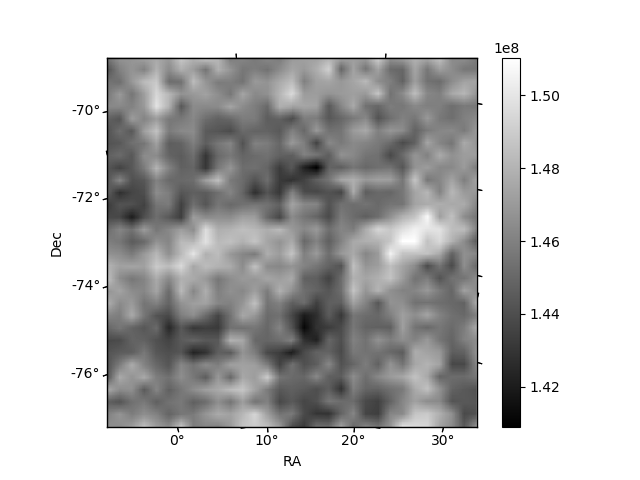
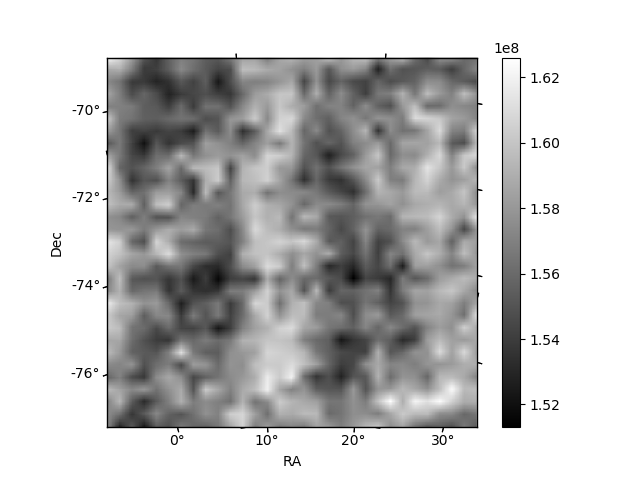
Histogram calculated using DETX and DETY for each event in the final _common_clean file
| Quadrant A |  |
 |
Quadrant B |
|---|---|---|---|
| Quadrant D |  |
 |
Quadrant C |
| Plot type | Count rate plots | Images |
|---|---|---|
| Comparison with Poisson distribution Blue bars denote a histogram of data divided into 1 sec bins. Red curve is a Poisson curve with rate = median count rate of data. |
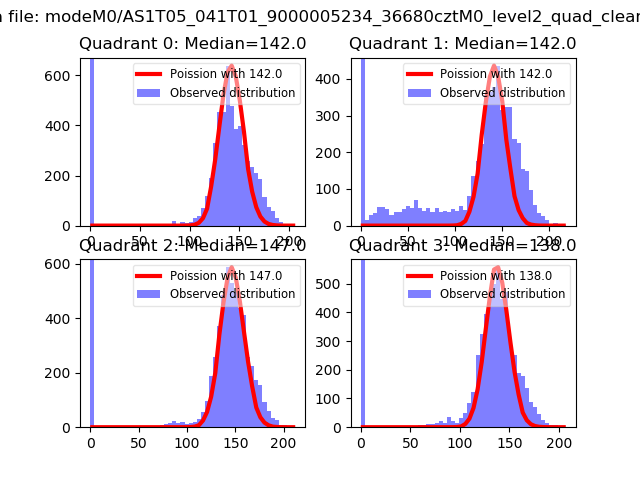 |
 |
| Quadrant-wise count rates Data is divided into 100 sec bins |
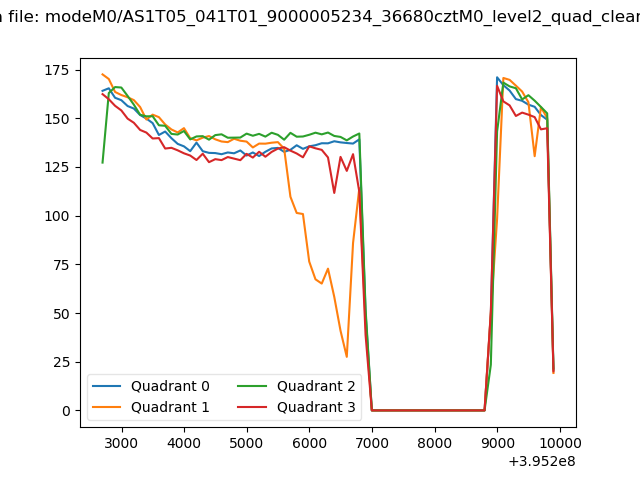 |
|
| Module-wise count rates for Quadrant A Data is divided into 100 sec bins |
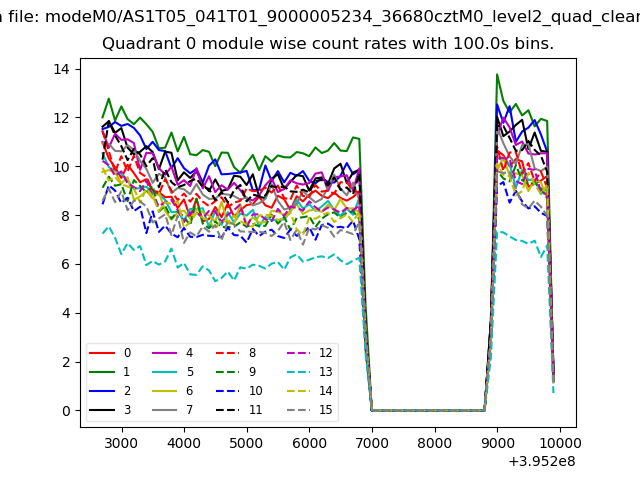 |
 |
| Module-wise count rates for Quadrant B Data is divided into 100 sec bins |
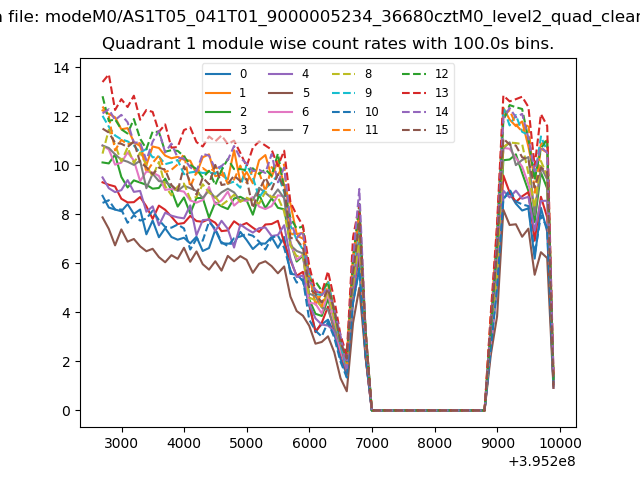 |
 |
| Module-wise count rates for Quadrant C Data is divided into 100 sec bins |
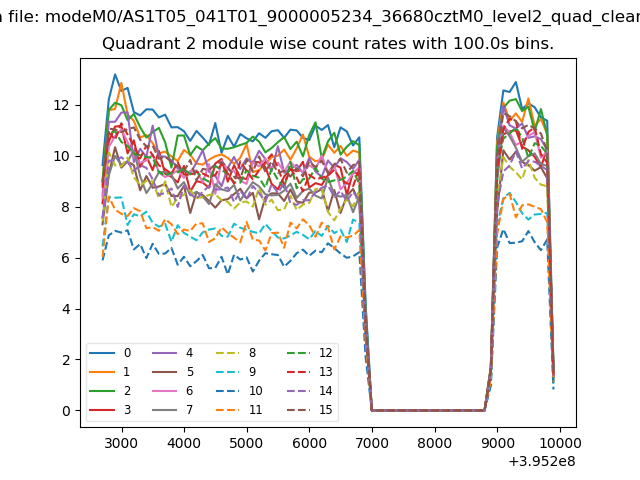 |
 |
| Module-wise count rates for Quadrant D Data is divided into 100 sec bins |
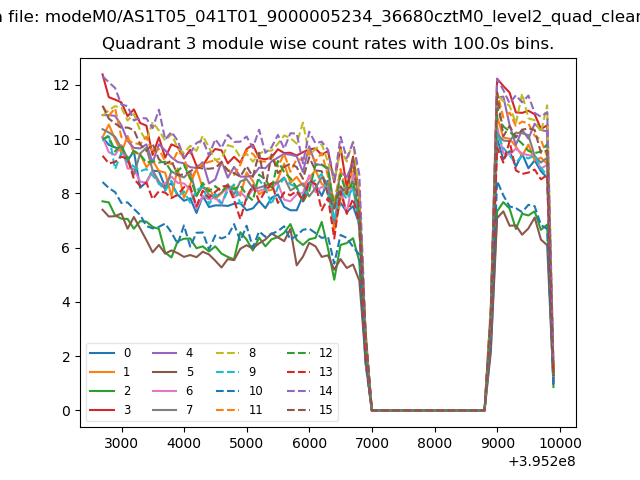 |
 |
| Parameter | Plot |
|---|---|
| CZT HV Monitor | 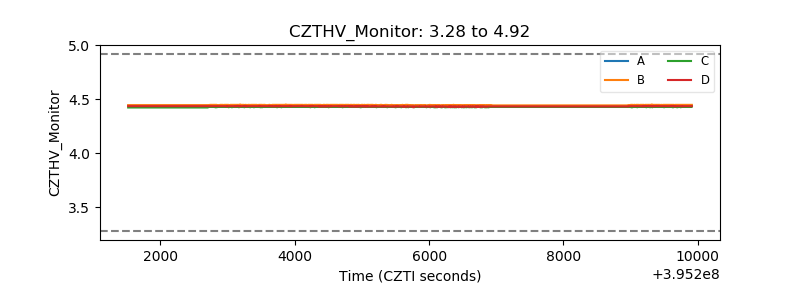 |
| D_VDD | 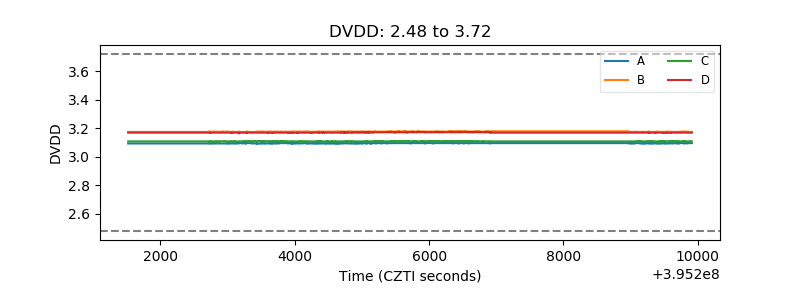 |
| Temperature 1 | 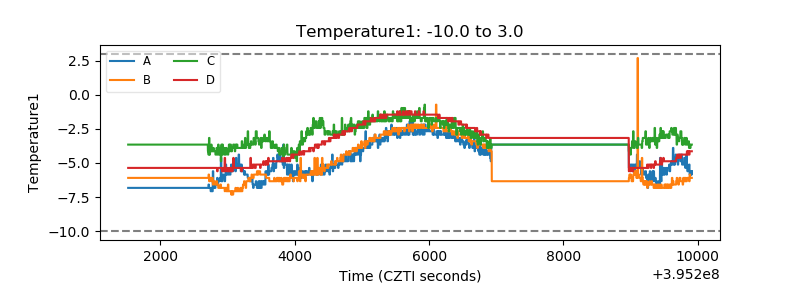 |
| Veto HV Monitor | 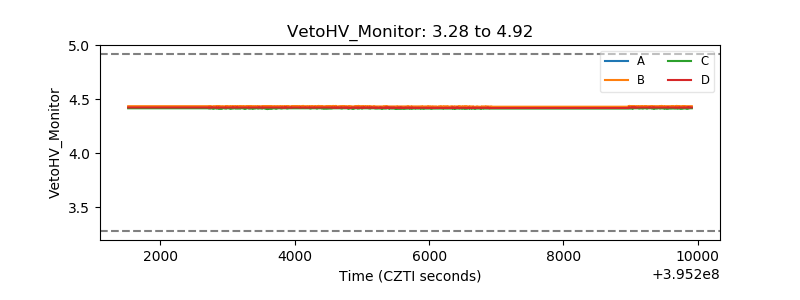 |
| Veto LLD | 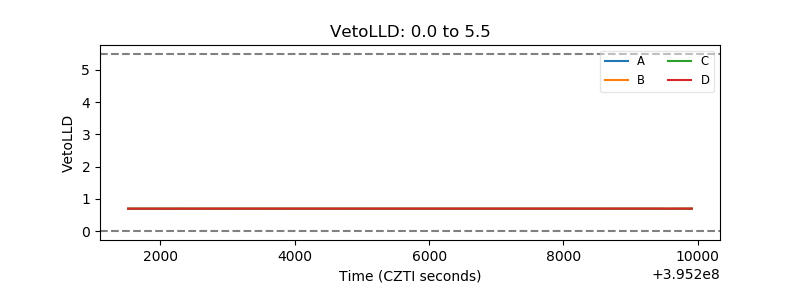 |
| Alpha Counter | 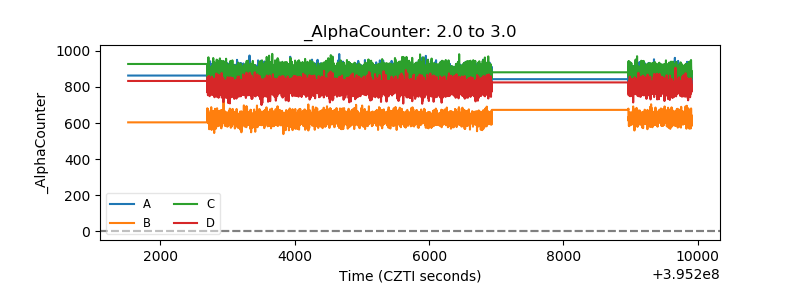 |
| _CPM_Rate | 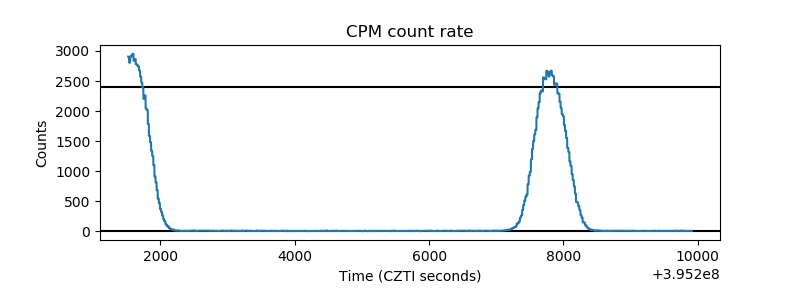 |
| CZT Counter | 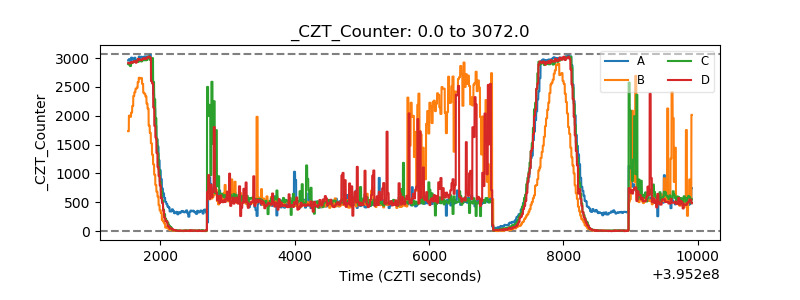 |
| +2.5 Volts monitor |  |
| +5 Volts monitor |  |
| _ROLL_ROT | 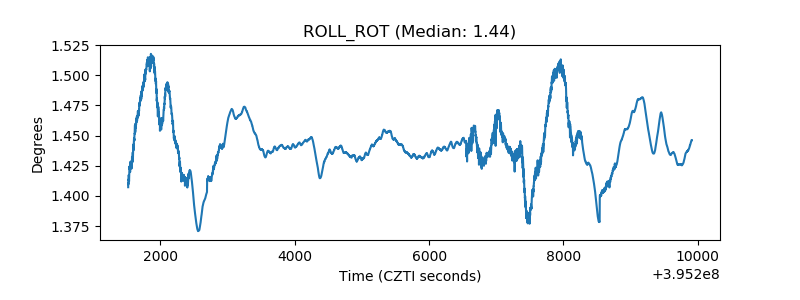 |
| _Roll_DEC | 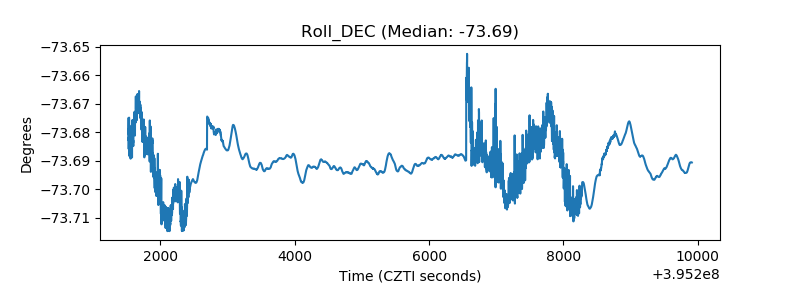 |
| _Roll_RA | 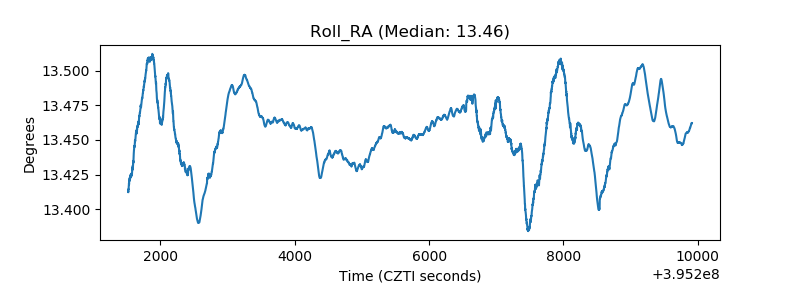 |
| Veto Counter | 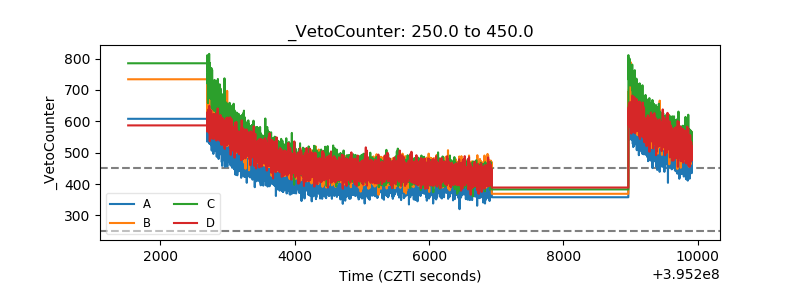 |