| Param | Original file | Final file |
|---|---|---|
| Filename | modeM0/AS1T05_041T01_9000005234_36681cztM0_level2.evt | modeM0/AS1T05_041T01_9000005234_36681cztM0_level2_quad_clean.evt |
| Size (bytes) | 403,001,280 | 105,802,560 |
| Size | 384.3 MB | 100.9 MB |
| Events in quadrant A | 2,593,674 | 714,578 |
| Events in quadrant B | 3,295,682 | 716,274 |
| Events in quadrant C | 3,004,207 | 731,506 |
| Events in quadrant D | 2,975,485 | 695,640 |
| Mode M9 | |||
|---|---|---|---|
| Quadrant | BADHDUFLAG | Total packets | Discarded packets |
| A | 0 | 22 | 0 |
| B | 0 | 22 | 0 |
| C | 0 | 22 | 0 |
| D | 0 | 23 | 0 |
| Mode M0 | |||
|---|---|---|---|
| Quadrant | BADHDUFLAG | Total packets | Discarded packets |
| A | 0 | 10556 | 3 |
| B | 0 | 12792 | 2 |
| C | 0 | 11747 | 2 |
| D | 0 | 11948 | 2 |
| Mode SS | |||
|---|---|---|---|
| Quadrant | BADHDUFLAG | Total packets | Discarded packets |
| A | 0 | 100 | 0 |
| B | 0 | 100 | 0 |
| C | 0 | 100 | 0 |
| D | 0 | 100 | 0 |
| Quadrant | Total seconds | Saturated seconds | Saturation percentage |
|---|---|---|---|
| A | 4943 | 11 | 0.222537% |
| B | 4943 | 225 | 4.551892% |
| C | 4943 | 112 | 2.265830% |
| D | 4943 | 58 | 1.173376% |
Noise dominated data is calculated using 1-second bins in cleaned event files. If a bin has >2000 counts, and if more than 50% of those come from <1% of pixels, then it is considered to be noise-dominated and hence unusable.
| Quadrant | # 1 sec bins | Bins with >0 counts | Bins with >2000 counts | High rate bins dominated by noise | Noise dominated (total time) | Noise dominated (detector-on time) | Marked lightcurve |
|---|---|---|---|---|---|---|---|
| A | 7066 | 4944 | 2 | 2 | 0.03% | 0.04% | 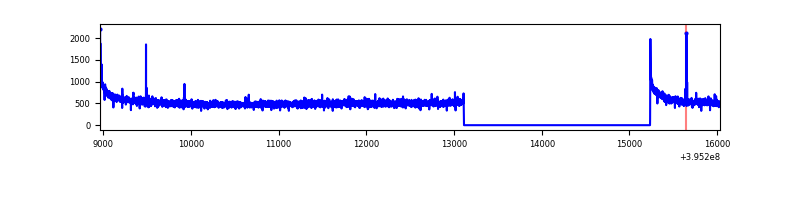 |
| B | 7066 | 4944 | 140 | 140 | 1.98% | 2.83% | 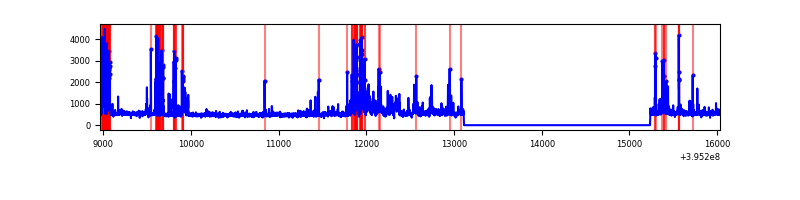 |
| C | 7066 | 4944 | 66 | 66 | 0.93% | 1.33% | 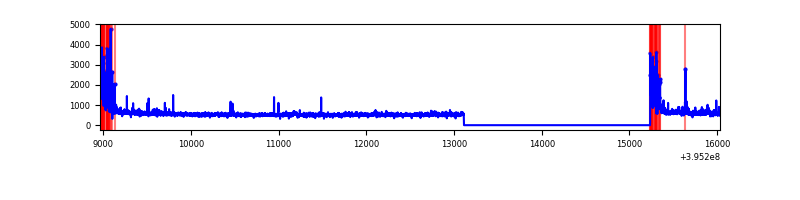 |
| D | 7066 | 4944 | 46 | 46 | 0.65% | 0.93% | 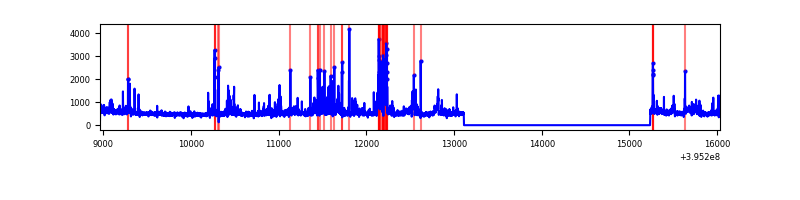 |
Top three noisy pixels from each quadrant. If the there are fewer than three noisy pixels in the level2.evt file, extra rows are filled as -1
| Pixel properties | Quadrant properties | ||||||
|---|---|---|---|---|---|---|---|
| Quadrant | DetID | PixID | Counts | Sigma | Mean | Median | Sigma |
| A | 10 | 83 | 201422 | 1661.59 | 612 | 601 | 120.9 |
| A | 9 | 143 | 11860 | 93.16 | 612 | 601 | 120.9 |
| A | 13 | 254 | 8589 | 66.09 | 612 | 601 | 120.9 |
| B | 5 | 255 | 531105 | 4724.67 | 596 | 580 | 112.3 |
| B | 0 | 189 | 332600 | 2956.85 | 596 | 580 | 112.3 |
| B | 0 | 221 | 25289 | 220.05 | 596 | 580 | 112.3 |
| C | 0 | 10 | 363654 | 2608.53 | 608 | 614 | 139.2 |
| C | 15 | 214 | 226927 | 1626.11 | 608 | 614 | 139.2 |
| C | 14 | 254 | 13571 | 93.1 | 608 | 614 | 139.2 |
| D | 2 | 153 | 163689 | 1125.48 | 609 | 595 | 144.9 |
| D | 13 | 171 | 139985 | 961.9 | 609 | 595 | 144.9 |
| D | 12 | 227 | 59634 | 407.42 | 609 | 595 | 144.9 |
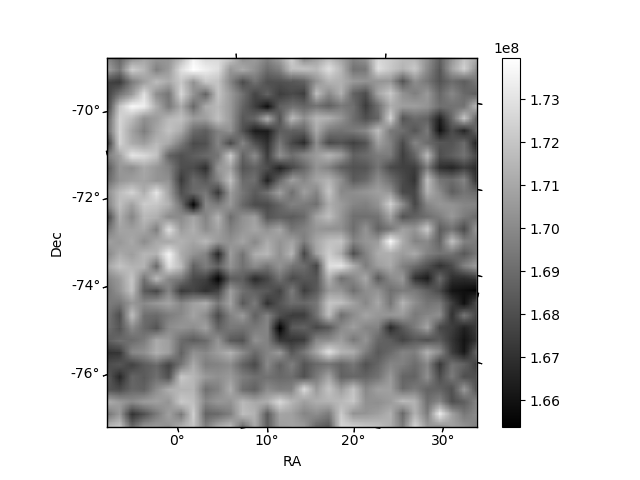
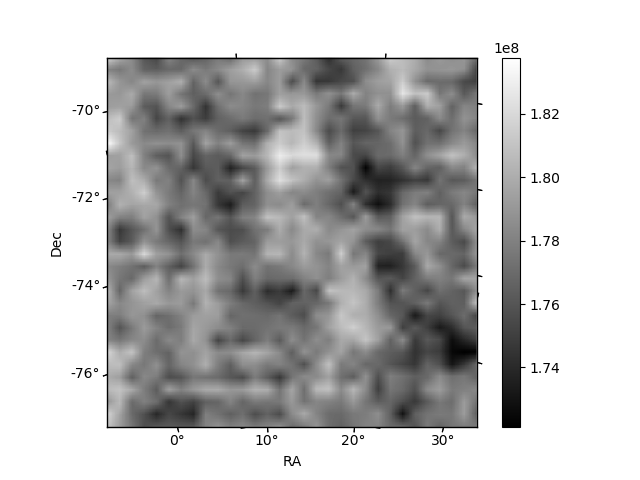
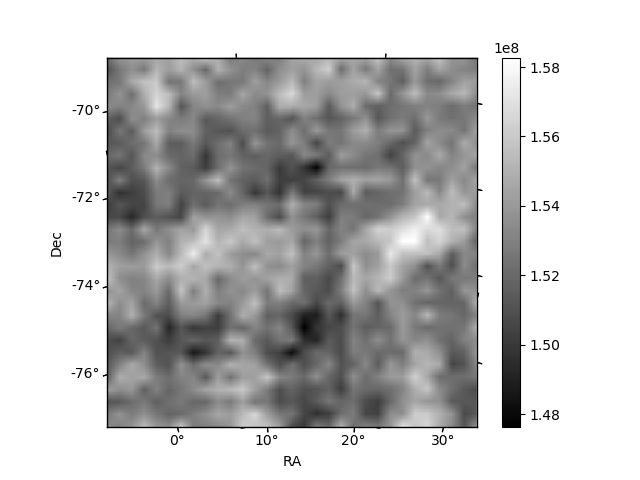
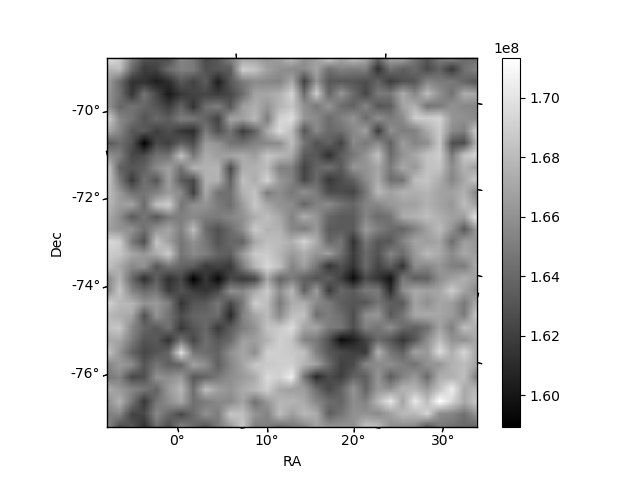
Histogram calculated using DETX and DETY for each event in the final _common_clean file
| Quadrant A | 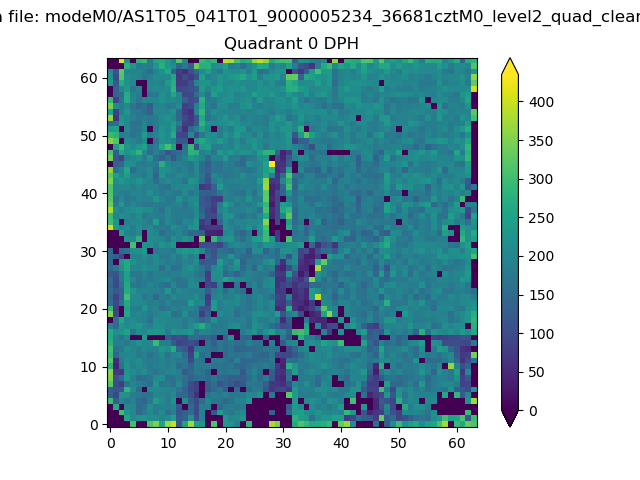 |
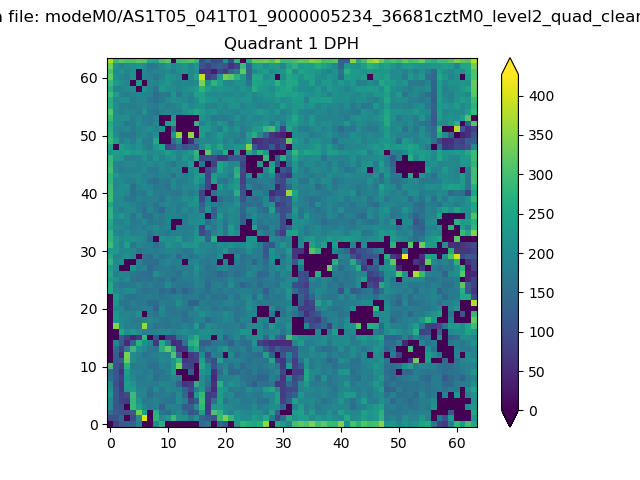 |
Quadrant B |
|---|---|---|---|
| Quadrant D |  |
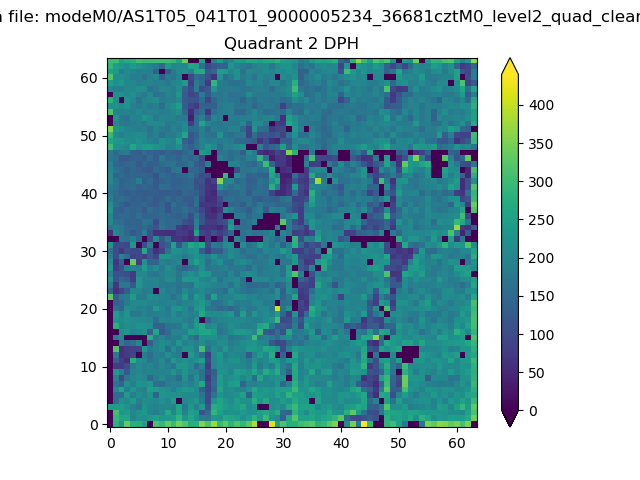 |
Quadrant C |
| Plot type | Count rate plots | Images |
|---|---|---|
| Comparison with Poisson distribution Blue bars denote a histogram of data divided into 1 sec bins. Red curve is a Poisson curve with rate = median count rate of data. |
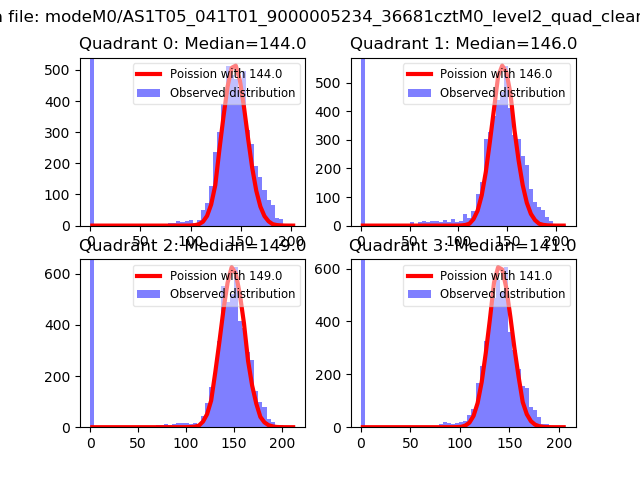 |
 |
| Quadrant-wise count rates Data is divided into 100 sec bins |
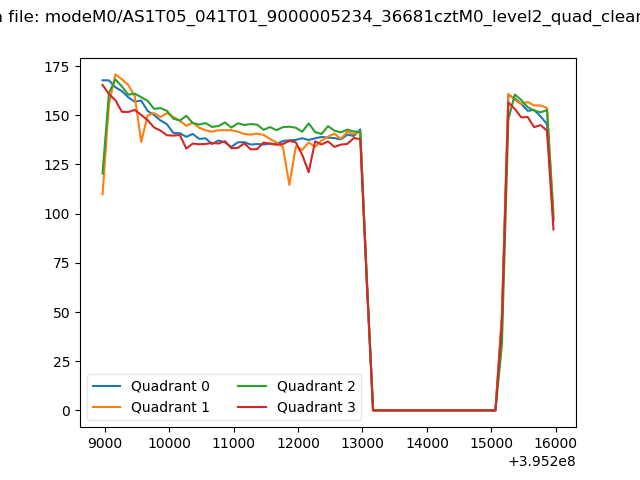 |
|
| Module-wise count rates for Quadrant A Data is divided into 100 sec bins |
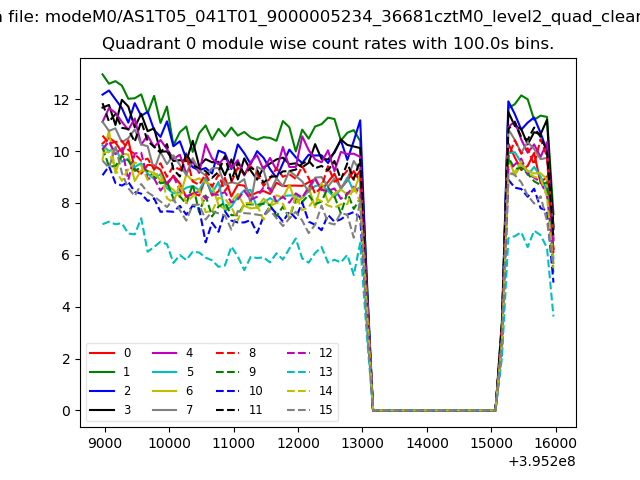 |
 |
| Module-wise count rates for Quadrant B Data is divided into 100 sec bins |
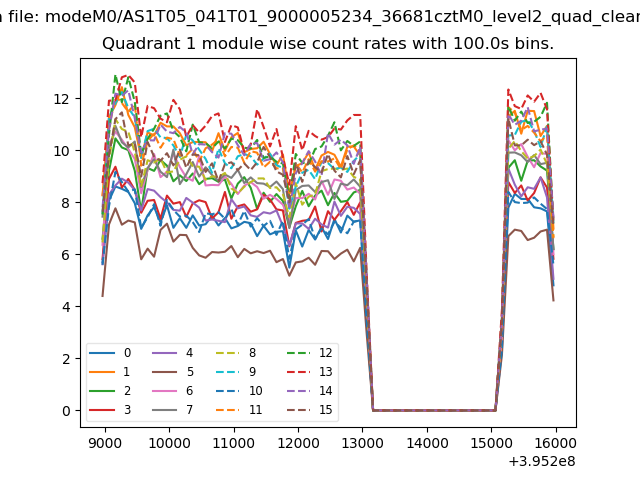 |
 |
| Module-wise count rates for Quadrant C Data is divided into 100 sec bins |
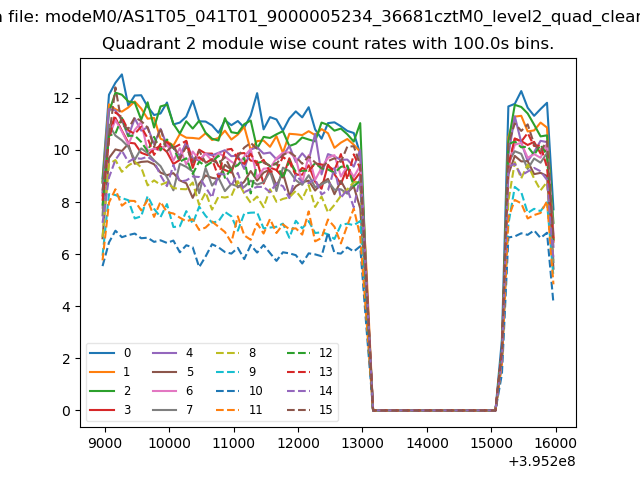 |
 |
| Module-wise count rates for Quadrant D Data is divided into 100 sec bins |
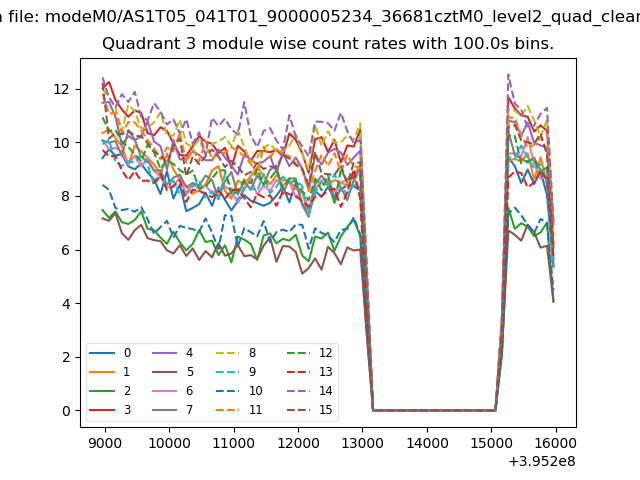 |
 |
| Parameter | Plot |
|---|---|
| CZT HV Monitor | 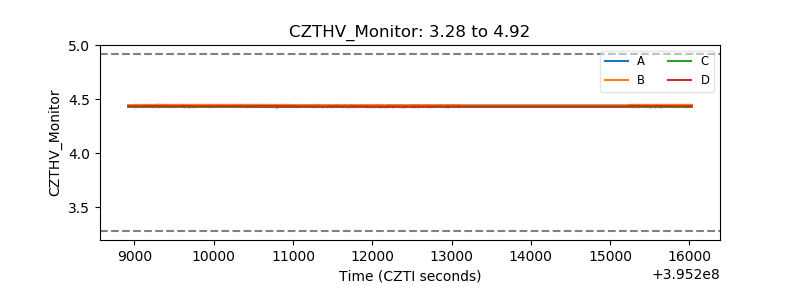 |
| D_VDD |  |
| Temperature 1 | 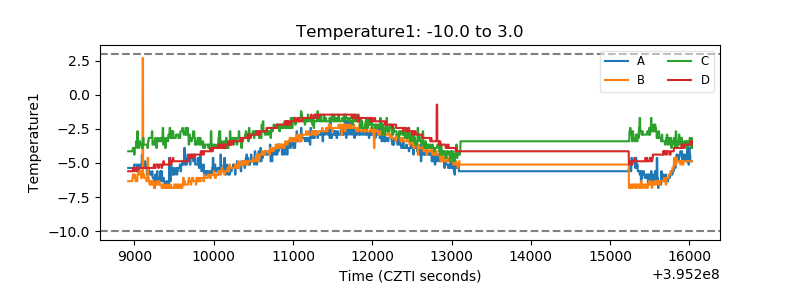 |
| Veto HV Monitor |  |
| Veto LLD | 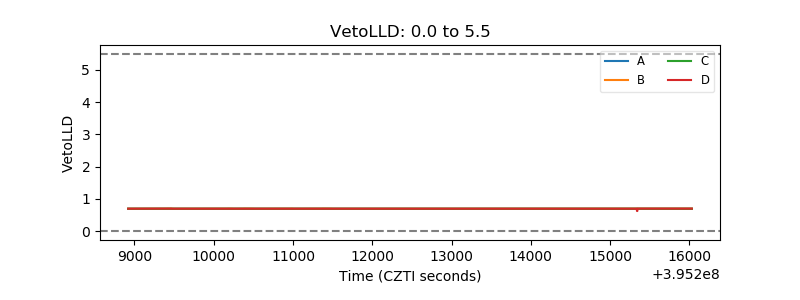 |
| Alpha Counter | 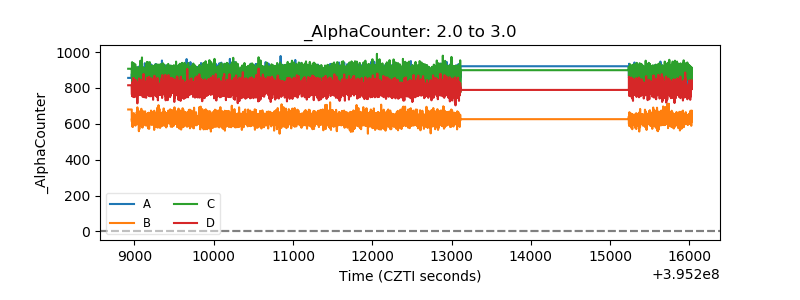 |
| _CPM_Rate | 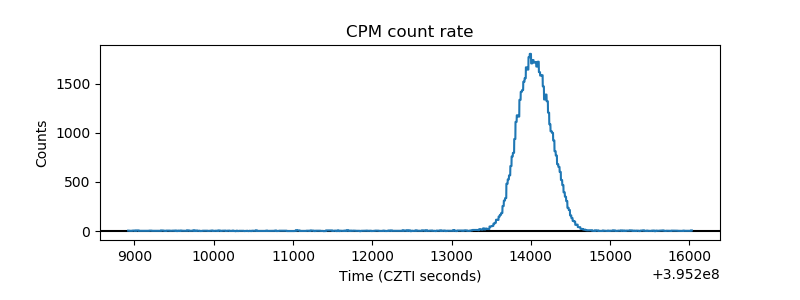 |
| CZT Counter | 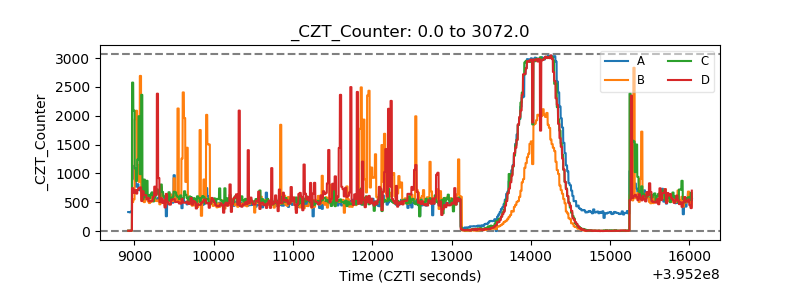 |
| +2.5 Volts monitor |  |
| +5 Volts monitor |  |
| _ROLL_ROT | 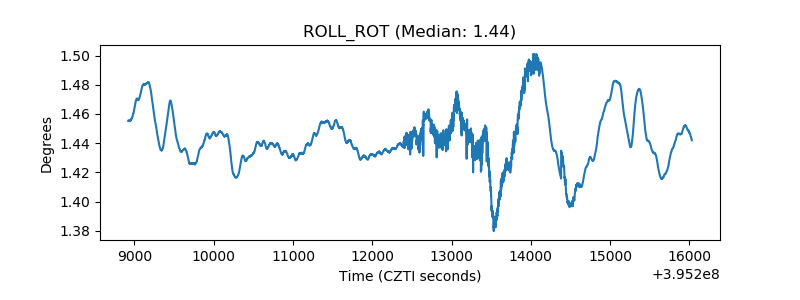 |
| _Roll_DEC | 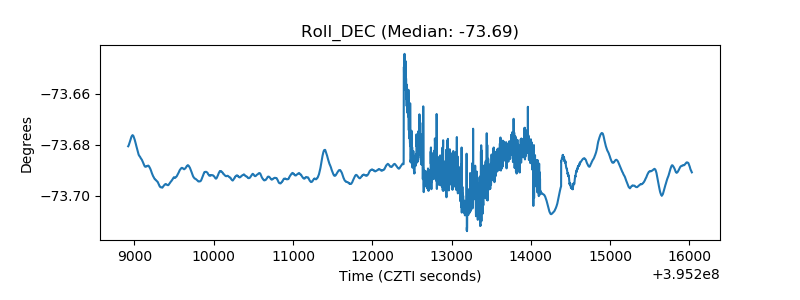 |
| _Roll_RA | 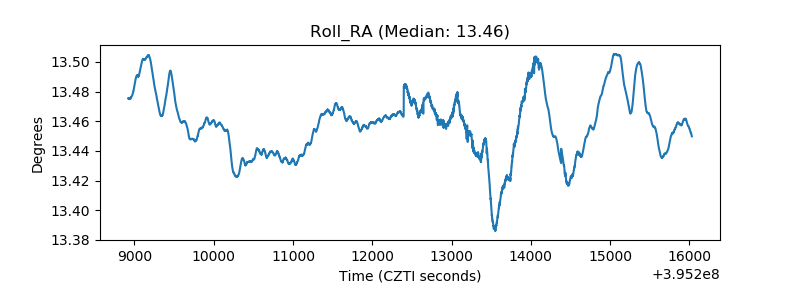 |
| Veto Counter | 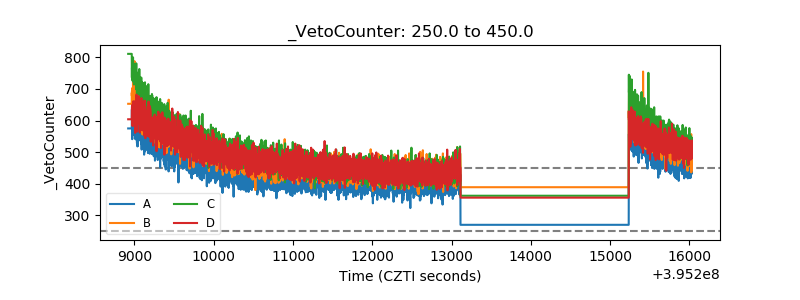 |