| Param | Original file | Final file |
|---|---|---|
| Filename | modeM0/AS1T05_041T01_9000005234_36682cztM0_level2.evt | modeM0/AS1T05_041T01_9000005234_36682cztM0_level2_quad_clean.evt |
| Size (bytes) | 401,561,280 | 102,487,680 |
| Size | 383.0 MB | 97.7 MB |
| Events in quadrant A | 2,593,144 | 691,507 |
| Events in quadrant B | 3,218,741 | 698,084 |
| Events in quadrant C | 2,900,664 | 703,460 |
| Events in quadrant D | 3,113,685 | 665,034 |
| Mode M9 | |||
|---|---|---|---|
| Quadrant | BADHDUFLAG | Total packets | Discarded packets |
| A | 0 | 23 | 0 |
| B | 0 | 23 | 0 |
| C | 0 | 23 | 0 |
| D | 0 | 24 | 0 |
| Mode M0 | |||
|---|---|---|---|
| Quadrant | BADHDUFLAG | Total packets | Discarded packets |
| A | 0 | 10650 | 3 |
| B | 0 | 12723 | 2 |
| C | 0 | 11435 | 2 |
| D | 0 | 12346 | 2 |
| Mode SS | |||
|---|---|---|---|
| Quadrant | BADHDUFLAG | Total packets | Discarded packets |
| A | 0 | 100 | 0 |
| B | 0 | 100 | 0 |
| C | 0 | 100 | 0 |
| D | 0 | 100 | 0 |
| Quadrant | Total seconds | Saturated seconds | Saturation percentage |
|---|---|---|---|
| A | 4933 | 7 | 0.141901% |
| B | 4933 | 82 | 1.662274% |
| C | 4933 | 95 | 1.925806% |
| D | 4933 | 142 | 2.878573% |
Noise dominated data is calculated using 1-second bins in cleaned event files. If a bin has >2000 counts, and if more than 50% of those come from <1% of pixels, then it is considered to be noise-dominated and hence unusable.
| Quadrant | # 1 sec bins | Bins with >0 counts | Bins with >2000 counts | High rate bins dominated by noise | Noise dominated (total time) | Noise dominated (detector-on time) | Marked lightcurve |
|---|---|---|---|---|---|---|---|
| A | 7056 | 4934 | 1 | 1 | 0.01% | 0.02% | 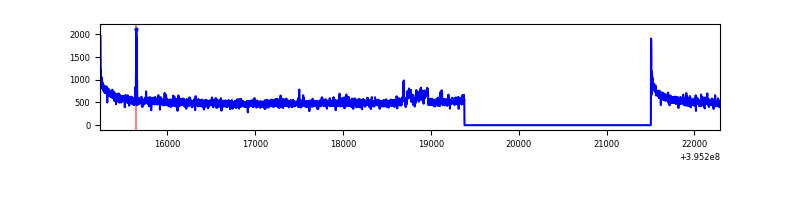 |
| B | 7056 | 4934 | 45 | 45 | 0.64% | 0.91% | 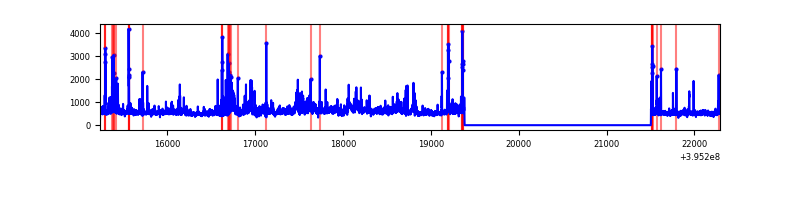 |
| C | 7056 | 4934 | 62 | 62 | 0.88% | 1.26% | 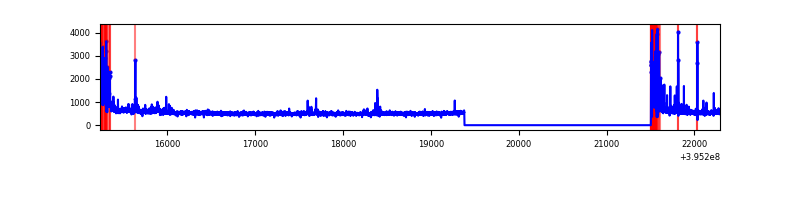 |
| D | 7056 | 4934 | 124 | 124 | 1.76% | 2.51% | 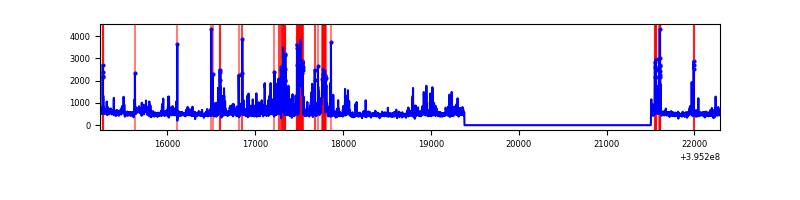 |
Top three noisy pixels from each quadrant. If the there are fewer than three noisy pixels in the level2.evt file, extra rows are filled as -1
| Pixel properties | Quadrant properties | ||||||
|---|---|---|---|---|---|---|---|
| Quadrant | DetID | PixID | Counts | Sigma | Mean | Median | Sigma |
| A | 10 | 83 | 204816 | 1708.02 | 600 | 589 | 119.6 |
| A | 15 | 223 | 51016 | 421.74 | 600 | 589 | 119.6 |
| A | 13 | 254 | 8687 | 67.73 | 600 | 589 | 119.6 |
| B | 0 | 189 | 492022 | 4467.52 | 588 | 574 | 110.0 |
| B | 5 | 255 | 276598 | 2509.2 | 588 | 574 | 110.0 |
| B | 0 | 190 | 63205 | 569.35 | 588 | 574 | 110.0 |
| C | 0 | 10 | 334873 | 2476.45 | 589 | 594 | 135.0 |
| C | 15 | 214 | 227295 | 1679.47 | 589 | 594 | 135.0 |
| C | 14 | 254 | 13882 | 98.44 | 589 | 594 | 135.0 |
| D | 13 | 249 | 267413 | 1881.68 | 588 | 573 | 141.8 |
| D | 13 | 171 | 154081 | 1082.5 | 588 | 573 | 141.8 |
| D | 7 | 38 | 98731 | 692.18 | 588 | 573 | 141.8 |
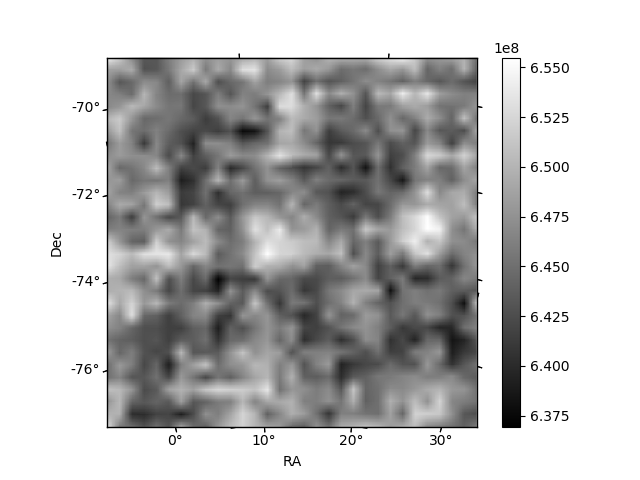
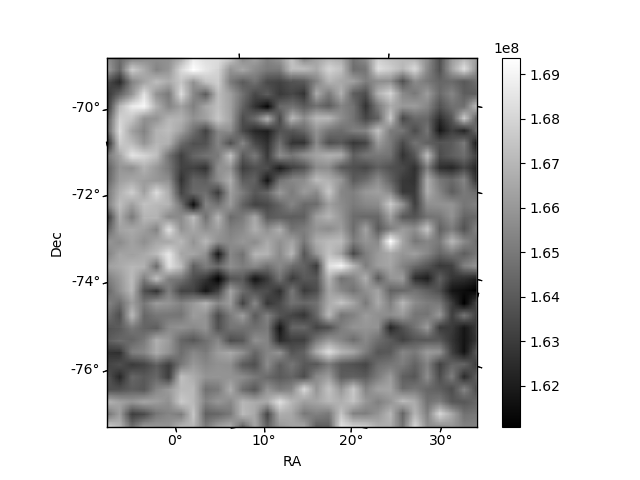
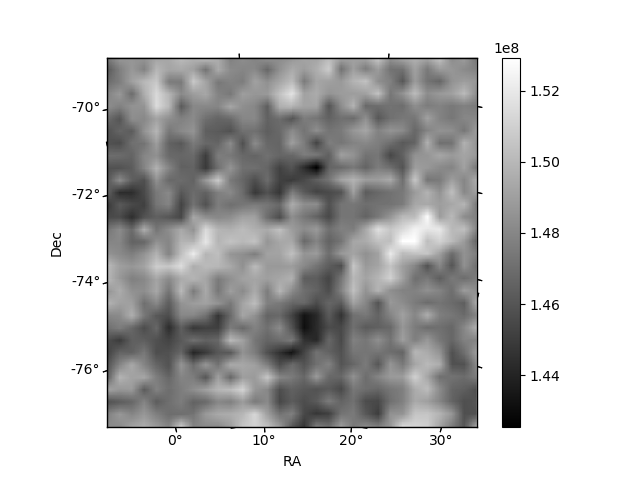
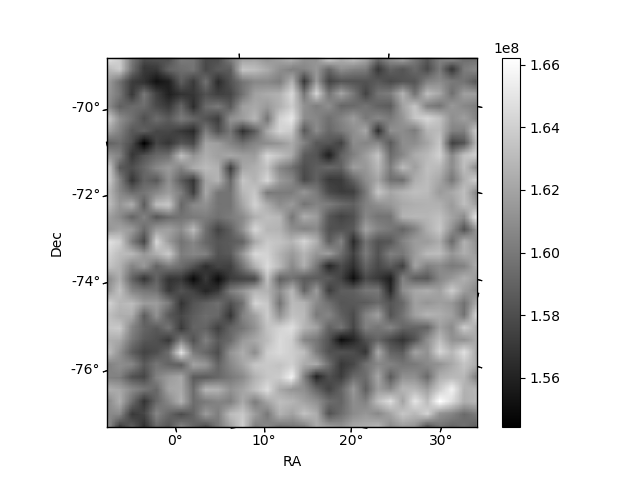
Histogram calculated using DETX and DETY for each event in the final _common_clean file
| Quadrant A | 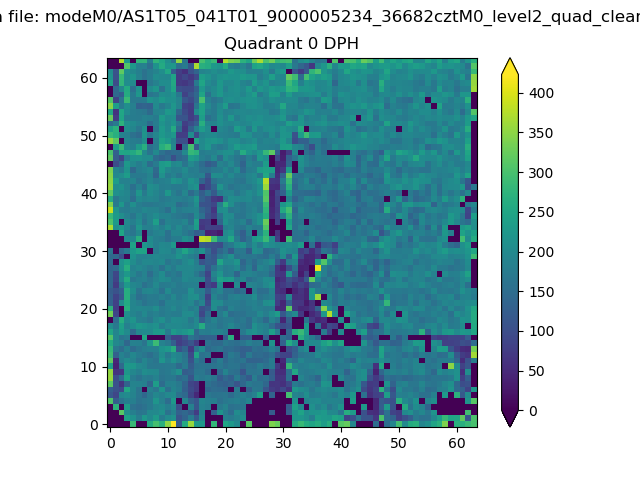 |
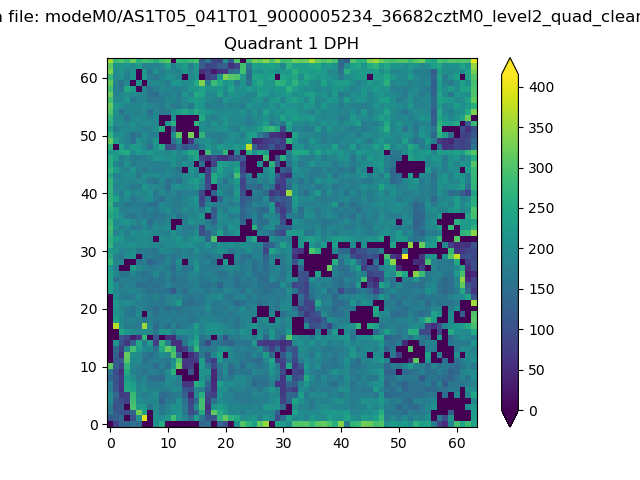 |
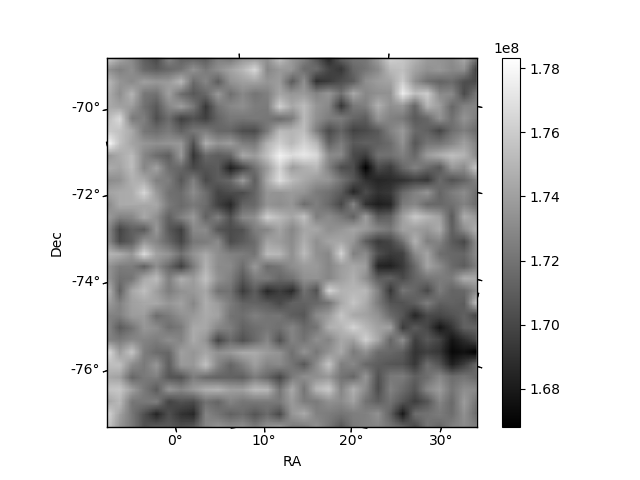
Quadrant B |
|---|---|---|---|
| Quadrant D | 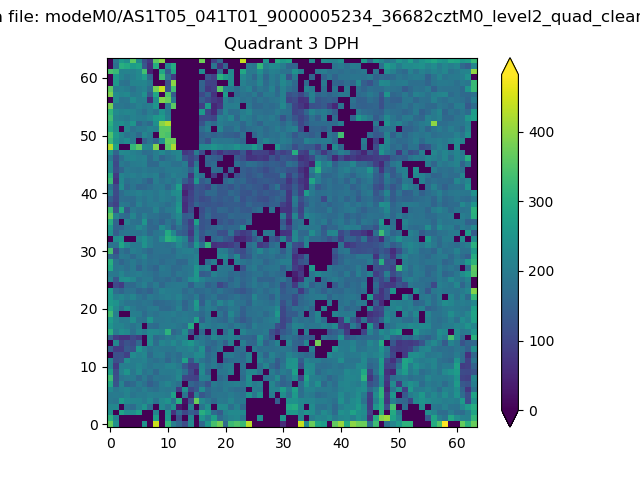 |
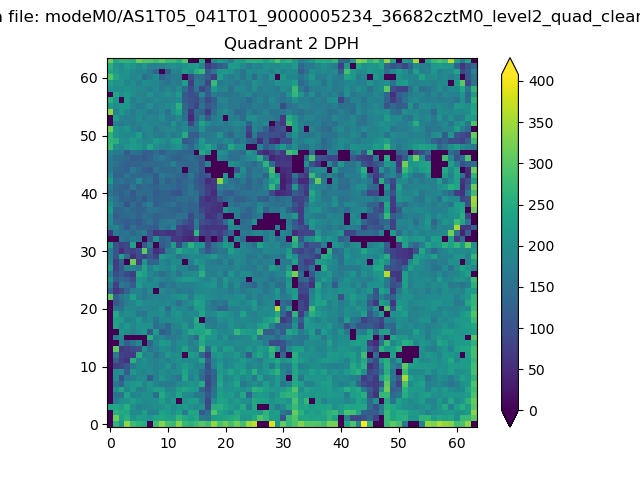 |
Quadrant C |
| Plot type | Count rate plots | Images |
|---|---|---|
| Comparison with Poisson distribution Blue bars denote a histogram of data divided into 1 sec bins. Red curve is a Poisson curve with rate = median count rate of data. |
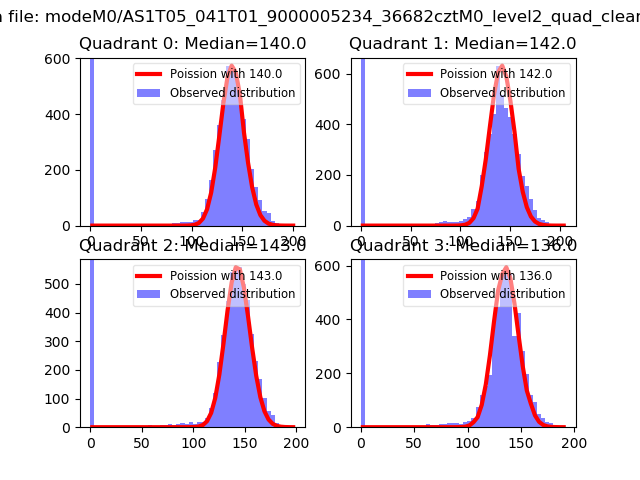 |
 |
| Quadrant-wise count rates Data is divided into 100 sec bins |
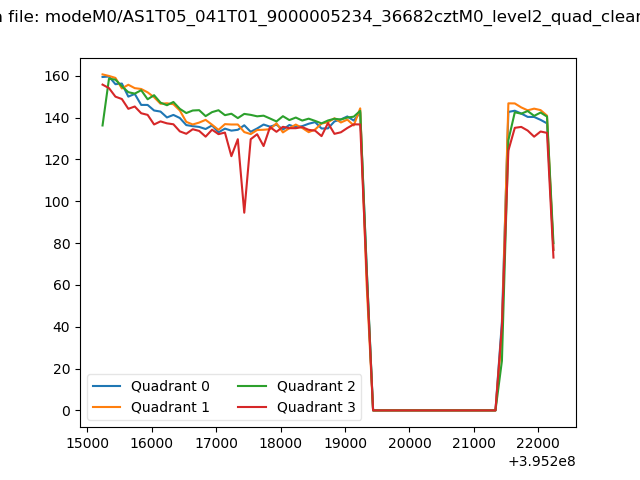 |
|
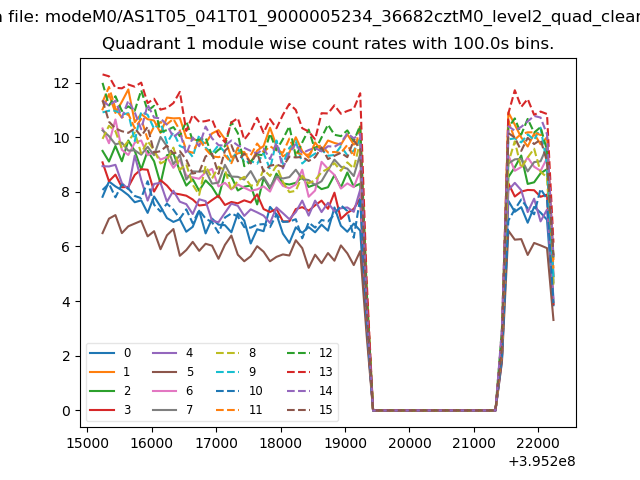
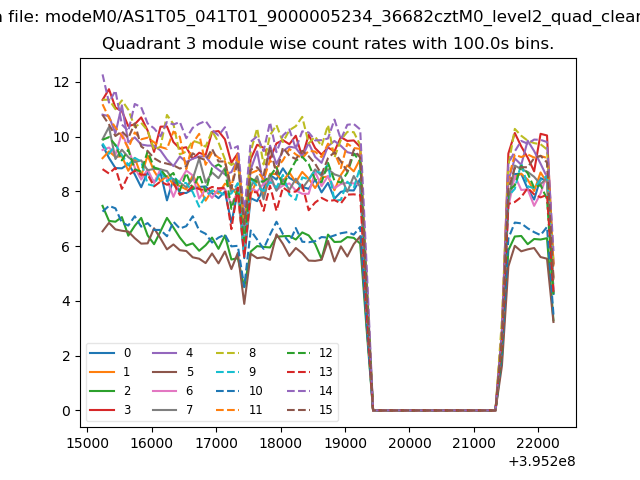
| Module-wise count rates for Quadrant A Data is divided into 100 sec bins |
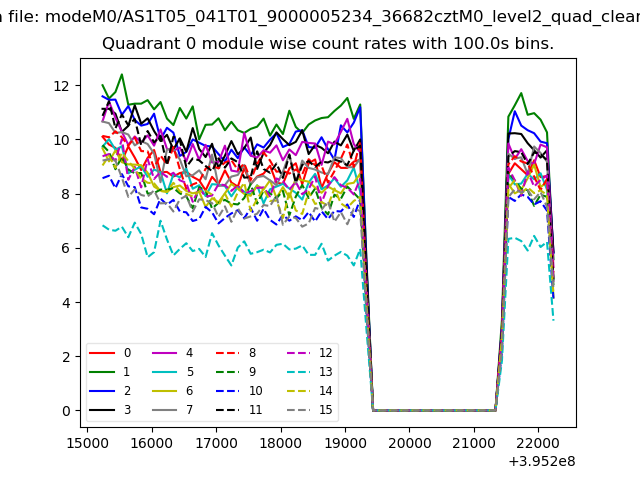 |
 |
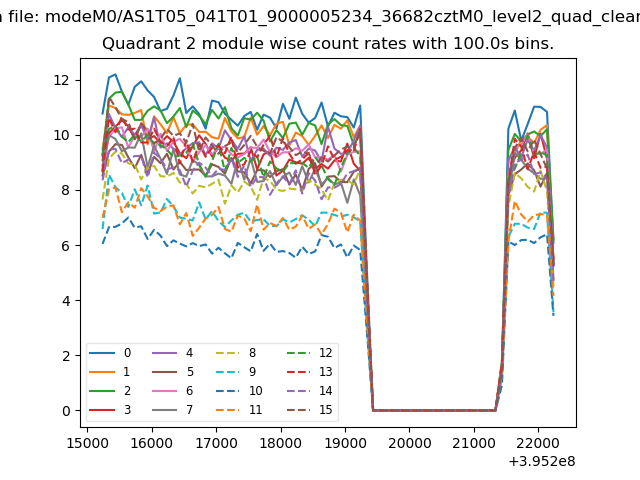
| Module-wise count rates for Quadrant B Data is divided into 100 sec bins |
 |
 |
| Module-wise count rates for Quadrant C Data is divided into 100 sec bins |
 |
 |
| Module-wise count rates for Quadrant D Data is divided into 100 sec bins |
 |
 |
| Parameter | Plot |
|---|---|
| CZT HV Monitor | 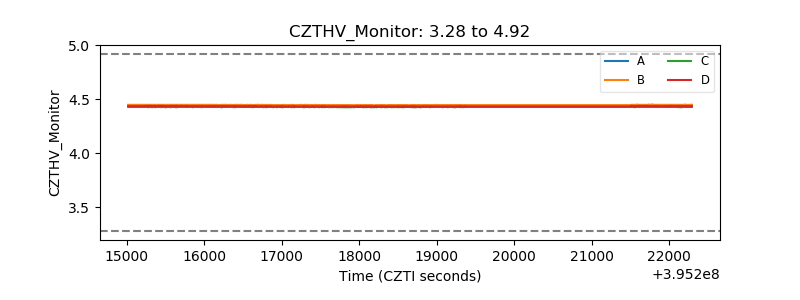 |
| D_VDD | 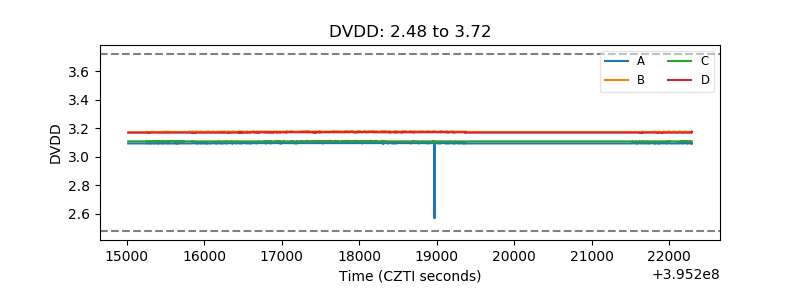 |
| Temperature 1 | 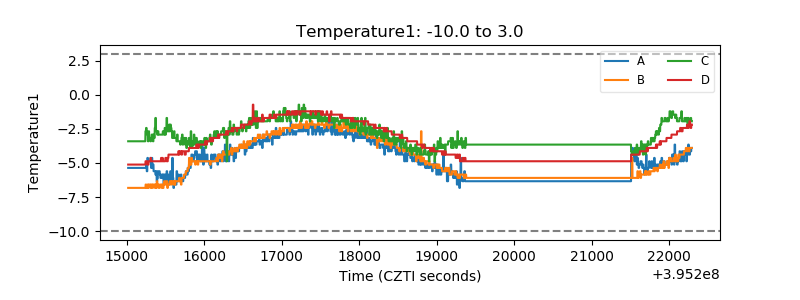 |
| Veto HV Monitor |  |
| Veto LLD | 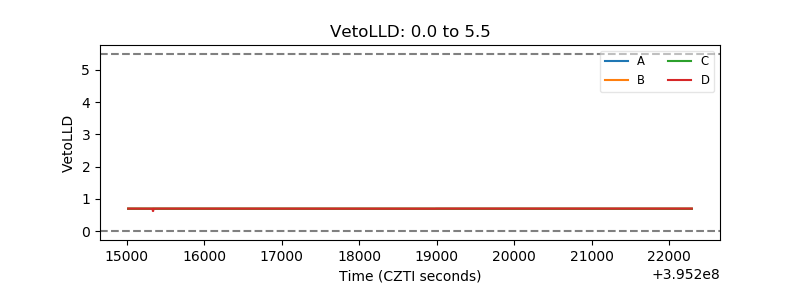 |
| Alpha Counter | 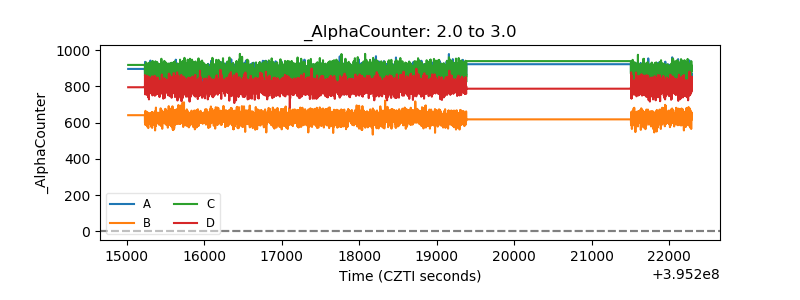 |
| _CPM_Rate | 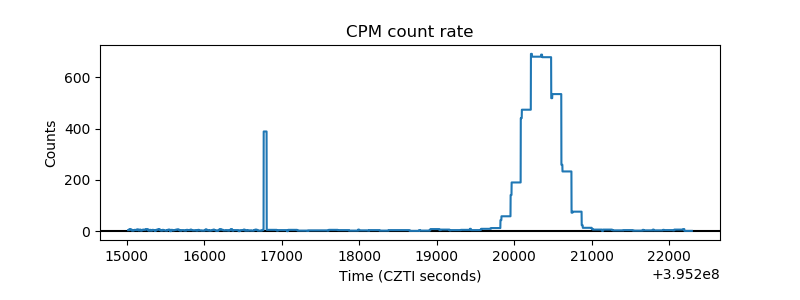 |
| CZT Counter | 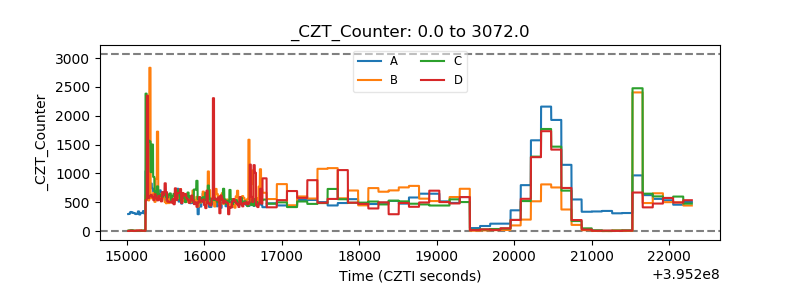 |
| +2.5 Volts monitor |  |
| +5 Volts monitor |  |
| _ROLL_ROT | 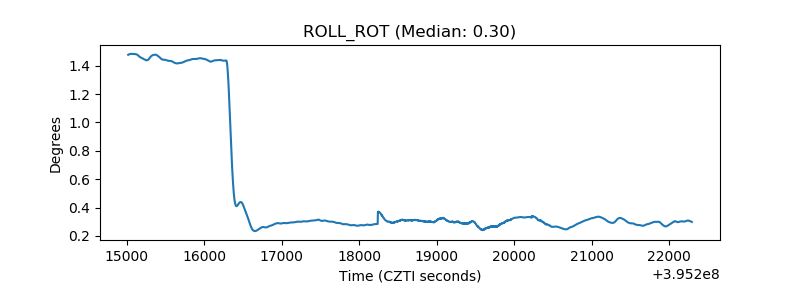 |
| _Roll_DEC | 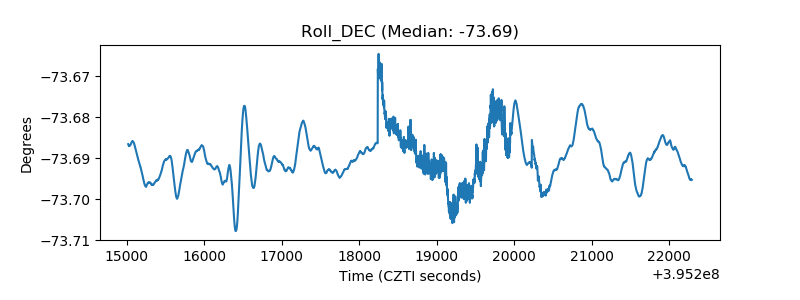 |
| _Roll_RA | 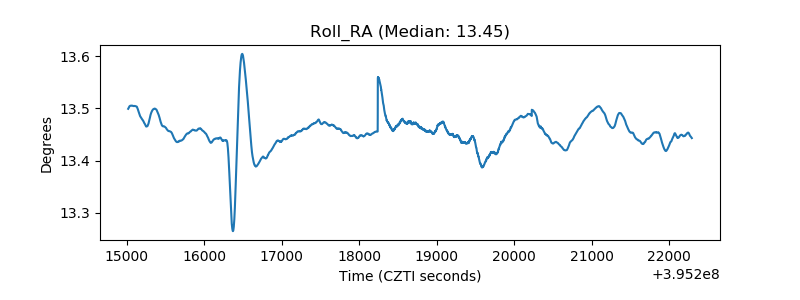 |
| Veto Counter |  |