| Param | Original file | Final file |
|---|---|---|
| Filename | modeM0/AS1T05_041T01_9000005234_36683cztM0_level2.evt | modeM0/AS1T05_041T01_9000005234_36683cztM0_level2_quad_clean.evt |
| Size (bytes) | 394,125,120 | 98,380,800 |
| Size | 375.9 MB | 93.8 MB |
| Events in quadrant A | 2,519,224 | 661,112 |
| Events in quadrant B | 3,030,118 | 663,463 |
| Events in quadrant C | 2,911,842 | 670,301 |
| Events in quadrant D | 3,134,626 | 633,684 |
| Mode M9 | |||
|---|---|---|---|
| Quadrant | BADHDUFLAG | Total packets | Discarded packets |
| A | 0 | 23 | 0 |
| B | 0 | 23 | 0 |
| C | 0 | 23 | 0 |
| D | 0 | 24 | 0 |
| Mode M0 | |||
|---|---|---|---|
| Quadrant | BADHDUFLAG | Total packets | Discarded packets |
| A | 0 | 10540 | 3 |
| B | 0 | 12091 | 2 |
| C | 0 | 11547 | 2 |
| D | 0 | 12544 | 2 |
| Mode SS | |||
|---|---|---|---|
| Quadrant | BADHDUFLAG | Total packets | Discarded packets |
| A | 0 | 104 | 0 |
| B | 0 | 104 | 0 |
| C | 0 | 104 | 0 |
| D | 0 | 104 | 0 |
| Quadrant | Total seconds | Saturated seconds | Saturation percentage |
|---|---|---|---|
| A | 5000 | 11 | 0.220000% |
| B | 5000 | 49 | 0.980000% |
| C | 5000 | 114 | 2.280000% |
| D | 5000 | 120 | 2.400000% |
Noise dominated data is calculated using 1-second bins in cleaned event files. If a bin has >2000 counts, and if more than 50% of those come from <1% of pixels, then it is considered to be noise-dominated and hence unusable.
| Quadrant | # 1 sec bins | Bins with >0 counts | Bins with >2000 counts | High rate bins dominated by noise | Noise dominated (total time) | Noise dominated (detector-on time) | Marked lightcurve |
|---|---|---|---|---|---|---|---|
| A | 7034 | 5001 | 0 | 0 | 0.00% | 0.00% | 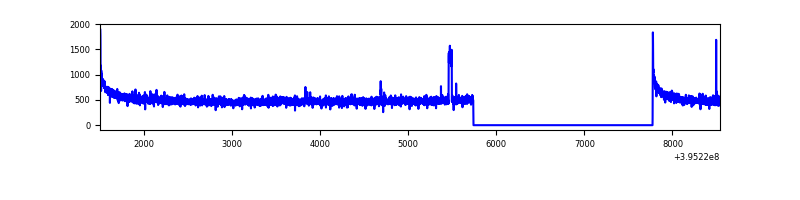 |
| B | 7034 | 5001 | 37 | 37 | 0.53% | 0.74% | 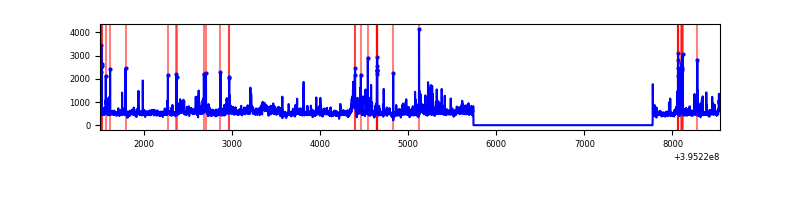 |
| C | 7034 | 5001 | 85 | 85 | 1.21% | 1.70% | 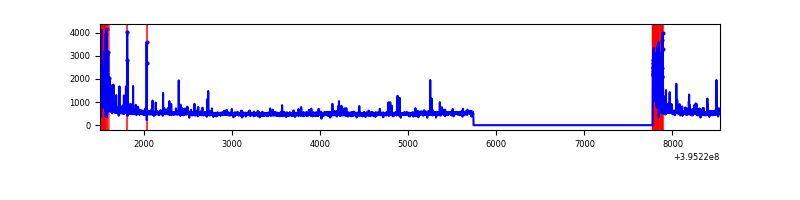 |
| D | 7034 | 5001 | 101 | 101 | 1.44% | 2.02% | 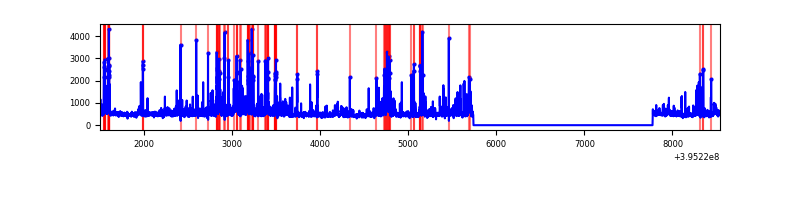 |
Top three noisy pixels from each quadrant. If the there are fewer than three noisy pixels in the level2.evt file, extra rows are filled as -1
| Pixel properties | Quadrant properties | ||||||
|---|---|---|---|---|---|---|---|
| Quadrant | DetID | PixID | Counts | Sigma | Mean | Median | Sigma |
| A | 10 | 83 | 205970 | 1738.56 | 586 | 574 | 118.1 |
| A | 15 | 223 | 35195 | 293.05 | 586 | 574 | 118.1 |
| A | 13 | 254 | 9457 | 75.19 | 586 | 574 | 118.1 |
| B | 0 | 189 | 393769 | 3626.39 | 576 | 561 | 108.4 |
| B | 5 | 255 | 211547 | 1945.83 | 576 | 561 | 108.4 |
| B | 4 | 232 | 59497 | 543.54 | 576 | 561 | 108.4 |
| C | 0 | 10 | 417428 | 3173.52 | 569 | 574 | 131.4 |
| C | 15 | 214 | 230389 | 1749.59 | 569 | 574 | 131.4 |
| C | 0 | 207 | 18348 | 135.31 | 569 | 574 | 131.4 |
| D | 2 | 153 | 191797 | 1382.29 | 572 | 557 | 138.3 |
| D | 13 | 171 | 166696 | 1200.86 | 572 | 557 | 138.3 |
| D | 2 | 250 | 106687 | 767.11 | 572 | 557 | 138.3 |
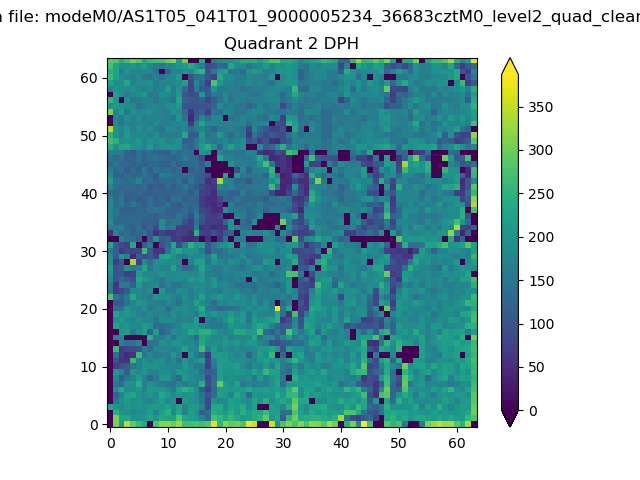
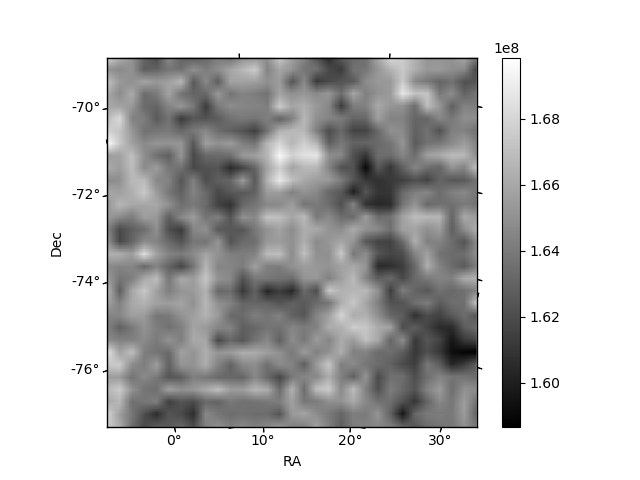
Histogram calculated using DETX and DETY for each event in the final _common_clean file
| Quadrant A | 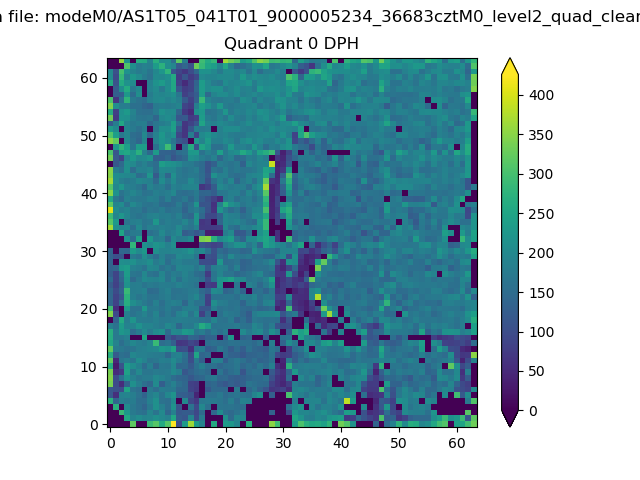 |
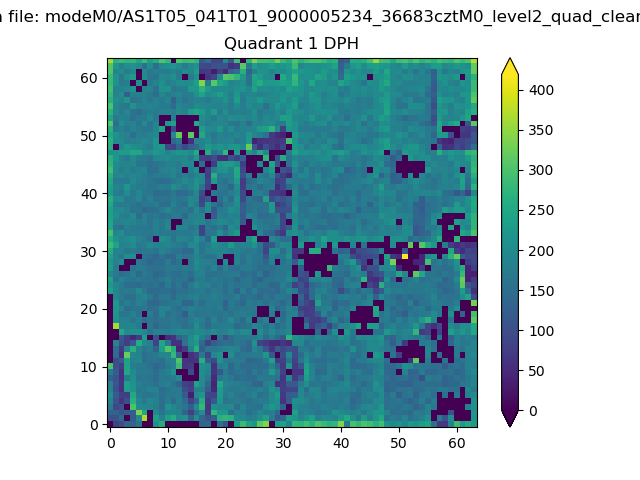 |
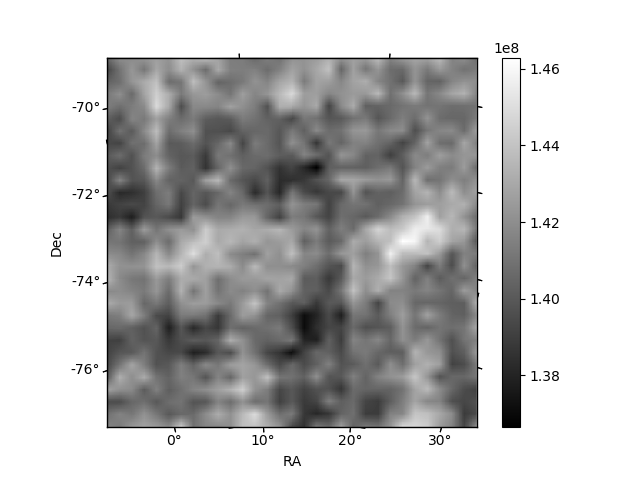
Quadrant B |
|---|---|---|---|
| Quadrant D | 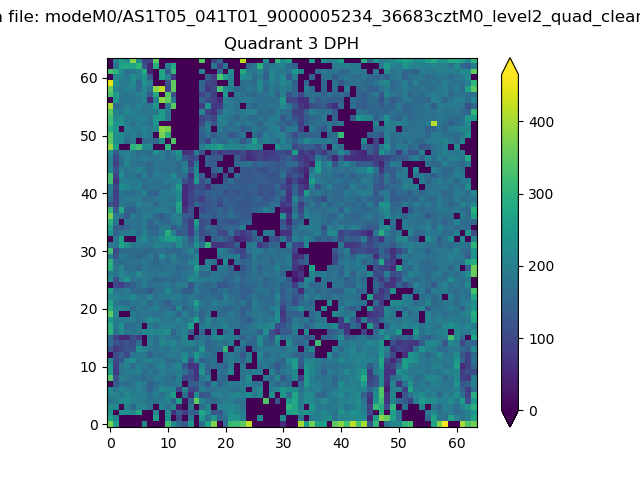 |
 |
Quadrant C |
| Plot type | Count rate plots | Images |
|---|---|---|
| Comparison with Poisson distribution Blue bars denote a histogram of data divided into 1 sec bins. Red curve is a Poisson curve with rate = median count rate of data. |
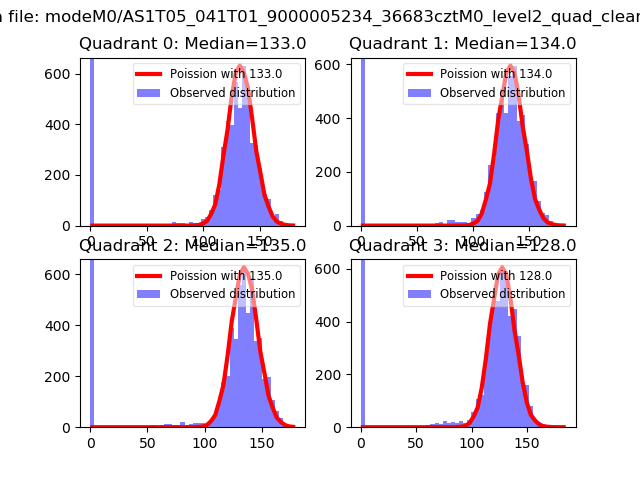 |
 |
| Quadrant-wise count rates Data is divided into 100 sec bins |
 |
|
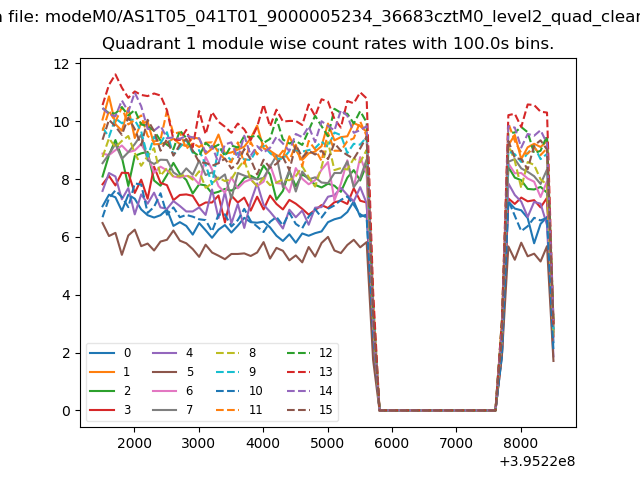
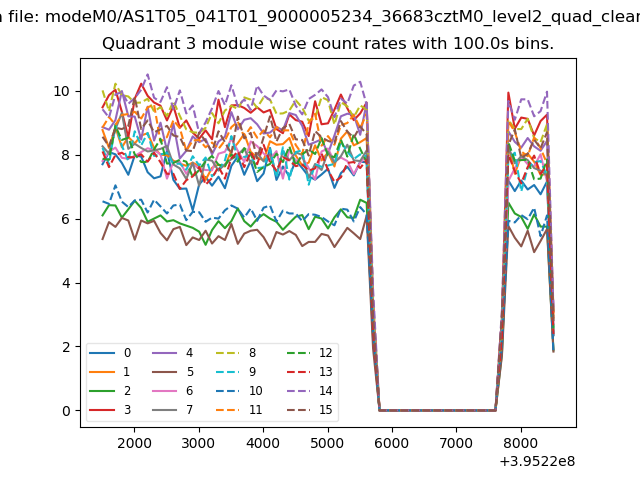
| Module-wise count rates for Quadrant A Data is divided into 100 sec bins |
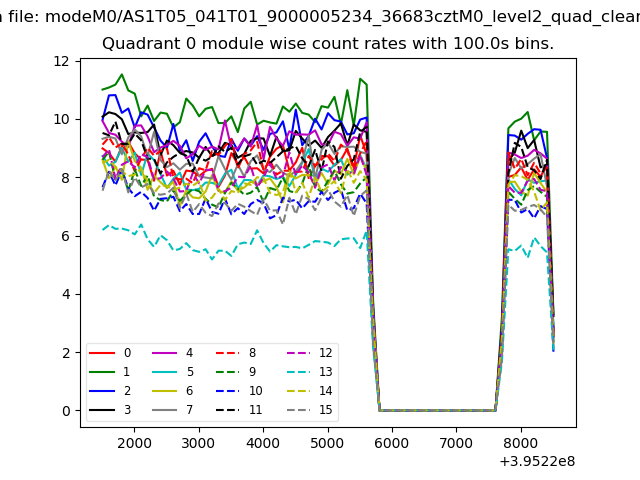 |
 |
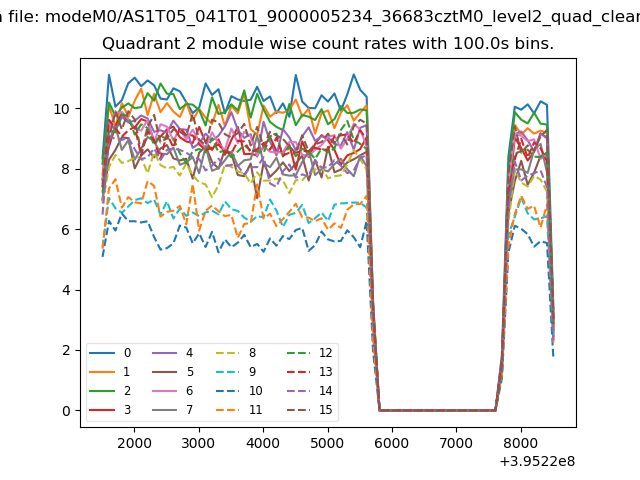
| Module-wise count rates for Quadrant B Data is divided into 100 sec bins |
 |
 |
| Module-wise count rates for Quadrant C Data is divided into 100 sec bins |
 |
 |
| Module-wise count rates for Quadrant D Data is divided into 100 sec bins |
 |
 |
| Parameter | Plot |
|---|---|
| CZT HV Monitor | 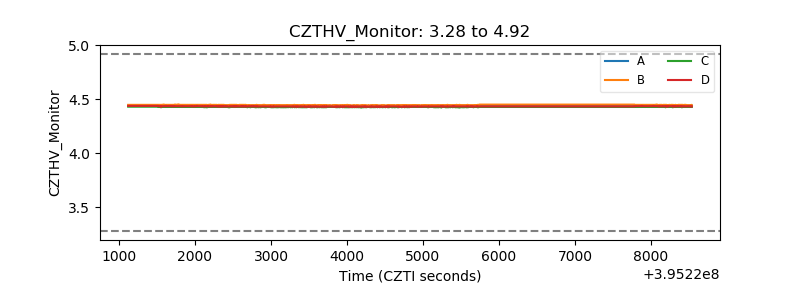 |
| D_VDD | 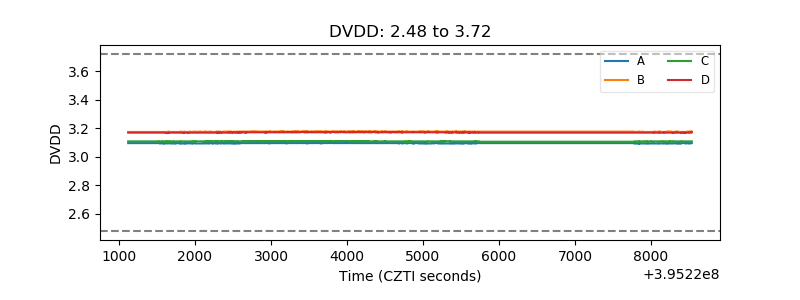 |
| Temperature 1 | 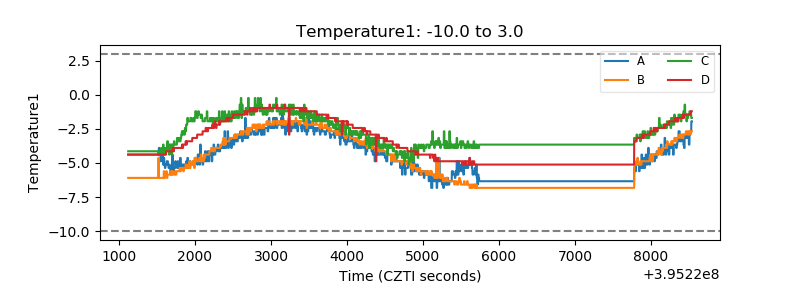 |
| Veto HV Monitor |  |
| Veto LLD | 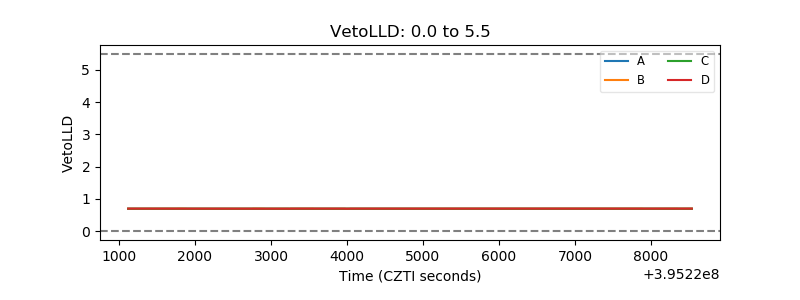 |
| Alpha Counter | 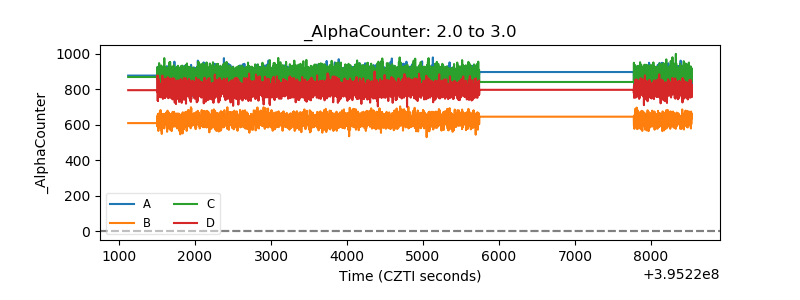 |
| _CPM_Rate | 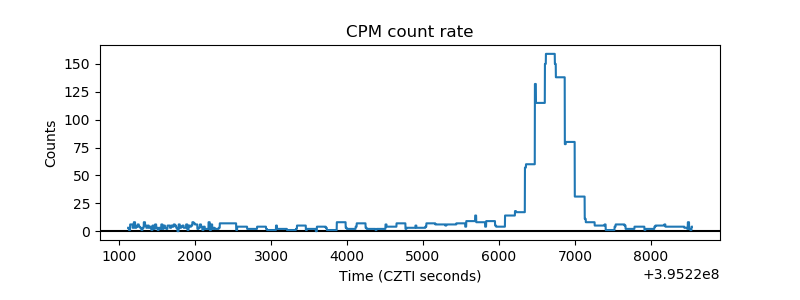 |
| CZT Counter | 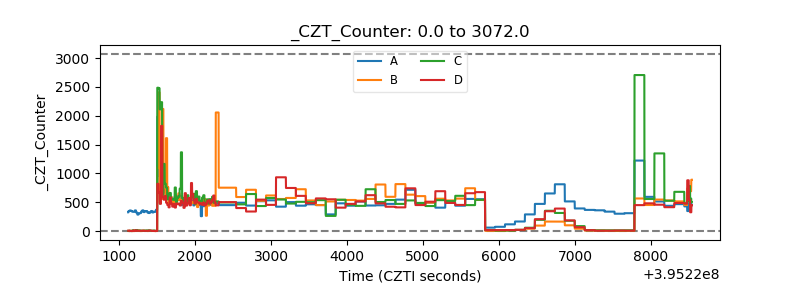 |
| +2.5 Volts monitor |  |
| +5 Volts monitor |  |
| _ROLL_ROT | 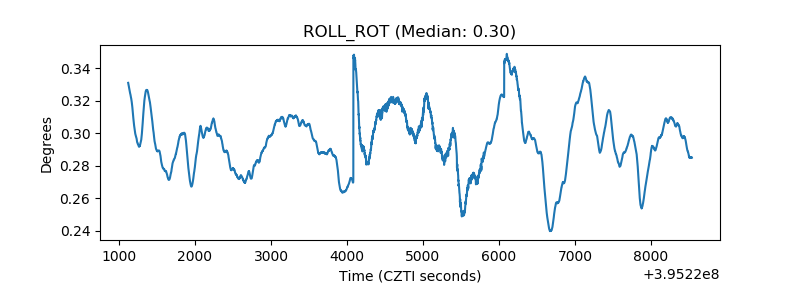 |
| _Roll_DEC | 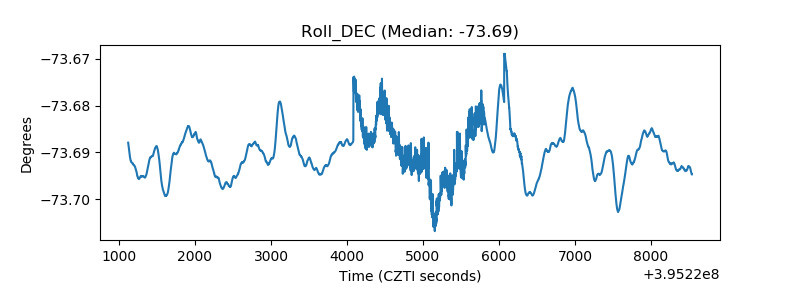 |
| _Roll_RA | 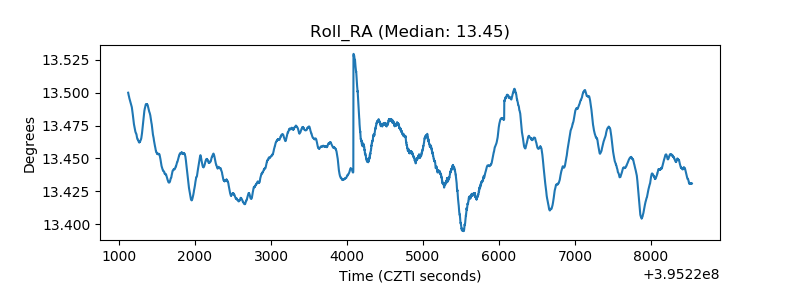 |
| Veto Counter | 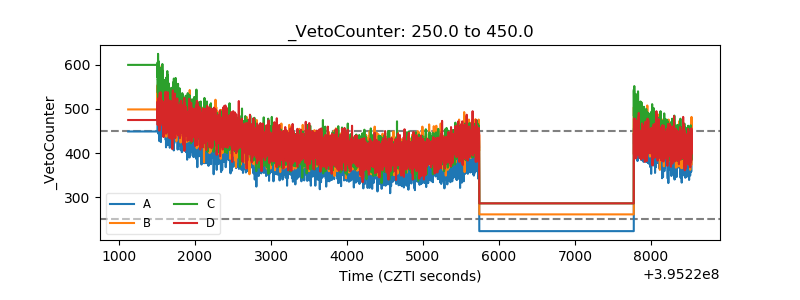 |