| Param | Original file | Final file |
|---|---|---|
| Filename | modeM0/AS1T05_041T01_9000005234_36684cztM0_level2.evt | modeM0/AS1T05_041T01_9000005234_36684cztM0_level2_quad_clean.evt |
| Size (bytes) | 464,808,960 | 105,039,360 |
| Size | 443.3 MB | 100.2 MB |
| Events in quadrant A | 2,699,211 | 706,752 |
| Events in quadrant B | 3,705,025 | 699,993 |
| Events in quadrant C | 3,152,460 | 715,589 |
| Events in quadrant D | 4,138,957 | 665,986 |
| Mode M9 | |||
|---|---|---|---|
| Quadrant | BADHDUFLAG | Total packets | Discarded packets |
| A | 0 | 20 | 0 |
| B | 0 | 20 | 0 |
| C | 0 | 20 | 0 |
| D | 0 | 21 | 0 |
| Mode M0 | |||
|---|---|---|---|
| Quadrant | BADHDUFLAG | Total packets | Discarded packets |
| A | 0 | 11613 | 3 |
| B | 0 | 14584 | 2 |
| C | 0 | 12769 | 2 |
| D | 0 | 16026 | 2 |
| Mode SS | |||
|---|---|---|---|
| Quadrant | BADHDUFLAG | Total packets | Discarded packets |
| A | 0 | 114 | 0 |
| B | 0 | 114 | 0 |
| C | 0 | 114 | 0 |
| D | 0 | 114 | 0 |
| Quadrant | Total seconds | Saturated seconds | Saturation percentage |
|---|---|---|---|
| A | 5615 | 9 | 0.160285% |
| B | 5615 | 142 | 2.528940% |
| C | 5615 | 115 | 2.048085% |
| D | 5615 | 320 | 5.699020% |
Noise dominated data is calculated using 1-second bins in cleaned event files. If a bin has >2000 counts, and if more than 50% of those come from <1% of pixels, then it is considered to be noise-dominated and hence unusable.
| Quadrant | # 1 sec bins | Bins with >0 counts | Bins with >2000 counts | High rate bins dominated by noise | Noise dominated (total time) | Noise dominated (detector-on time) | Marked lightcurve |
|---|---|---|---|---|---|---|---|
| A | 7378 | 5616 | 0 | 0 | 0.00% | 0.00% | 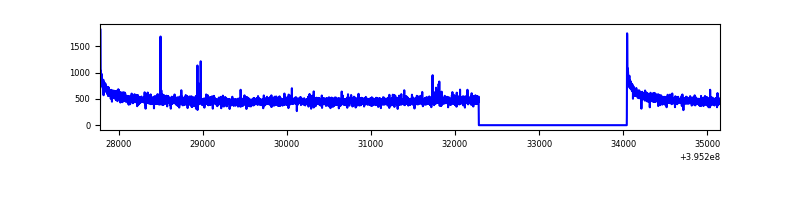 |
| B | 7378 | 5616 | 90 | 90 | 1.22% | 1.60% | 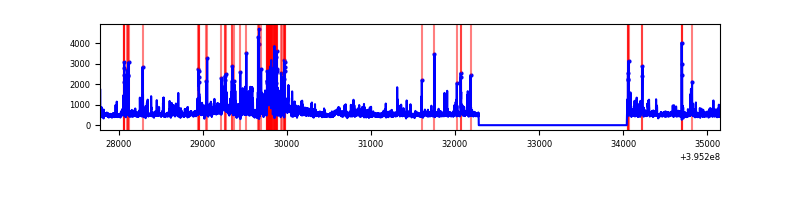 |
| C | 7378 | 5616 | 86 | 86 | 1.17% | 1.53% | 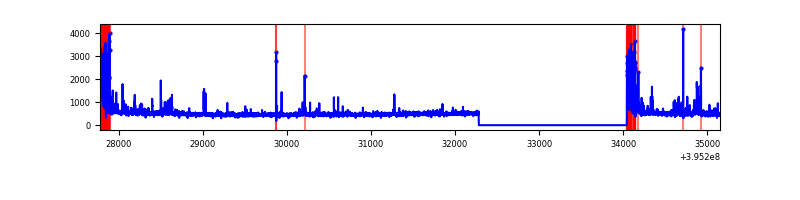 |
| D | 7378 | 5616 | 272 | 272 | 3.69% | 4.84% | 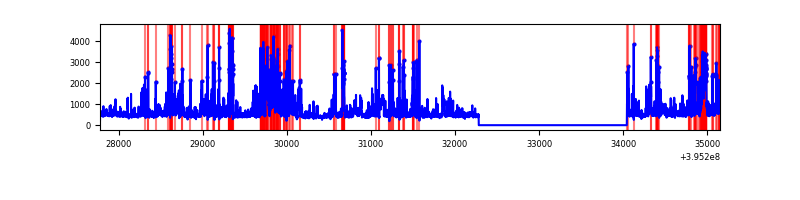 |
Top three noisy pixels from each quadrant. If the there are fewer than three noisy pixels in the level2.evt file, extra rows are filled as -1
| Pixel properties | Quadrant properties | ||||||
|---|---|---|---|---|---|---|---|
| Quadrant | DetID | PixID | Counts | Sigma | Mean | Median | Sigma |
| A | 10 | 83 | 218036 | 1701.24 | 634 | 621 | 127.8 |
| A | 13 | 6 | 13987 | 104.59 | 634 | 621 | 127.8 |
| A | 13 | 254 | 10777 | 79.47 | 634 | 621 | 127.8 |
| B | 0 | 189 | 872807 | 7414.08 | 622 | 605 | 117.6 |
| B | 5 | 255 | 250073 | 2120.58 | 622 | 605 | 117.6 |
| B | 4 | 232 | 40424 | 338.48 | 622 | 605 | 117.6 |
| C | 0 | 10 | 429018 | 3030.15 | 615 | 619 | 141.4 |
| C | 15 | 214 | 255179 | 1800.55 | 615 | 619 | 141.4 |
| C | 0 | 207 | 30862 | 213.91 | 615 | 619 | 141.4 |
| D | 12 | 227 | 462448 | 3134.92 | 609 | 593 | 147.3 |
| D | 2 | 153 | 314323 | 2129.5 | 609 | 593 | 147.3 |
| D | 2 | 137 | 162341 | 1097.89 | 609 | 593 | 147.3 |
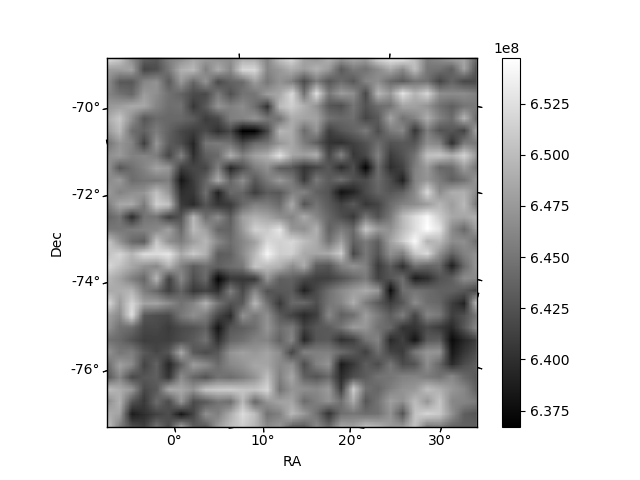
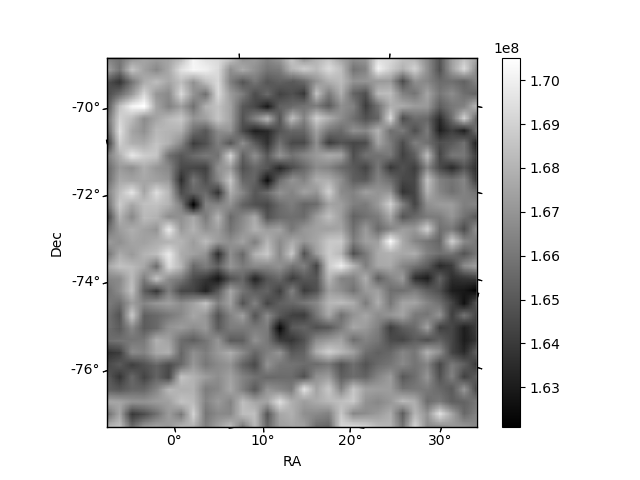
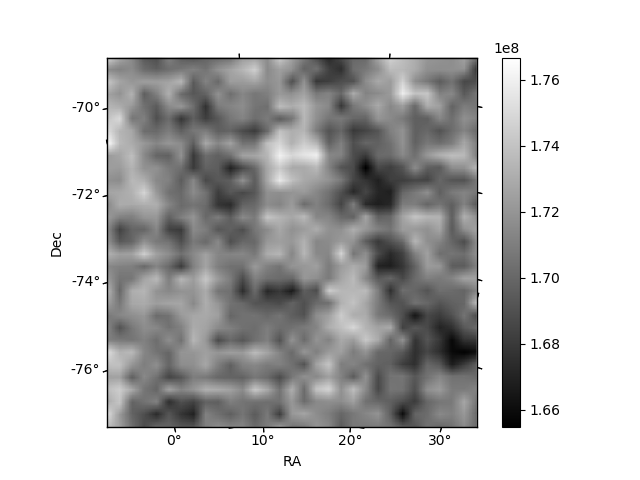
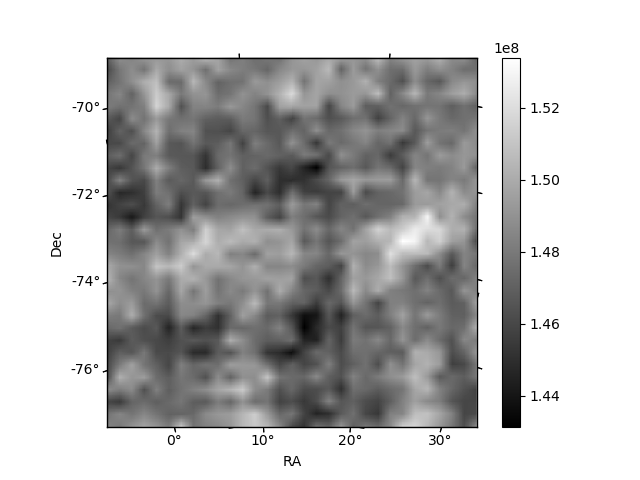
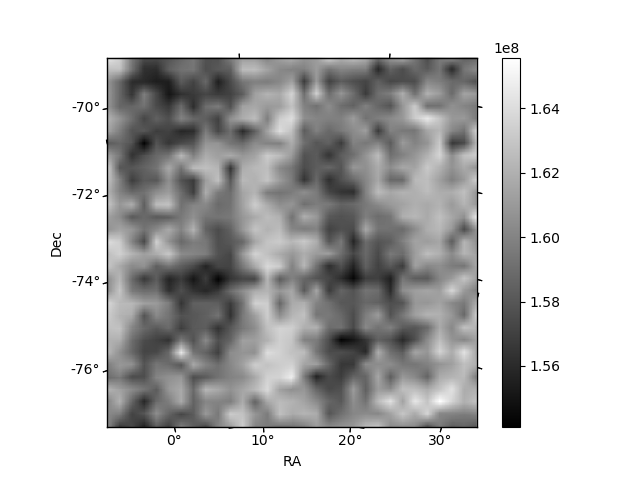
Histogram calculated using DETX and DETY for each event in the final _common_clean file
| Quadrant A | 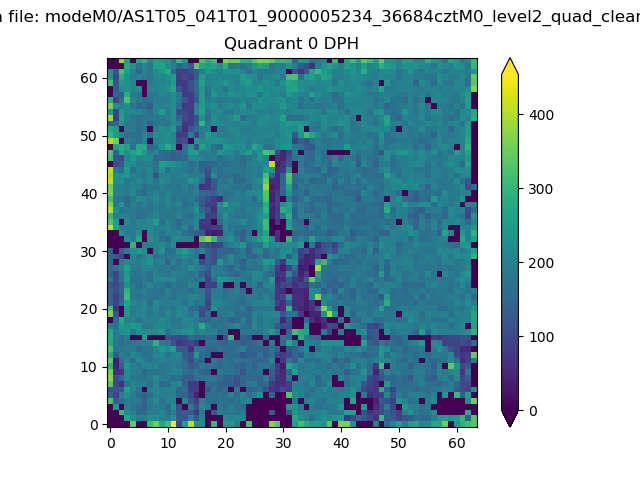 |
 |
Quadrant B |
|---|---|---|---|
| Quadrant D | 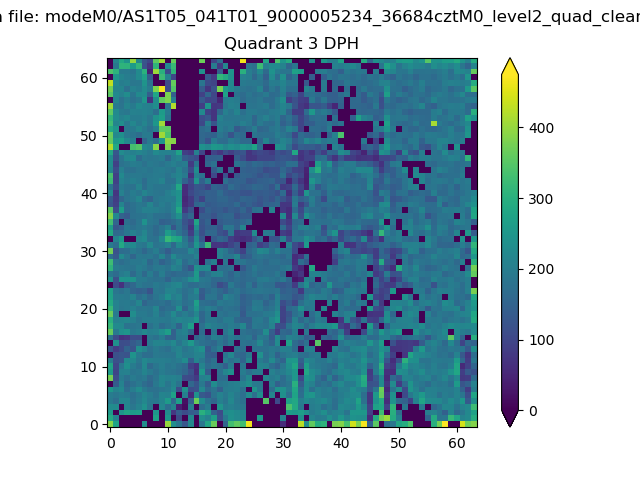 |
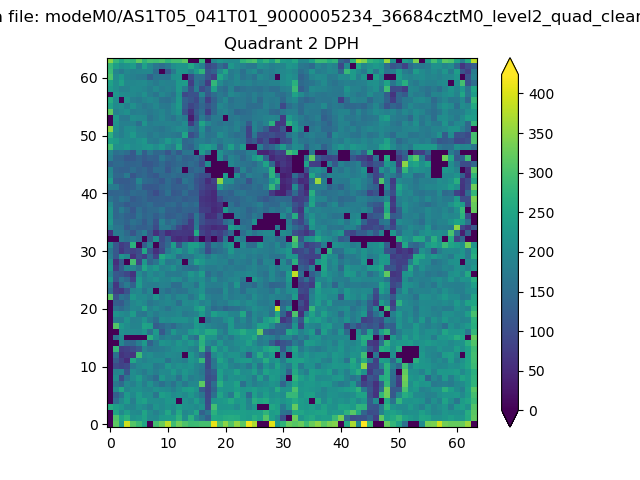 |
Quadrant C |
| Plot type | Count rate plots | Images |
|---|---|---|
| Comparison with Poisson distribution Blue bars denote a histogram of data divided into 1 sec bins. Red curve is a Poisson curve with rate = median count rate of data. |
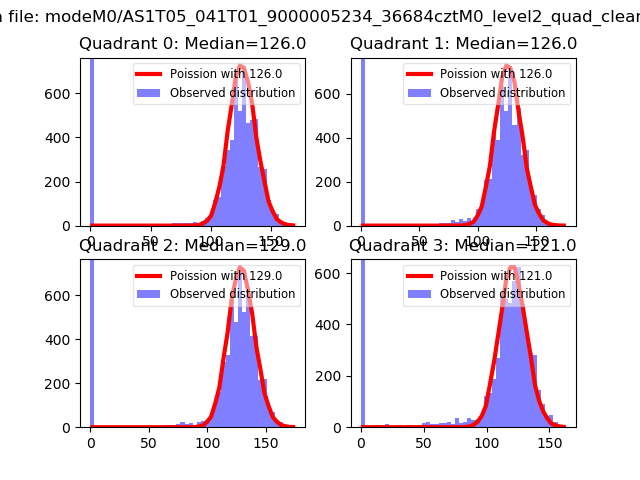 |
 |
| Quadrant-wise count rates Data is divided into 100 sec bins |
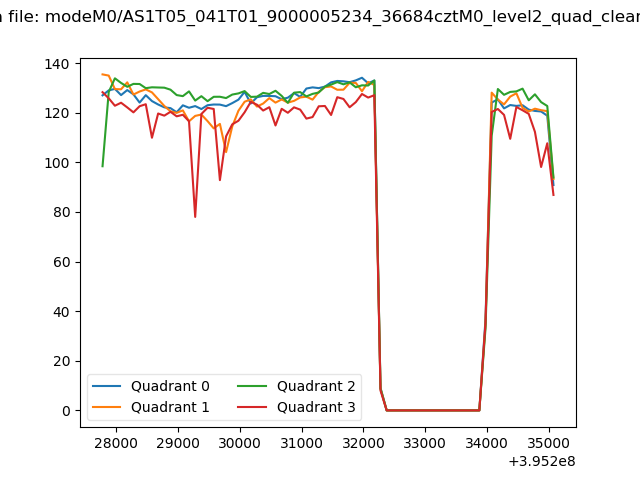 |
|
| Module-wise count rates for Quadrant A Data is divided into 100 sec bins |
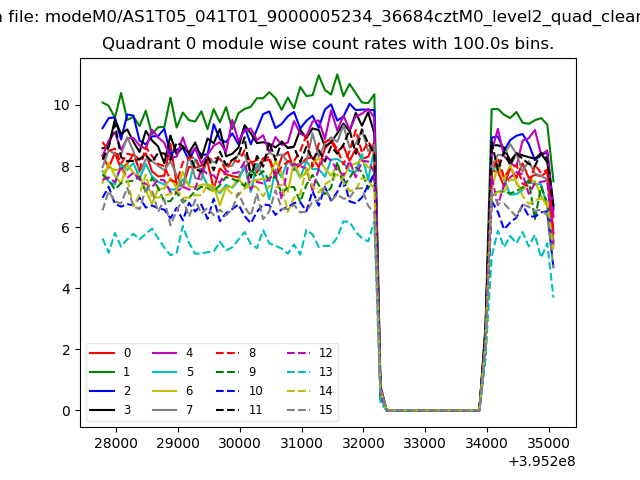 |
 |
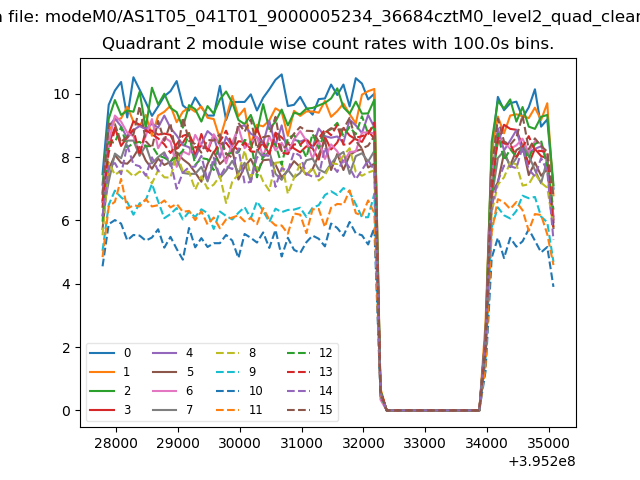
| Module-wise count rates for Quadrant B Data is divided into 100 sec bins |
 |
 |
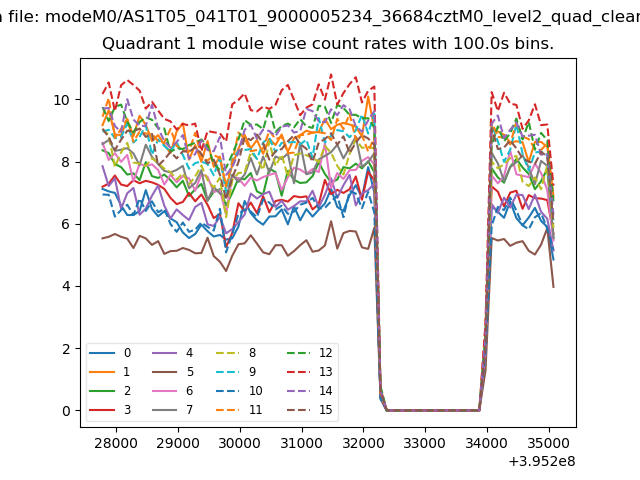
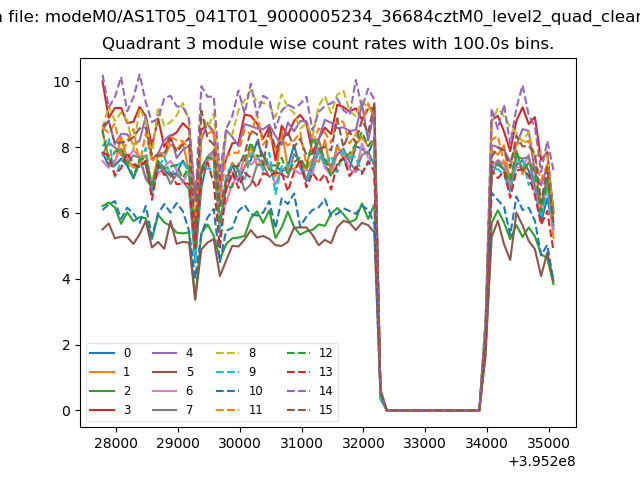
| Module-wise count rates for Quadrant C Data is divided into 100 sec bins |
 |
 |
| Module-wise count rates for Quadrant D Data is divided into 100 sec bins |
 |
 |
| Parameter | Plot |
|---|---|
| CZT HV Monitor | 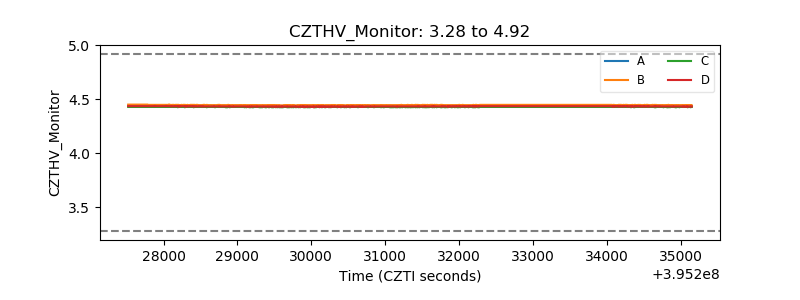 |
| D_VDD | 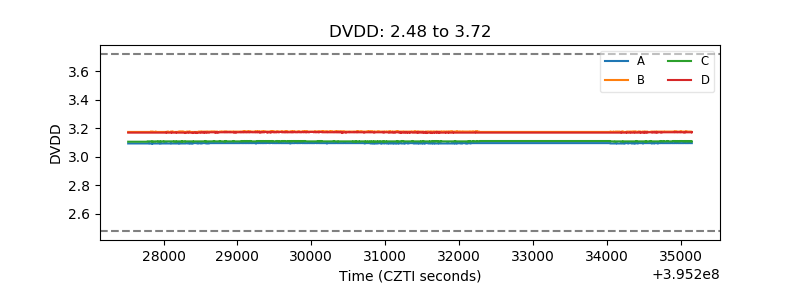 |
| Temperature 1 | 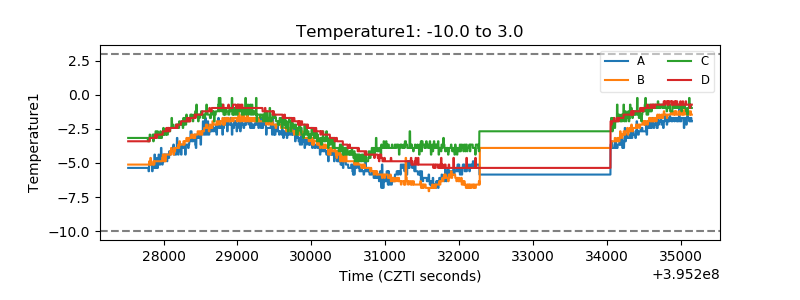 |
| Veto HV Monitor | 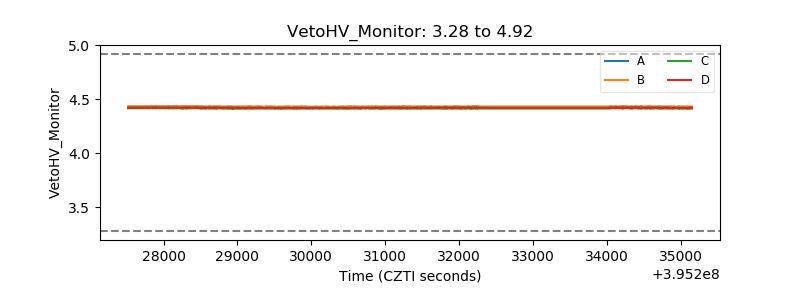 |
| Veto LLD | 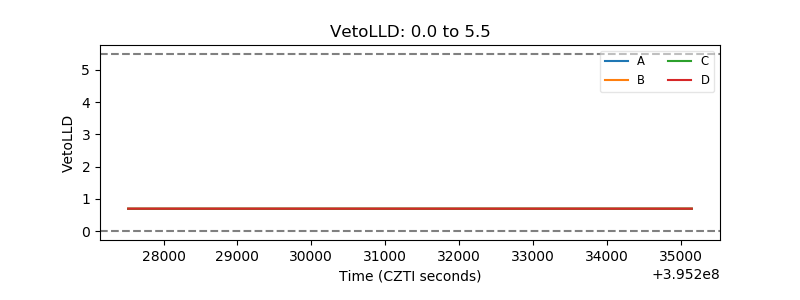 |
| Alpha Counter | 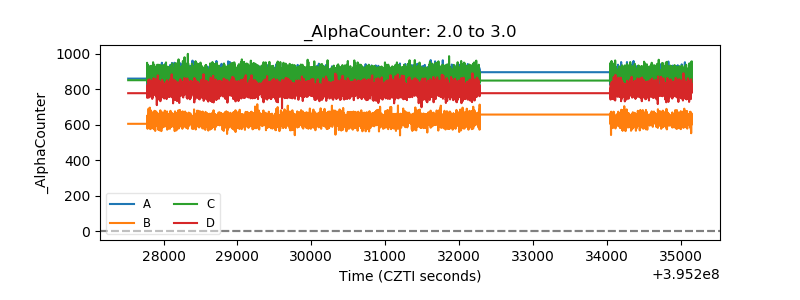 |
| _CPM_Rate | 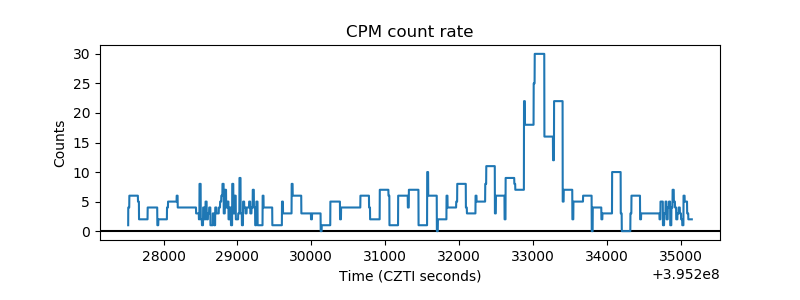 |
| CZT Counter | 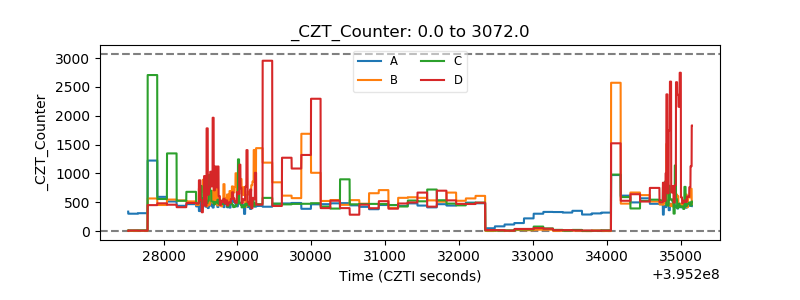 |
| +2.5 Volts monitor |  |
| +5 Volts monitor |  |
| _ROLL_ROT | 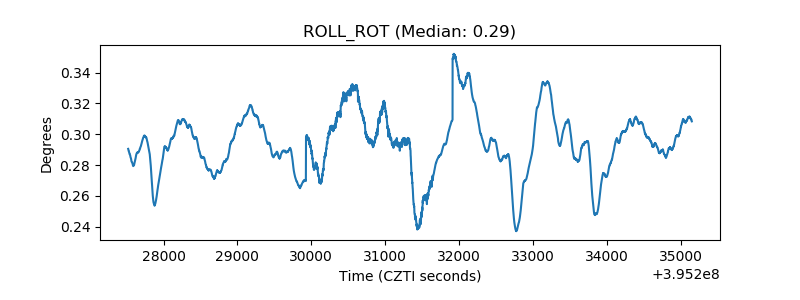 |
| _Roll_DEC |  |
| _Roll_RA | 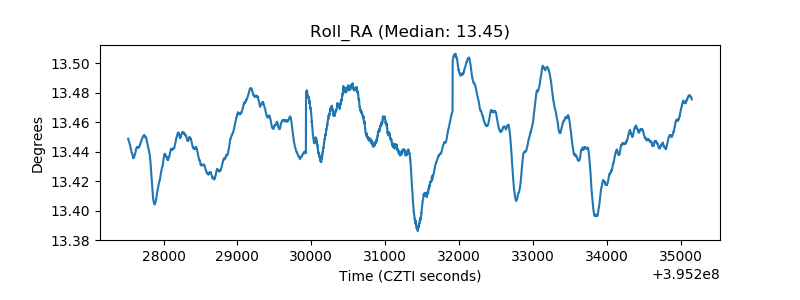 |
| Veto Counter | 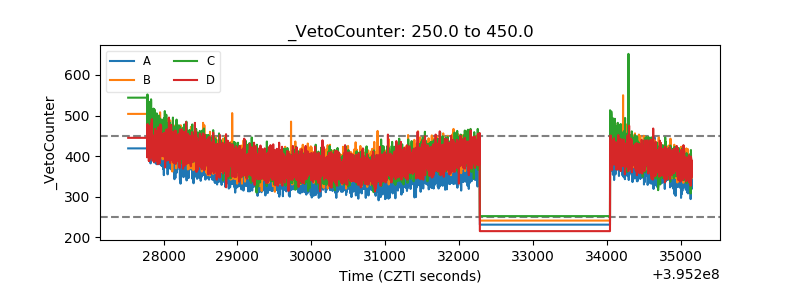 |