| Param | Original file | Final file |
|---|---|---|
| Filename | modeM0/AS1T05_041T01_9000005234_36685cztM0_level2.evt | modeM0/AS1T05_041T01_9000005234_36685cztM0_level2_quad_clean.evt |
| Size (bytes) | 494,939,520 | 108,288,000 |
| Size | 472.0 MB | 103.3 MB |
| Events in quadrant A | 2,833,629 | 728,719 |
| Events in quadrant B | 3,220,418 | 727,804 |
| Events in quadrant C | 4,176,868 | 717,360 |
| Events in quadrant D | 4,356,667 | 691,975 |
| Mode M9 | |||
|---|---|---|---|
| Quadrant | BADHDUFLAG | Total packets | Discarded packets |
| A | 0 | 17 | 0 |
| B | 0 | 17 | 0 |
| C | 0 | 17 | 0 |
| D | 0 | 18 | 0 |
| Mode M0 | |||
|---|---|---|---|
| Quadrant | BADHDUFLAG | Total packets | Discarded packets |
| A | 0 | 12275 | 3 |
| B | 0 | 13246 | 2 |
| C | 0 | 16037 | 2 |
| D | 0 | 16923 | 2 |
| Mode SS | |||
|---|---|---|---|
| Quadrant | BADHDUFLAG | Total packets | Discarded packets |
| A | 0 | 120 | 0 |
| B | 0 | 120 | 0 |
| C | 0 | 120 | 0 |
| D | 0 | 120 | 0 |
| Quadrant | Total seconds | Saturated seconds | Saturation percentage |
|---|---|---|---|
| A | 5921 | 15 | 0.253336% |
| B | 5921 | 41 | 0.692451% |
| C | 5921 | 363 | 6.130721% |
| D | 5921 | 332 | 5.607161% |
Noise dominated data is calculated using 1-second bins in cleaned event files. If a bin has >2000 counts, and if more than 50% of those come from <1% of pixels, then it is considered to be noise-dominated and hence unusable.
| Quadrant | # 1 sec bins | Bins with >0 counts | Bins with >2000 counts | High rate bins dominated by noise | Noise dominated (total time) | Noise dominated (detector-on time) | Marked lightcurve |
|---|---|---|---|---|---|---|---|
| A | 7353 | 5922 | 4 | 4 | 0.05% | 0.07% | 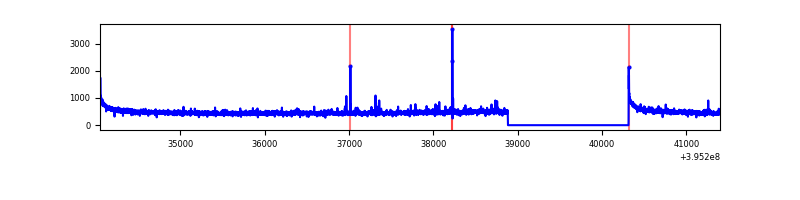 |
| B | 7353 | 5922 | 22 | 22 | 0.30% | 0.37% | 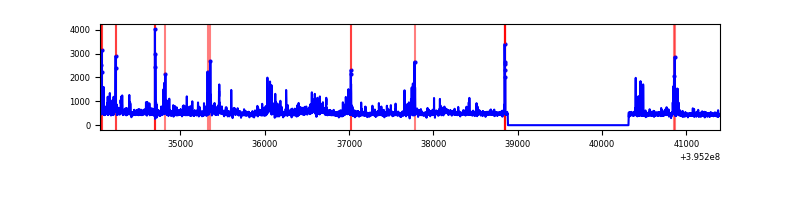 |
| C | 7353 | 5922 | 322 | 322 | 4.38% | 5.44% | 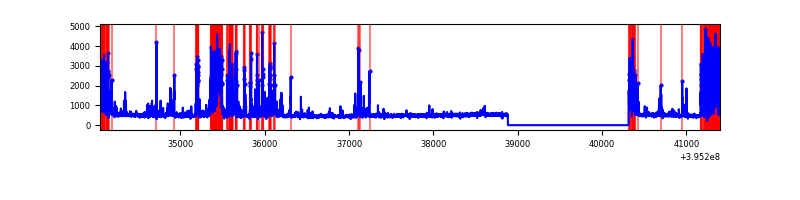 |
| D | 7353 | 5922 | 282 | 282 | 3.84% | 4.76% | 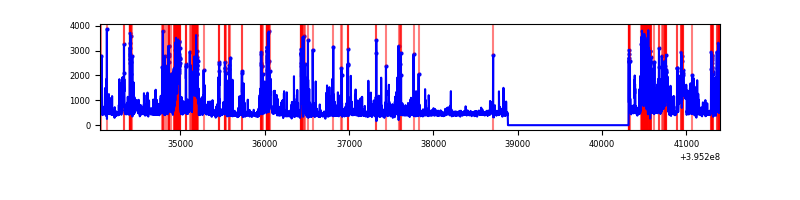 |
Top three noisy pixels from each quadrant. If the there are fewer than three noisy pixels in the level2.evt file, extra rows are filled as -1
| Pixel properties | Quadrant properties | ||||||
|---|---|---|---|---|---|---|---|
| Quadrant | DetID | PixID | Counts | Sigma | Mean | Median | Sigma |
| A | 10 | 83 | 231260 | 1731.86 | 661 | 648 | 133.2 |
| A | 9 | 143 | 28983 | 212.79 | 661 | 648 | 133.2 |
| A | 13 | 6 | 14184 | 101.65 | 661 | 648 | 133.2 |
| B | 0 | 189 | 322787 | 2578.66 | 655 | 638 | 124.9 |
| B | 5 | 255 | 126800 | 1009.87 | 655 | 638 | 124.9 |
| B | 4 | 232 | 42844 | 337.84 | 655 | 638 | 124.9 |
| C | 1 | 23 | 950904 | 6531.81 | 631 | 636 | 145.5 |
| C | 0 | 10 | 370021 | 2539.03 | 631 | 636 | 145.5 |
| C | 15 | 214 | 262457 | 1799.67 | 631 | 636 | 145.5 |
| D | 2 | 153 | 297035 | 1924.21 | 635 | 617 | 154.0 |
| D | 12 | 233 | 284054 | 1839.94 | 635 | 617 | 154.0 |
| D | 2 | 249 | 267554 | 1732.83 | 635 | 617 | 154.0 |
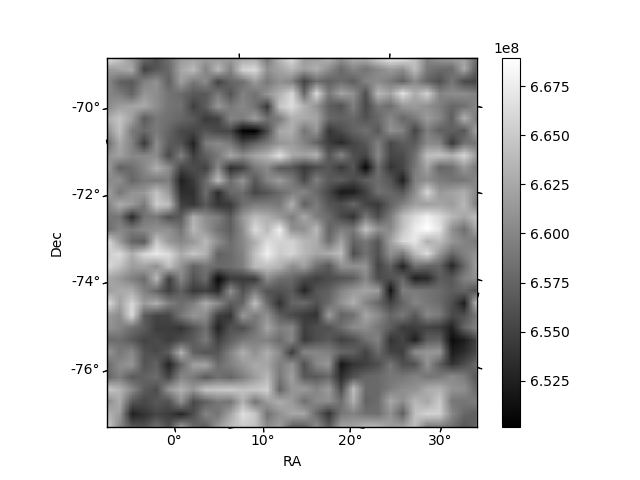
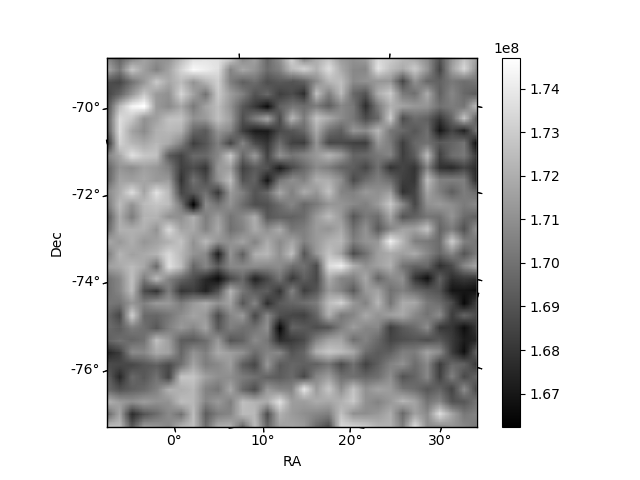
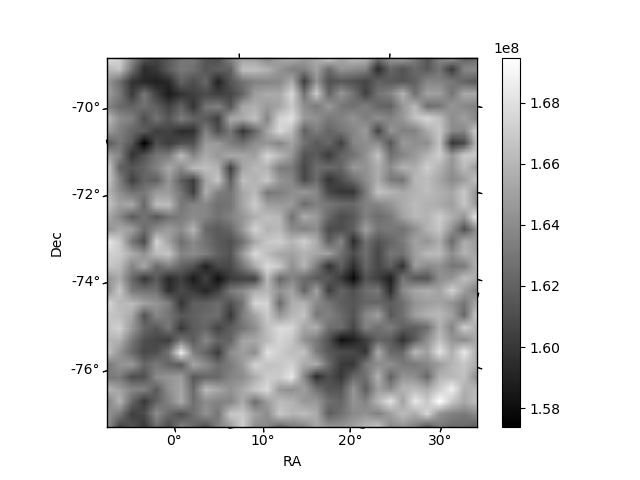
Histogram calculated using DETX and DETY for each event in the final _common_clean file
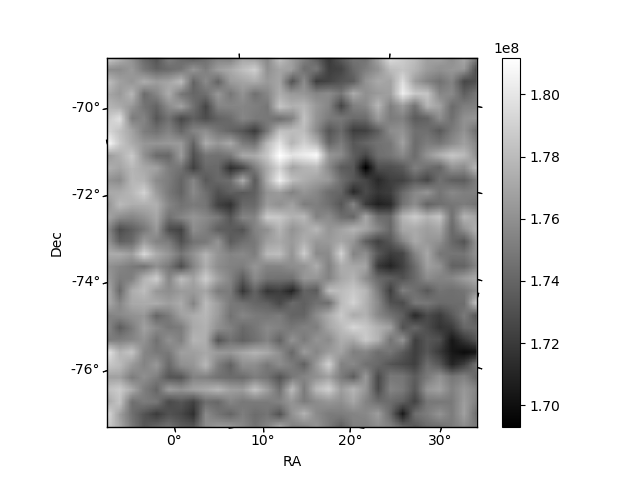
| Quadrant A | 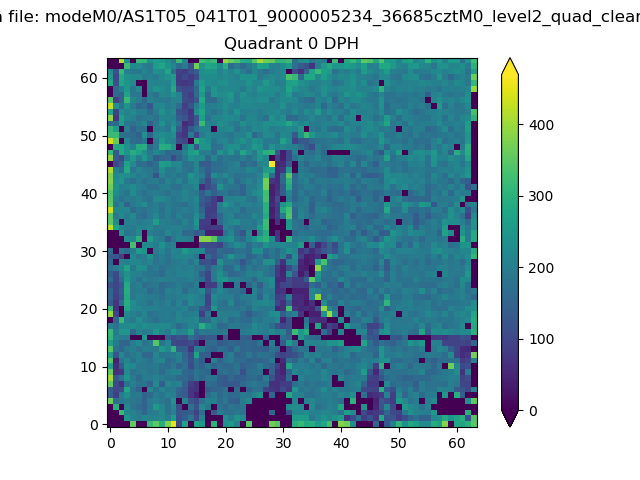 |
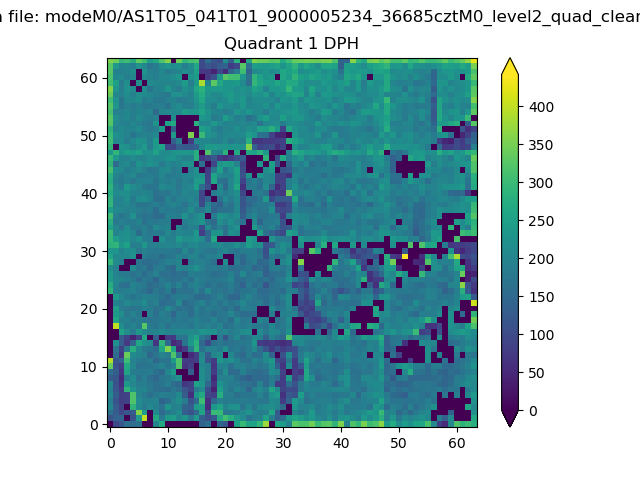 |
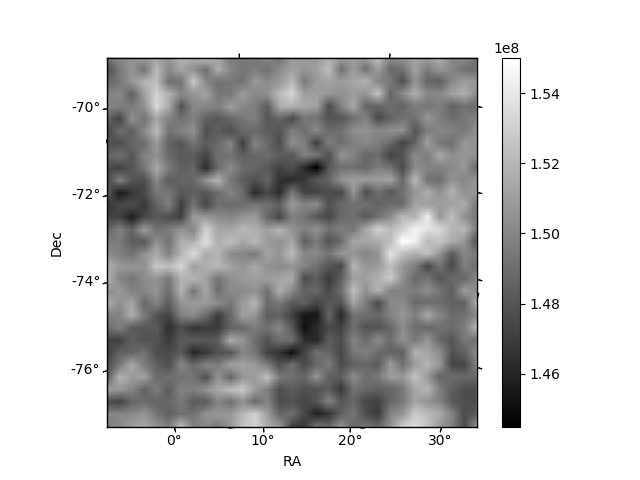
Quadrant B |
|---|---|---|---|
| Quadrant D | 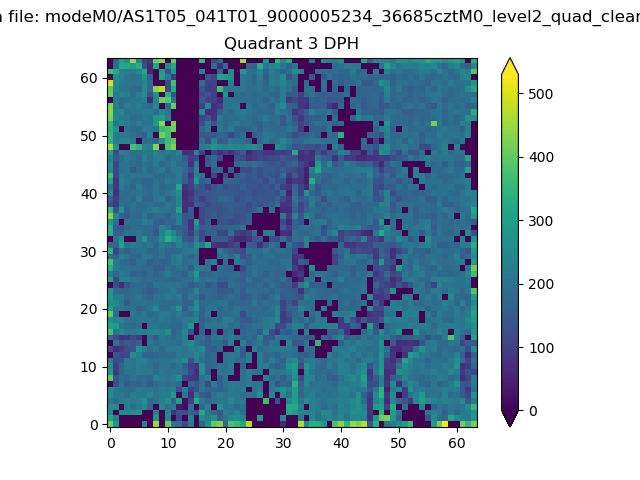 |
 |
Quadrant C |
| Plot type | Count rate plots | Images |
|---|---|---|
| Comparison with Poisson distribution Blue bars denote a histogram of data divided into 1 sec bins. Red curve is a Poisson curve with rate = median count rate of data. |
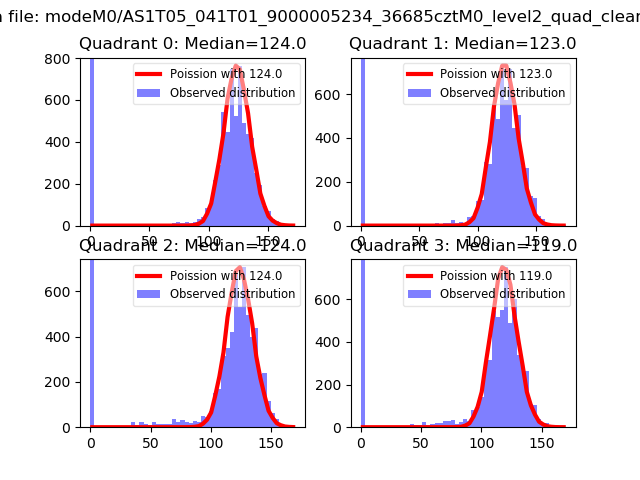 |
 |
| Quadrant-wise count rates Data is divided into 100 sec bins |
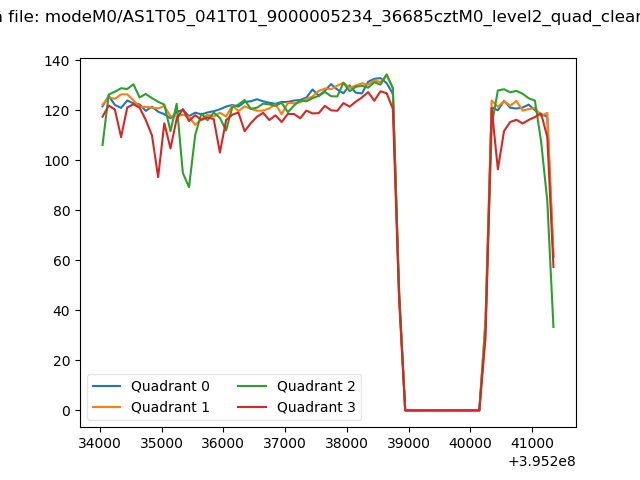 |
|
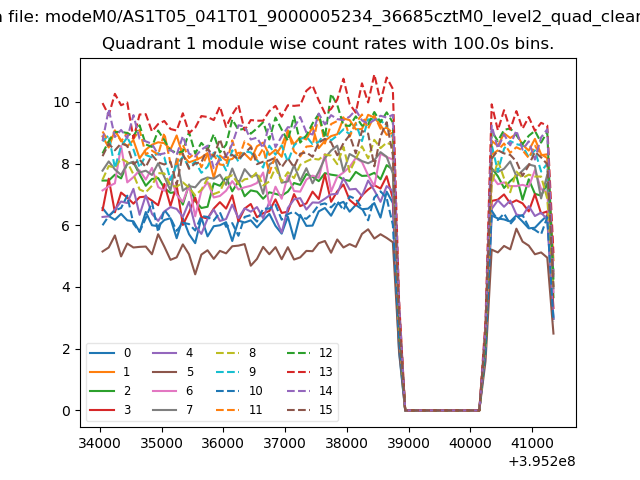
| Module-wise count rates for Quadrant A Data is divided into 100 sec bins |
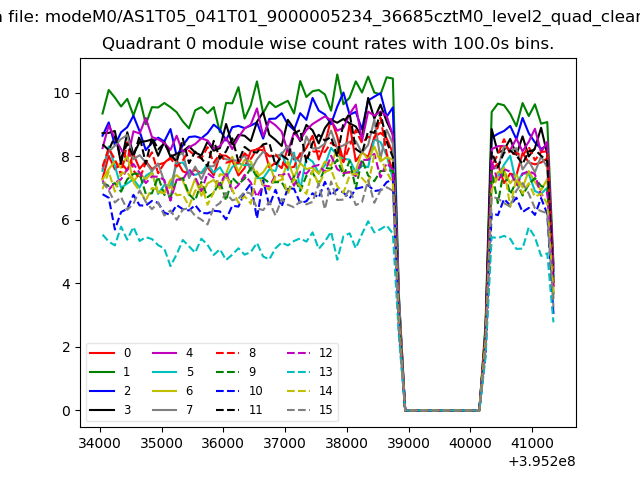 |
 |
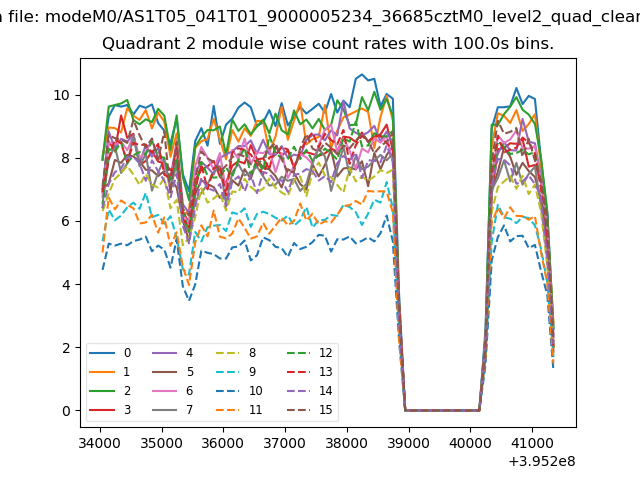
| Module-wise count rates for Quadrant B Data is divided into 100 sec bins |
 |
 |
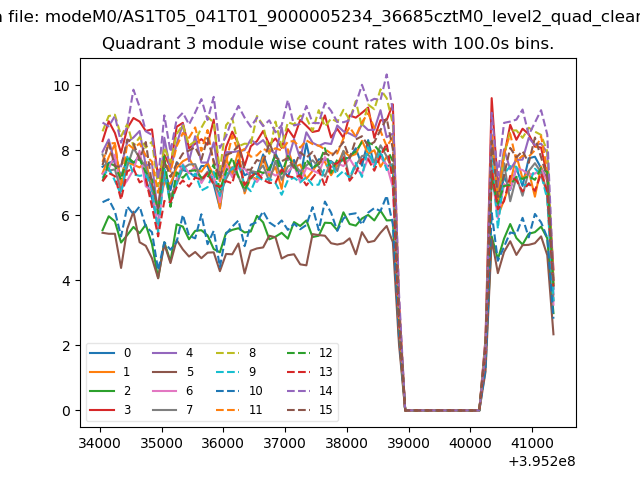
| Module-wise count rates for Quadrant C Data is divided into 100 sec bins |
 |
 |
| Module-wise count rates for Quadrant D Data is divided into 100 sec bins |
 |
 |
| Parameter | Plot |
|---|---|
| CZT HV Monitor | 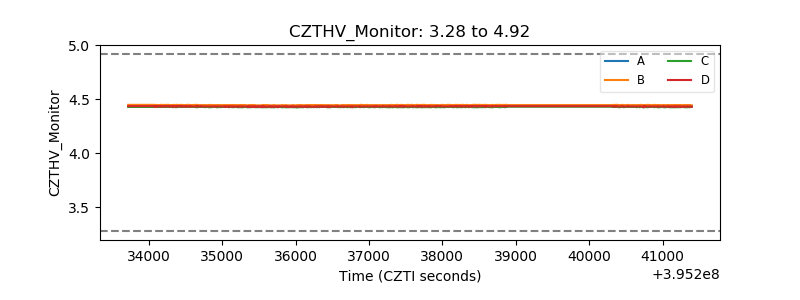 |
| D_VDD | 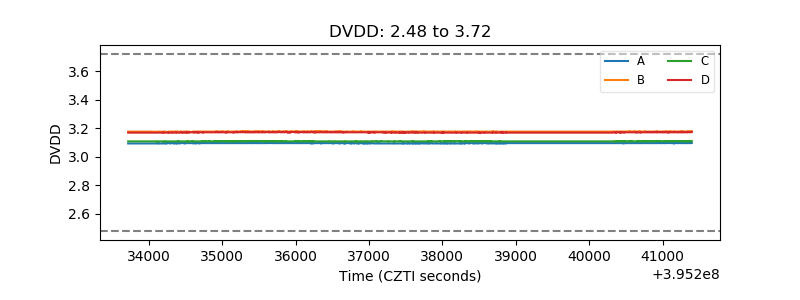 |
| Temperature 1 | 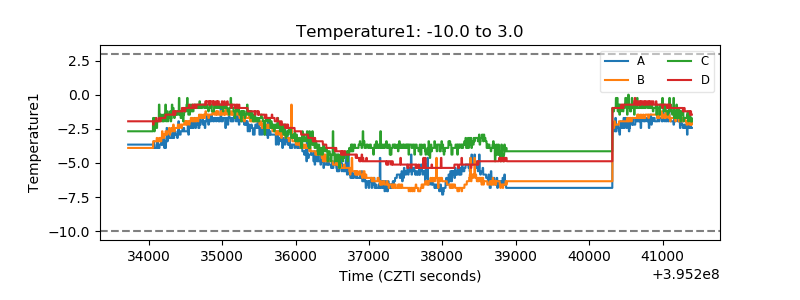 |
| Veto HV Monitor | 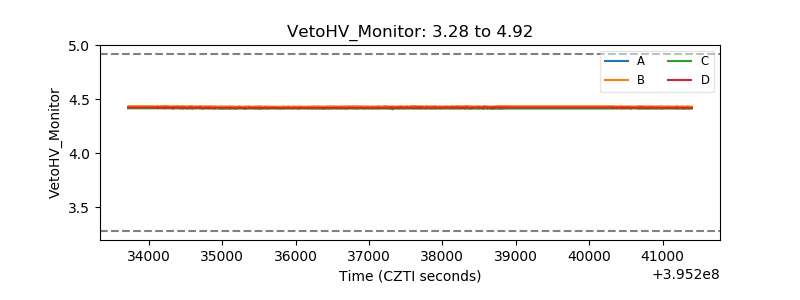 |
| Veto LLD | 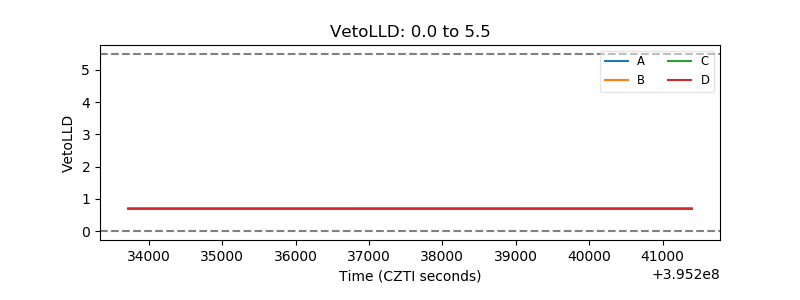 |
| Alpha Counter | 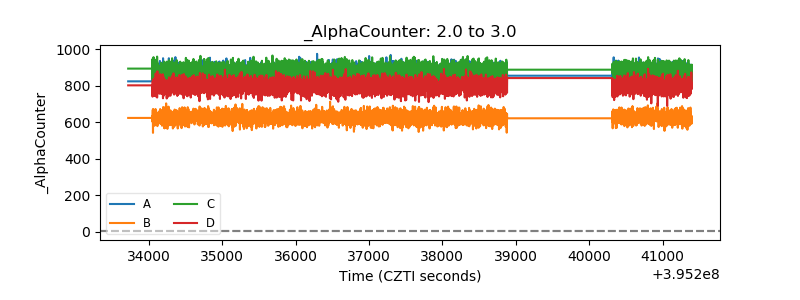 |
| _CPM_Rate | 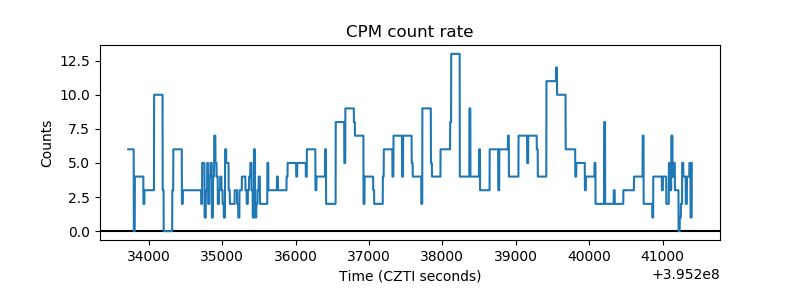 |
| CZT Counter | 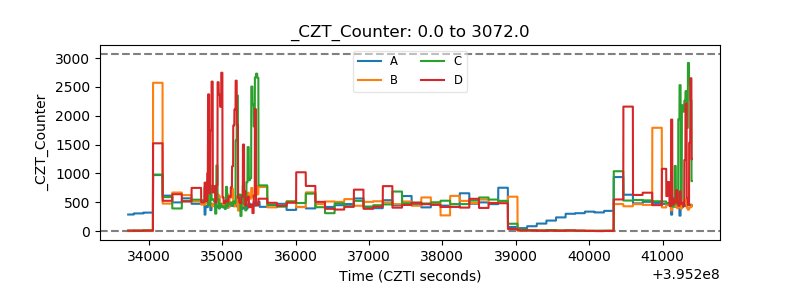 |
| +2.5 Volts monitor |  |
| +5 Volts monitor | 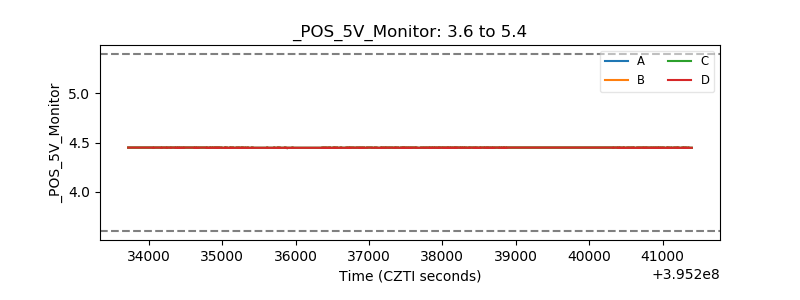 |
| _ROLL_ROT | 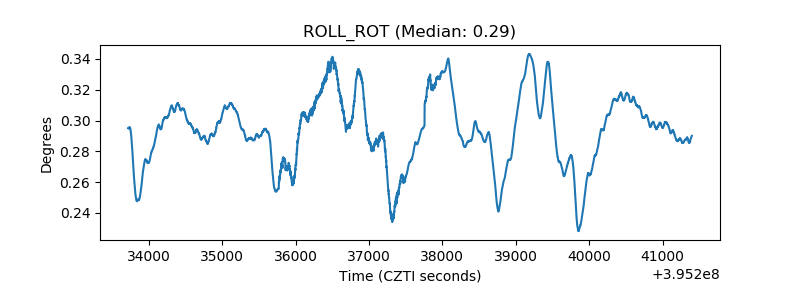 |
| _Roll_DEC |  |
| _Roll_RA | 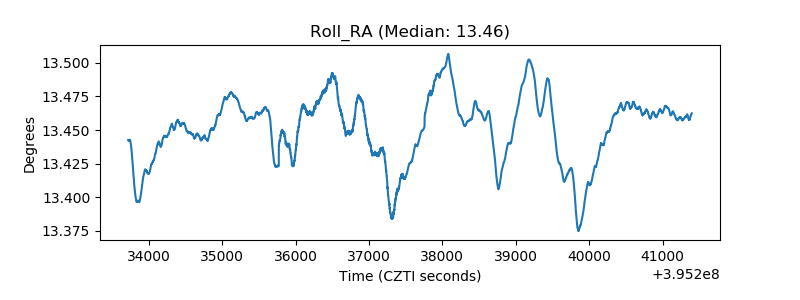 |
| Veto Counter | 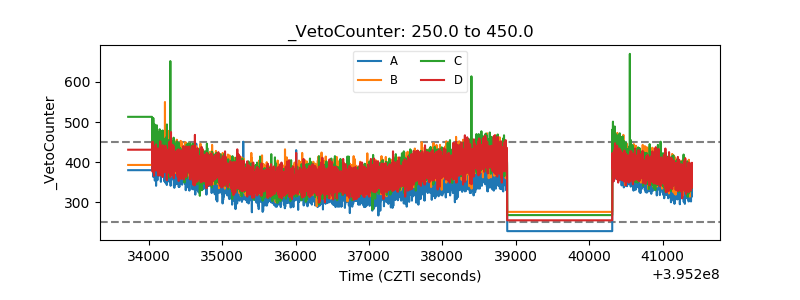 |