| Param | Original file | Final file |
|---|---|---|
| Filename | modeM0/AS1T05_041T01_9000005234_36686cztM0_level2.evt | modeM0/AS1T05_041T01_9000005234_36686cztM0_level2_quad_clean.evt |
| Size (bytes) | 482,811,840 | 101,160,000 |
| Size | 460.4 MB | 96.5 MB |
| Events in quadrant A | 2,637,214 | 689,280 |
| Events in quadrant B | 2,940,003 | 687,331 |
| Events in quadrant C | 4,512,690 | 642,516 |
| Events in quadrant D | 4,150,621 | 651,290 |
| Mode M9 | |||
|---|---|---|---|
| Quadrant | BADHDUFLAG | Total packets | Discarded packets |
| A | 0 | 13 | 0 |
| B | 0 | 13 | 0 |
| C | 0 | 13 | 0 |
| D | 0 | 13 | 0 |
| Mode M0 | |||
|---|---|---|---|
| Quadrant | BADHDUFLAG | Total packets | Discarded packets |
| A | 0 | 11528 | 2 |
| B | 0 | 12470 | 1 |
| C | 0 | 16954 | 1 |
| D | 0 | 16149 | 1 |
| Mode SS | |||
|---|---|---|---|
| Quadrant | BADHDUFLAG | Total packets | Discarded packets |
| A | 0 | 114 | 0 |
| B | 0 | 114 | 0 |
| C | 0 | 114 | 0 |
| D | 0 | 114 | 0 |
| Quadrant | Total seconds | Saturated seconds | Saturation percentage |
|---|---|---|---|
| A | 5619 | 5 | 0.088984% |
| B | 5619 | 61 | 1.085602% |
| C | 5619 | 698 | 12.422139% |
| D | 5619 | 257 | 4.573768% |
Noise dominated data is calculated using 1-second bins in cleaned event files. If a bin has >2000 counts, and if more than 50% of those come from <1% of pixels, then it is considered to be noise-dominated and hence unusable.
| Quadrant | # 1 sec bins | Bins with >0 counts | Bins with >2000 counts | High rate bins dominated by noise | Noise dominated (total time) | Noise dominated (detector-on time) | Marked lightcurve |
|---|---|---|---|---|---|---|---|
| A | 6931 | 5620 | 3 | 3 | 0.04% | 0.05% | 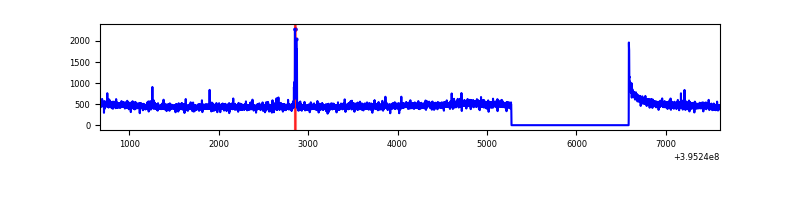 |
| B | 6931 | 5620 | 24 | 24 | 0.35% | 0.43% | 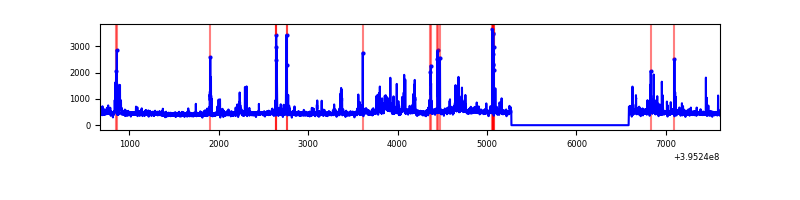 |
| C | 6931 | 5620 | 620 | 620 | 8.95% | 11.03% | 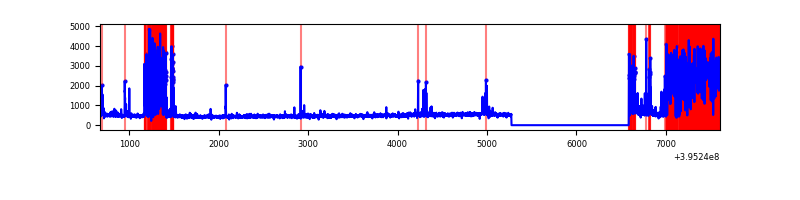 |
| D | 6931 | 5620 | 236 | 236 | 3.40% | 4.20% | 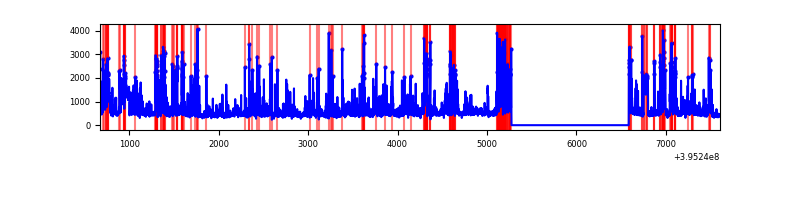 |
Top three noisy pixels from each quadrant. If the there are fewer than three noisy pixels in the level2.evt file, extra rows are filled as -1
| Pixel properties | Quadrant properties | ||||||
|---|---|---|---|---|---|---|---|
| Quadrant | DetID | PixID | Counts | Sigma | Mean | Median | Sigma |
| A | 10 | 83 | 179578 | 1403.31 | 624 | 611 | 127.5 |
| A | 15 | 223 | 30797 | 236.69 | 624 | 611 | 127.5 |
| A | 13 | 6 | 12219 | 91.02 | 624 | 611 | 127.5 |
| B | 0 | 189 | 150087 | 1259.81 | 618 | 600 | 118.7 |
| B | 5 | 255 | 147166 | 1235.19 | 618 | 600 | 118.7 |
| B | 4 | 232 | 77059 | 644.36 | 618 | 600 | 118.7 |
| C | 1 | 23 | 1769056 | 13219.14 | 575 | 581 | 133.8 |
| C | 15 | 214 | 236073 | 1760.27 | 575 | 581 | 133.8 |
| C | 0 | 10 | 162226 | 1208.28 | 575 | 581 | 133.8 |
| D | 2 | 249 | 591930 | 4070.97 | 600 | 584 | 145.3 |
| D | 12 | 233 | 378058 | 2598.62 | 600 | 584 | 145.3 |
| D | 7 | 55 | 133587 | 915.63 | 600 | 584 | 145.3 |
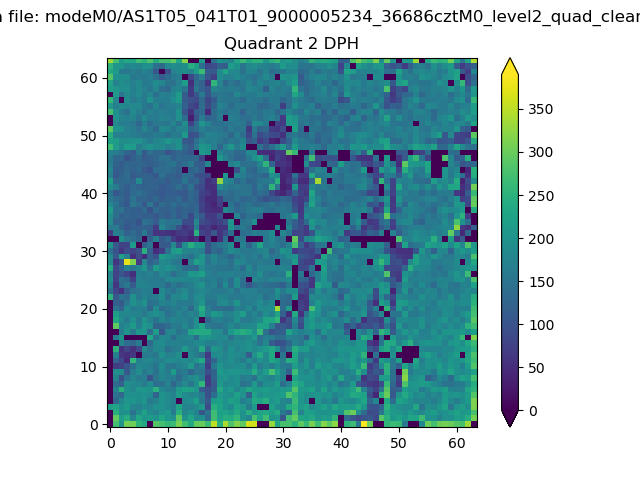
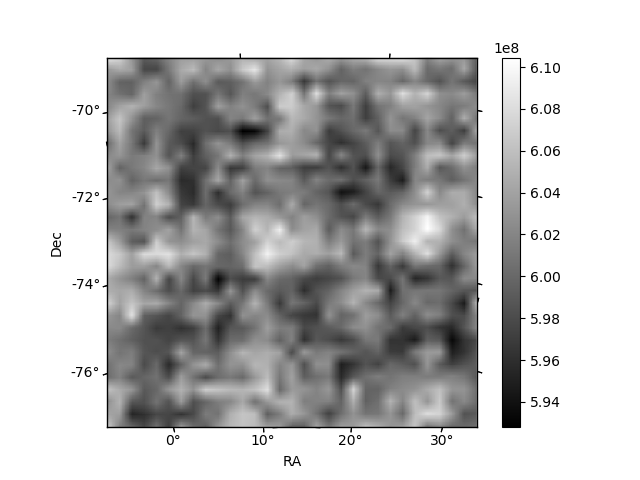
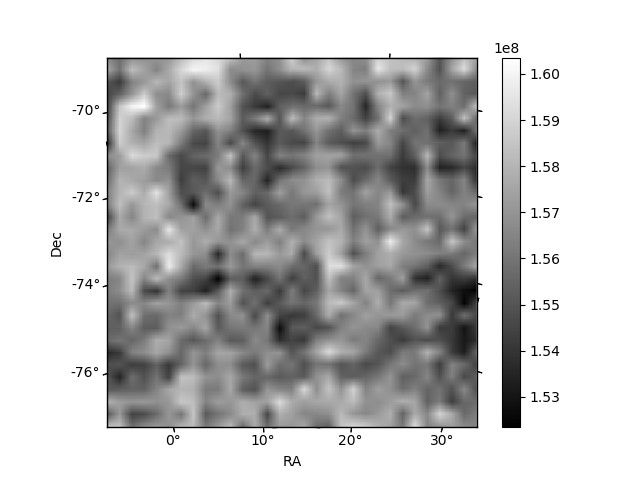
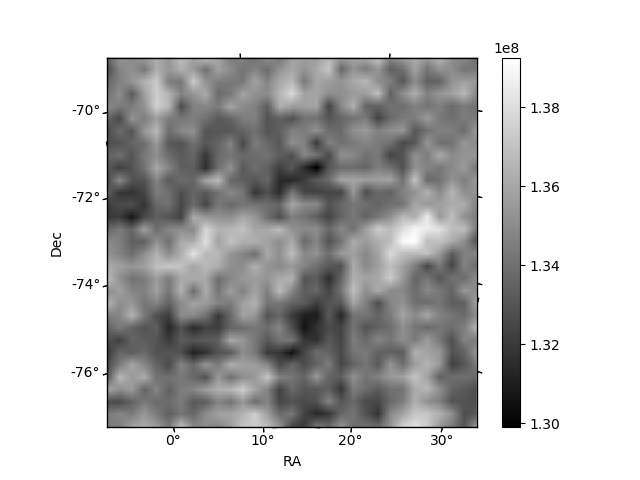
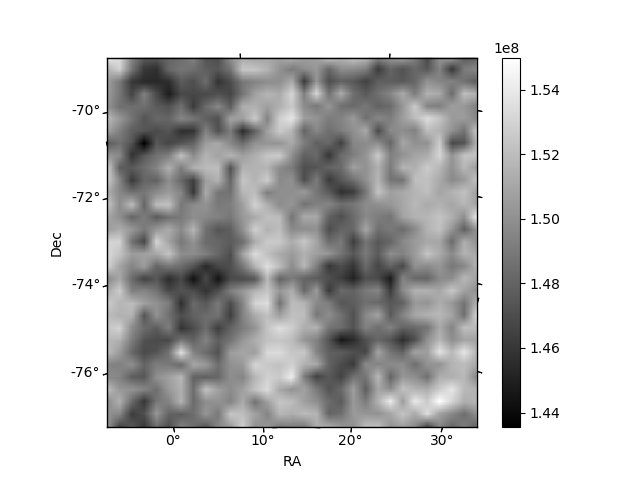
Histogram calculated using DETX and DETY for each event in the final _common_clean file
| Quadrant A | 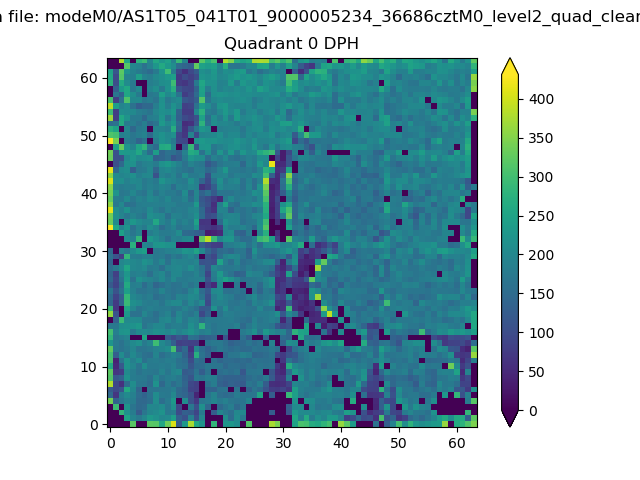 |
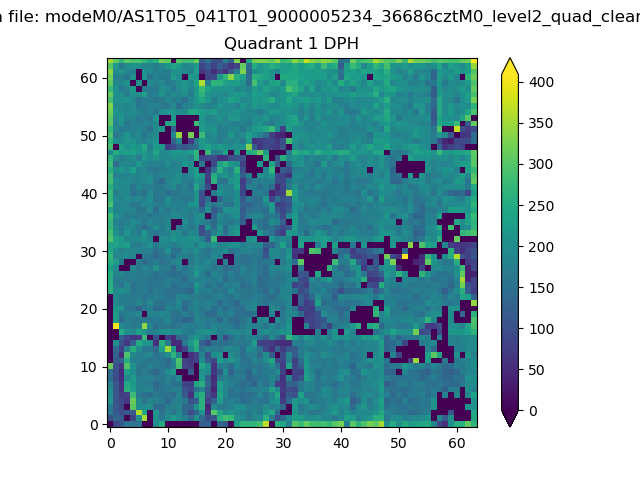 |
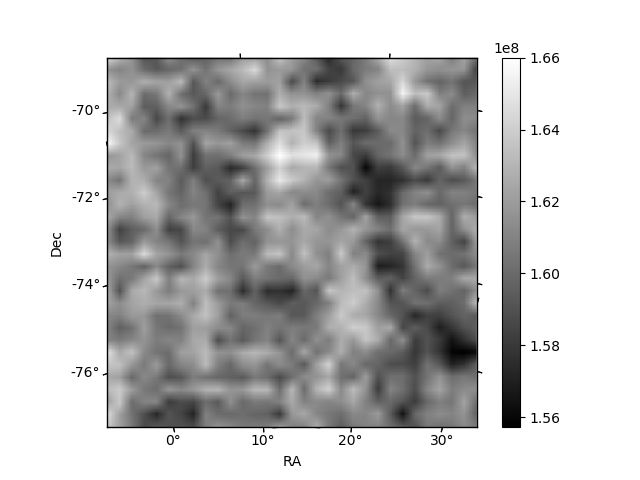
Quadrant B |
|---|---|---|---|
| Quadrant D | 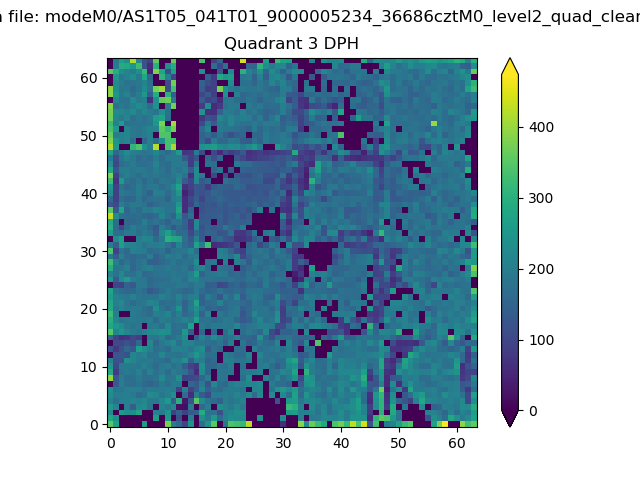 |
 |
Quadrant C |
| Plot type | Count rate plots | Images |
|---|---|---|
| Comparison with Poisson distribution Blue bars denote a histogram of data divided into 1 sec bins. Red curve is a Poisson curve with rate = median count rate of data. |
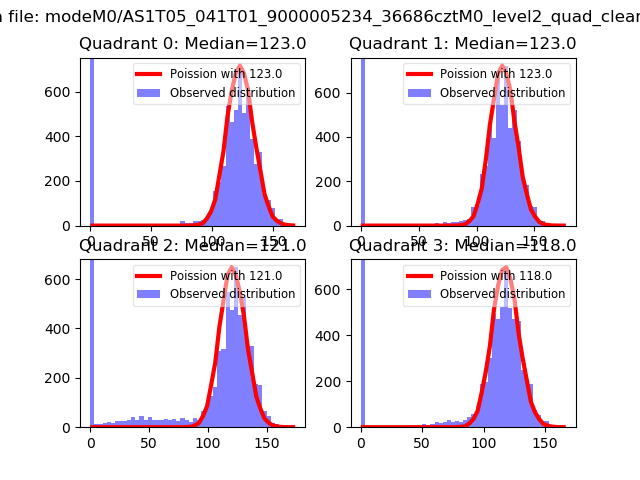 |
 |
| Quadrant-wise count rates Data is divided into 100 sec bins |
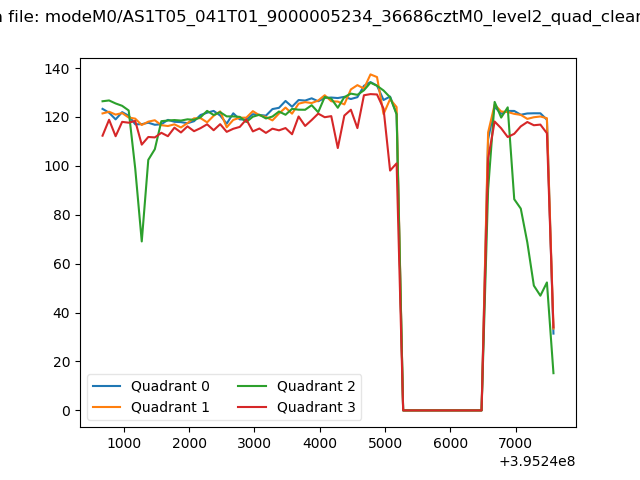 |
|
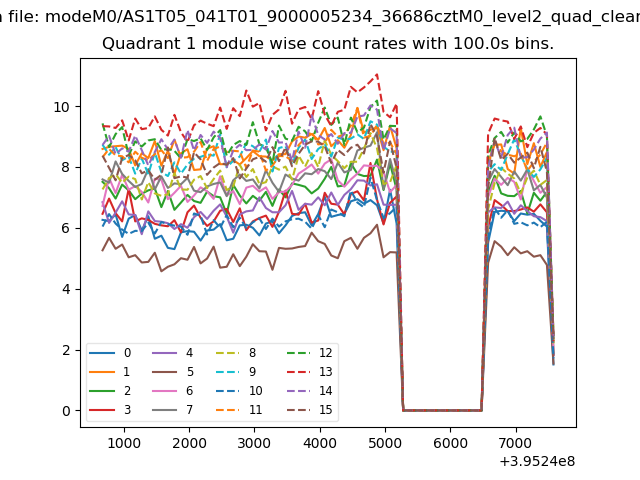
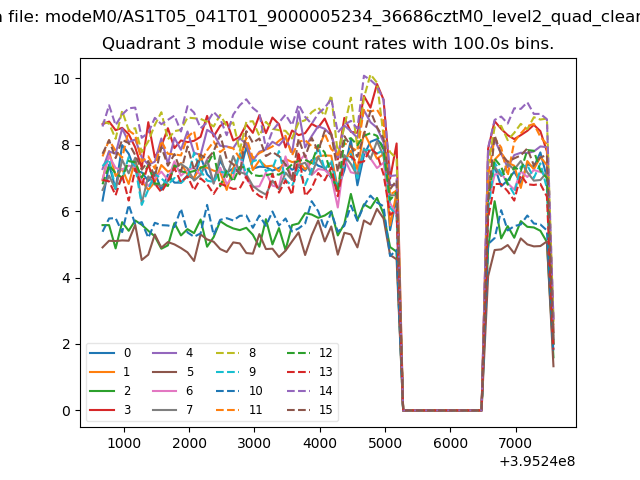
| Module-wise count rates for Quadrant A Data is divided into 100 sec bins |
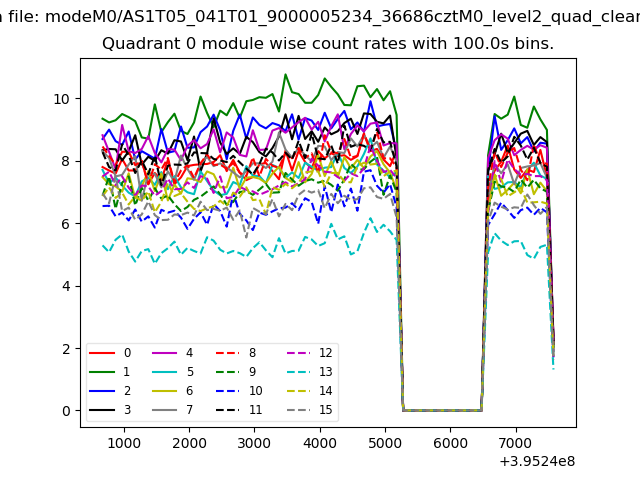 |
 |
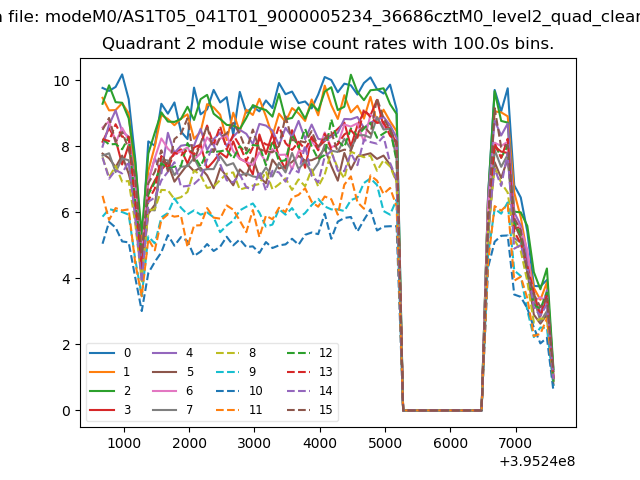
| Module-wise count rates for Quadrant B Data is divided into 100 sec bins |
 |
 |
| Module-wise count rates for Quadrant C Data is divided into 100 sec bins |
 |
 |
| Module-wise count rates for Quadrant D Data is divided into 100 sec bins |
 |
 |
| Parameter | Plot |
|---|---|
| CZT HV Monitor |  |
| D_VDD | 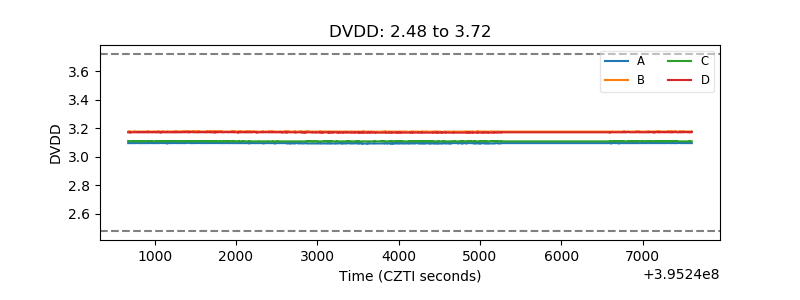 |
| Temperature 1 | 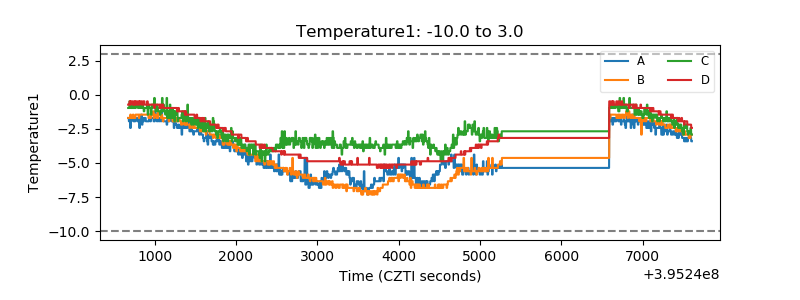 |
| Veto HV Monitor | 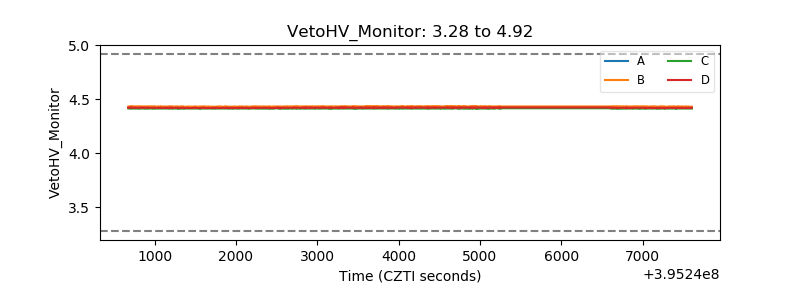 |
| Veto LLD | 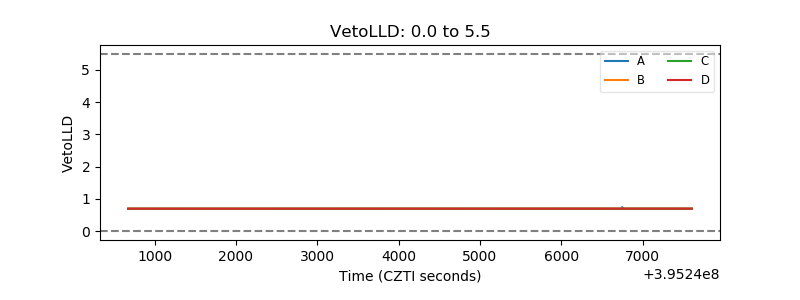 |
| Alpha Counter | 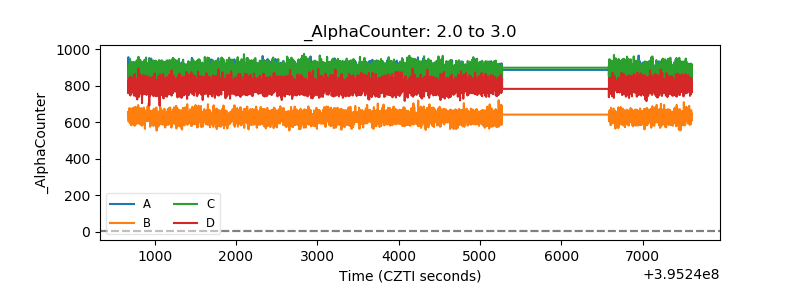 |
| _CPM_Rate | 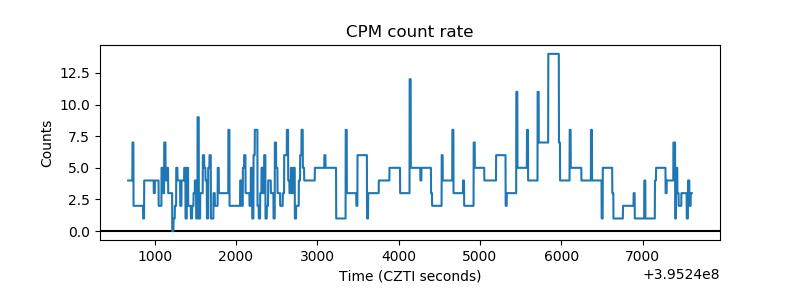 |
| CZT Counter | 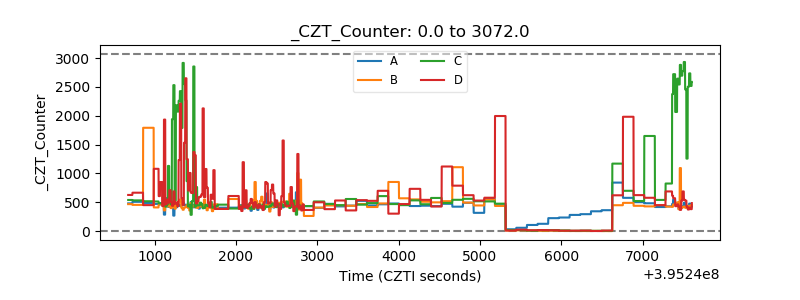 |
| +2.5 Volts monitor |  |
| +5 Volts monitor | 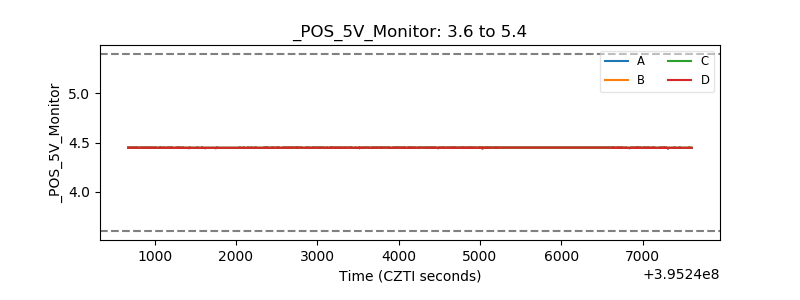 |
| _ROLL_ROT | 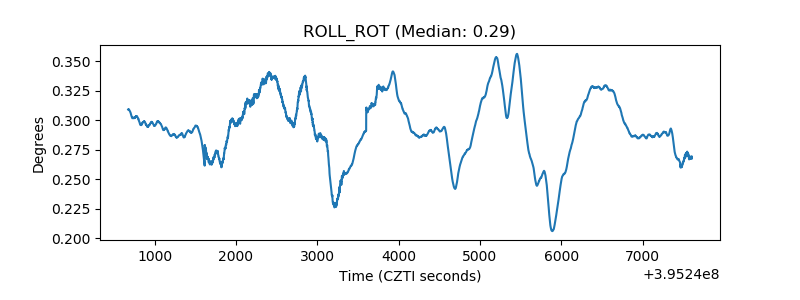 |
| _Roll_DEC | 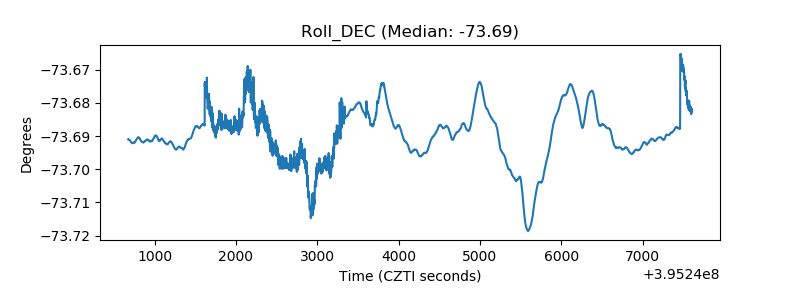 |
| _Roll_RA | 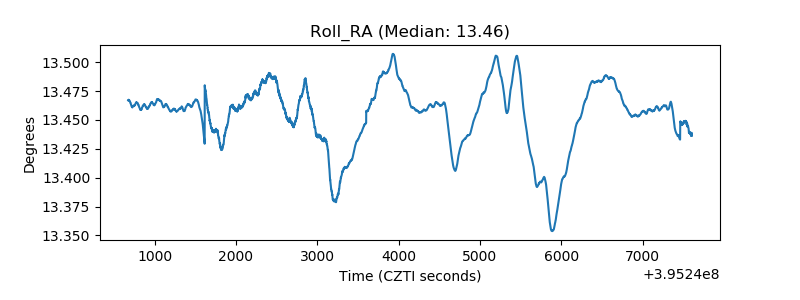 |
| Veto Counter | 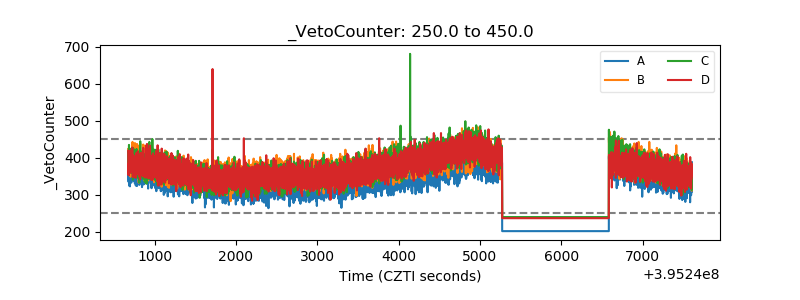 |