| Param | Original file | Final file |
|---|---|---|
| Filename | modeM0/AS1T05_041T01_9000005234_36689cztM0_level2.evt | modeM0/AS1T05_041T01_9000005234_36689cztM0_level2_quad_clean.evt |
| Size (bytes) | 1,245,790,080 | 275,155,200 |
| Size | 1.2 GB | 262.4 MB |
| Events in quadrant A | 7,251,398 | 1,875,384 |
| Events in quadrant B | 8,462,156 | 1,868,485 |
| Events in quadrant C | 10,391,144 | 1,791,796 |
| Events in quadrant D | 10,588,223 | 1,739,834 |
| Mode M9 | |||
|---|---|---|---|
| Quadrant | BADHDUFLAG | Total packets | Discarded packets |
| A | 0 | 42 | 0 |
| B | 0 | 42 | 0 |
| C | 0 | 42 | 0 |
| D | 0 | 42 | 0 |
| Mode M0 | |||
|---|---|---|---|
| Quadrant | BADHDUFLAG | Total packets | Discarded packets |
| A | 0 | 31726 | 4 |
| B | 0 | 35038 | 3 |
| C | 0 | 40454 | 3 |
| D | 0 | 42047 | 3 |
| Mode SS | |||
|---|---|---|---|
| Quadrant | BADHDUFLAG | Total packets | Discarded packets |
| A | 0 | 314 | 0 |
| B | 0 | 314 | 0 |
| C | 0 | 314 | 0 |
| D | 0 | 314 | 0 |
| Quadrant | Total seconds | Saturated seconds | Saturation percentage |
|---|---|---|---|
| A | 15336 | 33 | 0.215180% |
| B | 15336 | 219 | 1.428013% |
| C | 15336 | 1068 | 6.964006% |
| D | 15336 | 850 | 5.542514% |
Noise dominated data is calculated using 1-second bins in cleaned event files. If a bin has >2000 counts, and if more than 50% of those come from <1% of pixels, then it is considered to be noise-dominated and hence unusable.
| Quadrant | # 1 sec bins | Bins with >0 counts | Bins with >2000 counts | High rate bins dominated by noise | Noise dominated (total time) | Noise dominated (detector-on time) | Marked lightcurve |
|---|---|---|---|---|---|---|---|
| A | 19515 | 15339 | 18 | 18 | 0.09% | 0.12% | 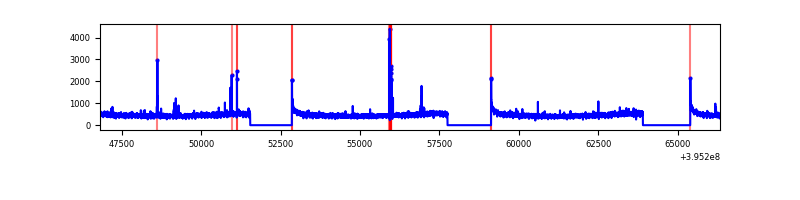 |
| B | 19515 | 15339 | 138 | 138 | 0.71% | 0.90% | 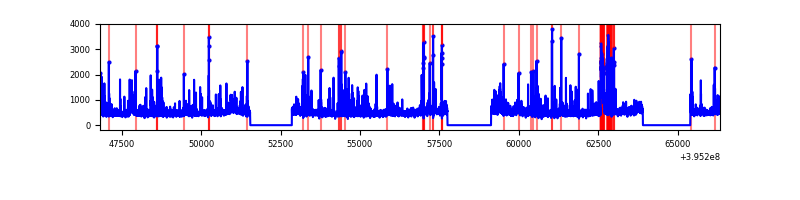 |
| C | 19515 | 15339 | 928 | 928 | 4.76% | 6.05% | 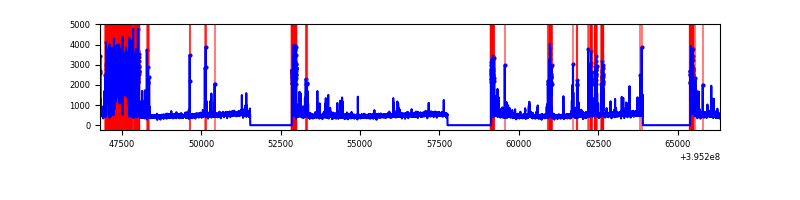 |
| D | 19515 | 15339 | 654 | 654 | 3.35% | 4.26% | 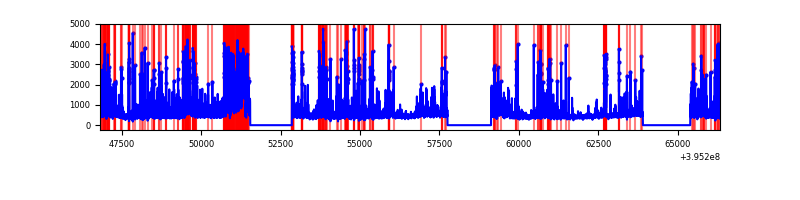 |
Top three noisy pixels from each quadrant. If the there are fewer than three noisy pixels in the level2.evt file, extra rows are filled as -1
| Pixel properties | Quadrant properties | ||||||
|---|---|---|---|---|---|---|---|
| Quadrant | DetID | PixID | Counts | Sigma | Mean | Median | Sigma |
| A | 10 | 83 | 478877 | 1388.85 | 1713 | 1678 | 343.6 |
| A | 9 | 143 | 106353 | 304.65 | 1713 | 1678 | 343.6 |
| A | 13 | 6 | 36159 | 100.35 | 1713 | 1678 | 343.6 |
| B | 5 | 255 | 730765 | 2271.38 | 1699 | 1652 | 321.0 |
| B | 0 | 189 | 658423 | 2046.01 | 1699 | 1652 | 321.0 |
| B | 4 | 232 | 96609 | 295.82 | 1699 | 1652 | 321.0 |
| C | 1 | 23 | 2646329 | 7057.27 | 1627 | 1640 | 374.7 |
| C | 15 | 214 | 661911 | 1761.91 | 1627 | 1640 | 374.7 |
| C | 0 | 10 | 501905 | 1334.94 | 1627 | 1640 | 374.7 |
| D | 12 | 233 | 944756 | 2365.52 | 1634 | 1581 | 398.7 |
| D | 2 | 249 | 881531 | 2206.95 | 1634 | 1581 | 398.7 |
| D | 13 | 249 | 729433 | 1825.48 | 1634 | 1581 | 398.7 |
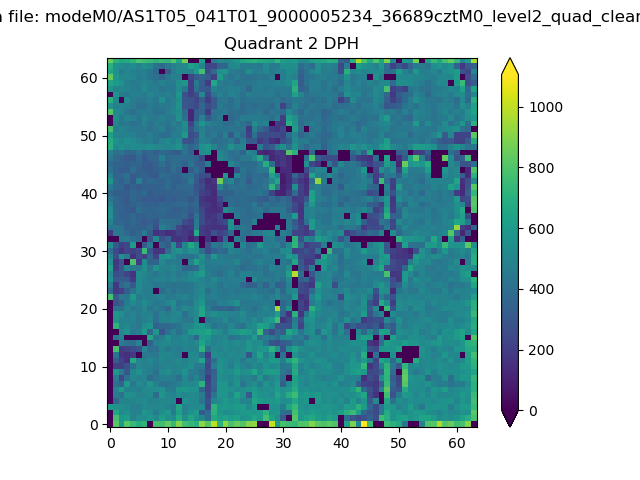
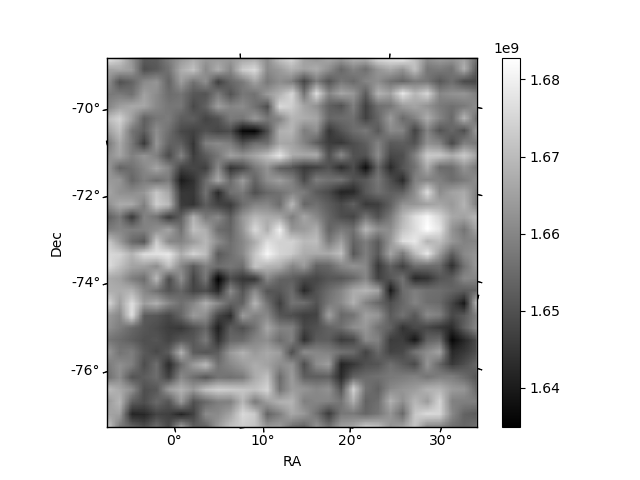
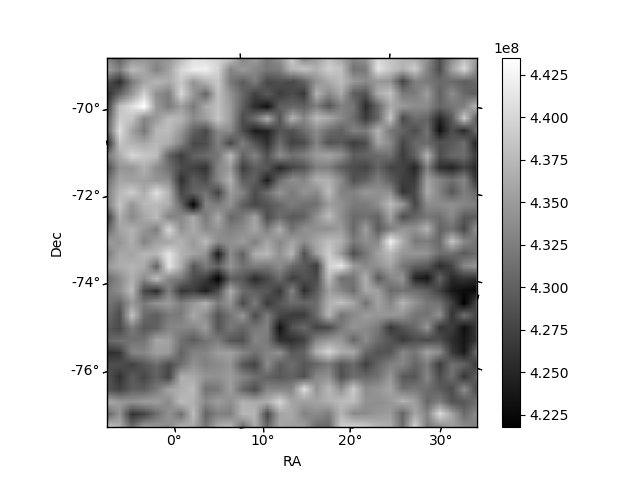
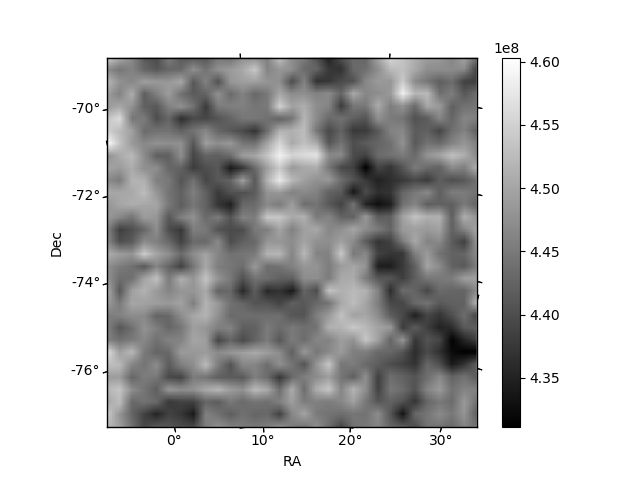
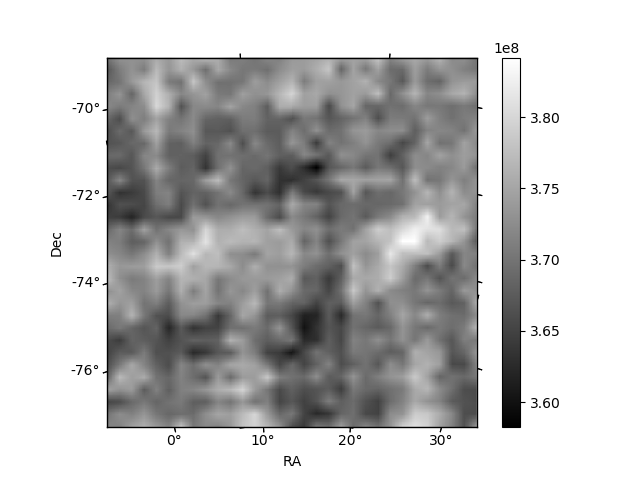
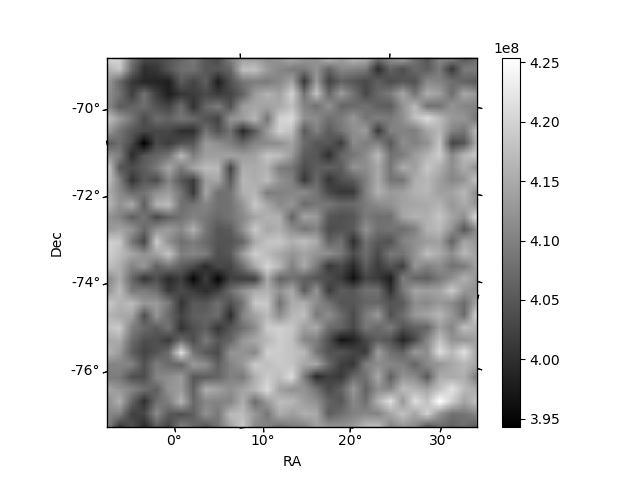
Histogram calculated using DETX and DETY for each event in the final _common_clean file
| Quadrant A | 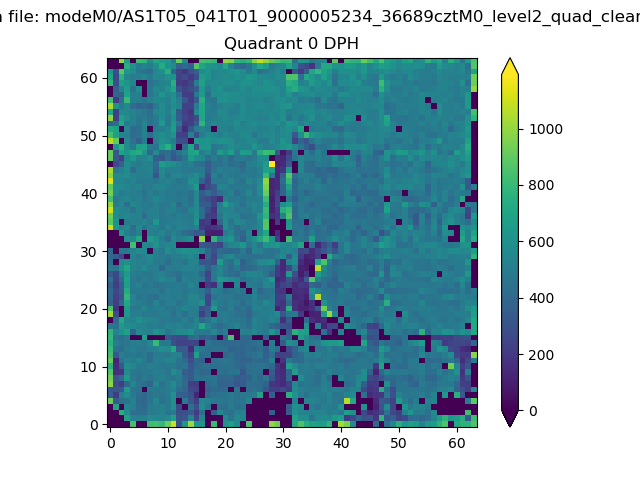 |
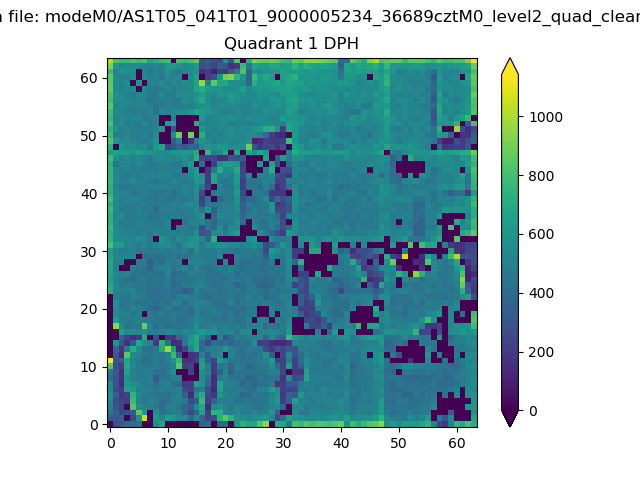 |
Quadrant B |
|---|---|---|---|
| Quadrant D | 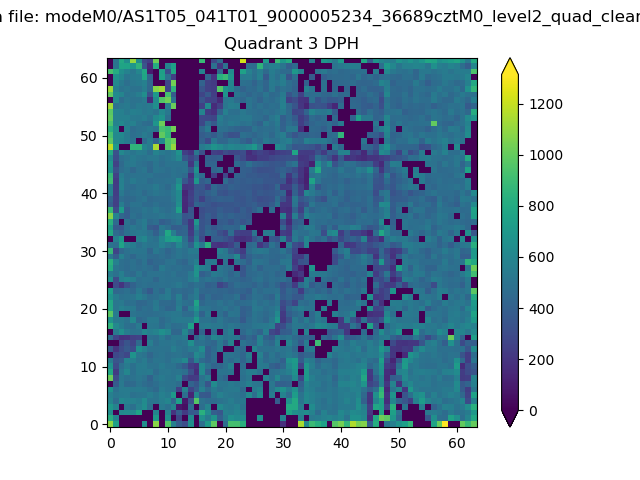 |
 |
Quadrant C |
| Plot type | Count rate plots | Images |
|---|---|---|
| Comparison with Poisson distribution Blue bars denote a histogram of data divided into 1 sec bins. Red curve is a Poisson curve with rate = median count rate of data. |
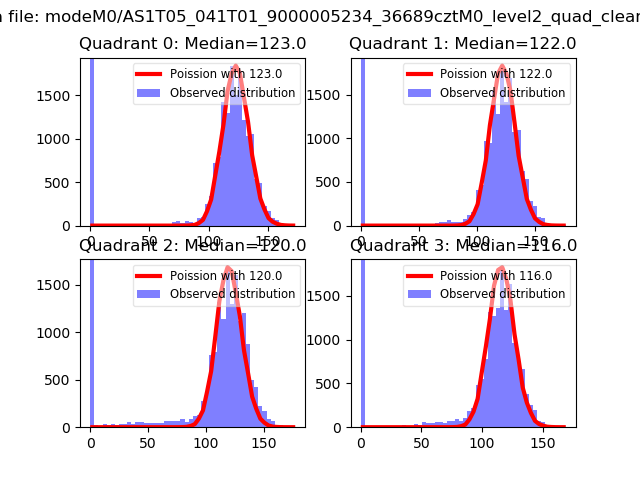 |
 |
| Quadrant-wise count rates Data is divided into 100 sec bins |
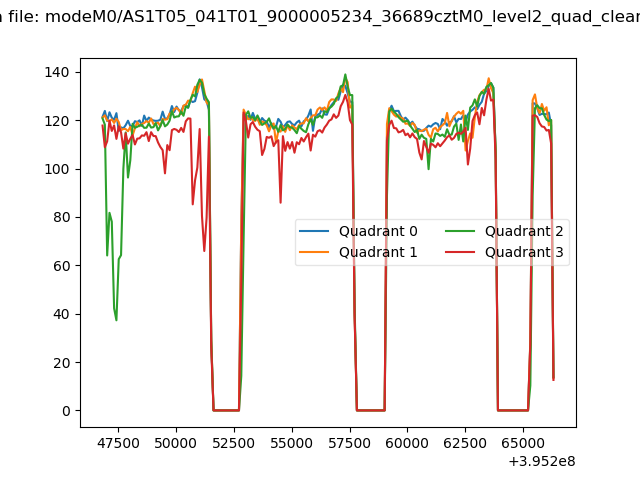 |
|
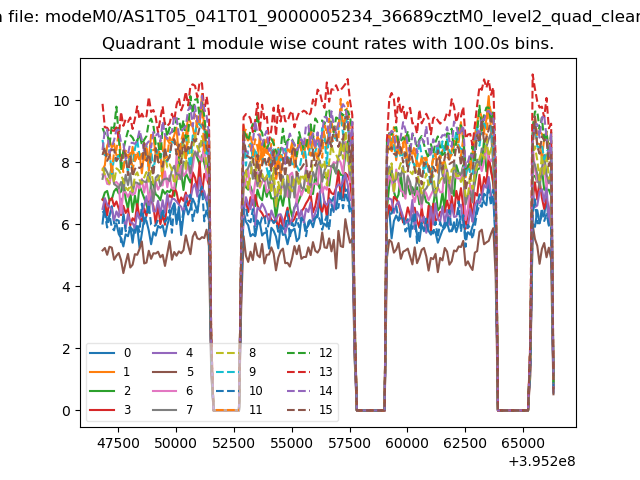
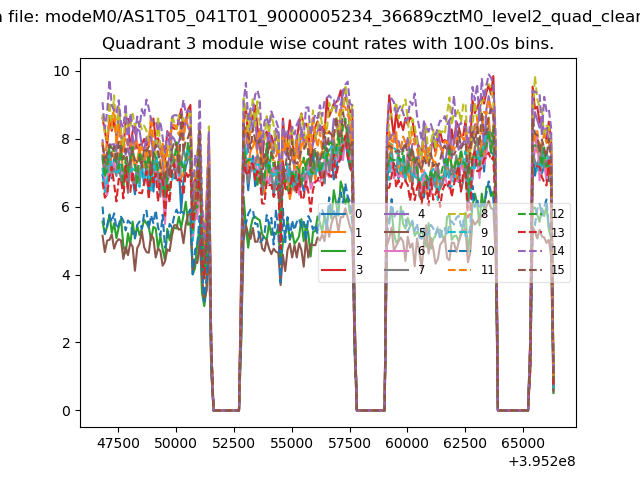
| Module-wise count rates for Quadrant A Data is divided into 100 sec bins |
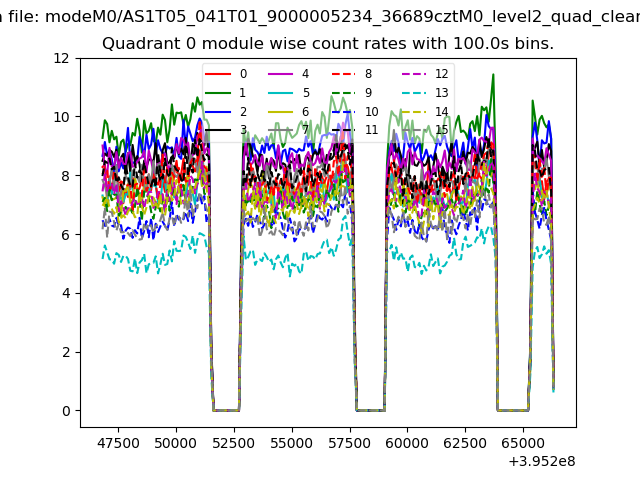 |
 |
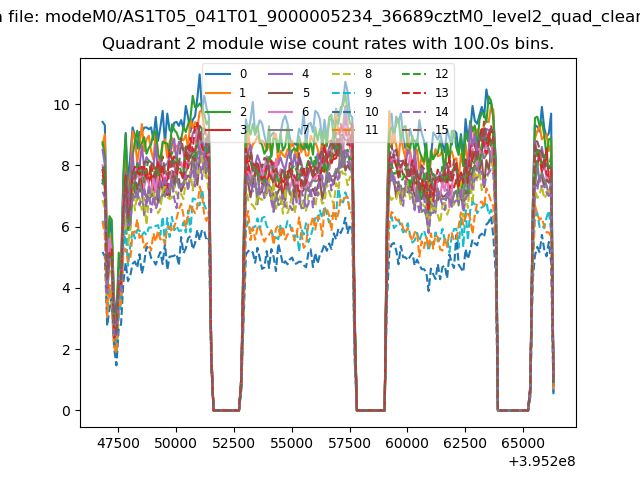
| Module-wise count rates for Quadrant B Data is divided into 100 sec bins |
 |
 |
| Module-wise count rates for Quadrant C Data is divided into 100 sec bins |
 |
 |
| Module-wise count rates for Quadrant D Data is divided into 100 sec bins |
 |
 |
| Parameter | Plot |
|---|---|
| CZT HV Monitor |  |
| D_VDD | 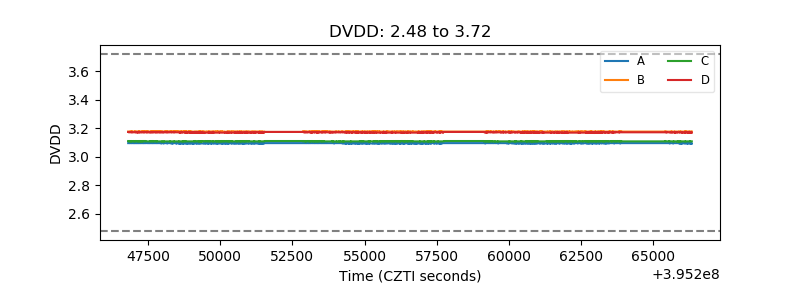 |
| Temperature 1 | 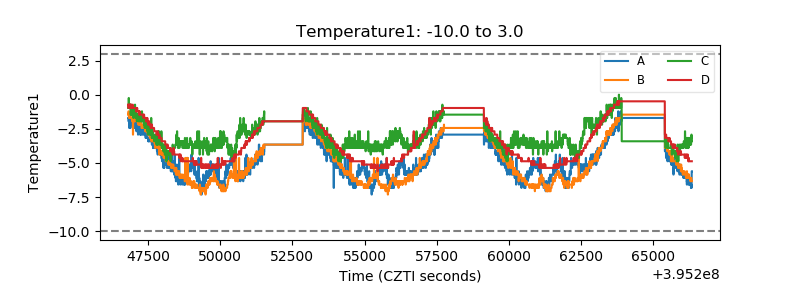 |
| Veto HV Monitor | 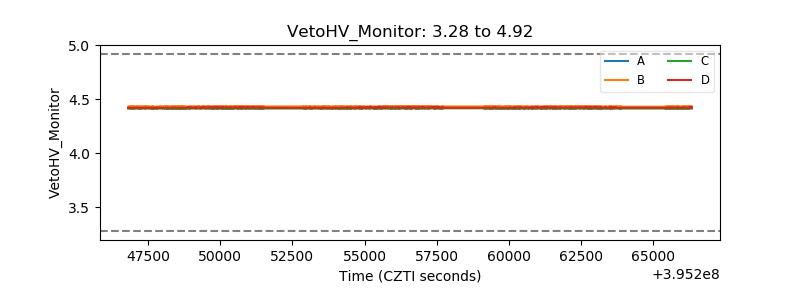 |
| Veto LLD | 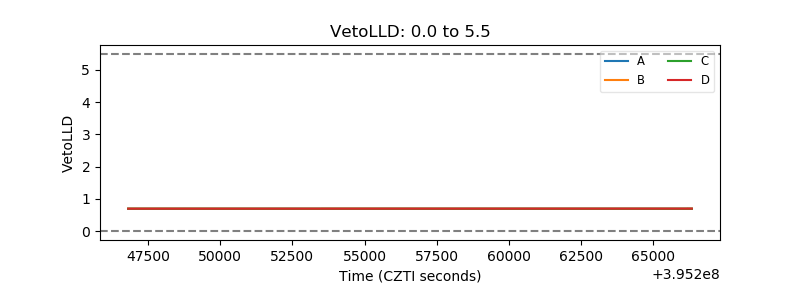 |
| Alpha Counter | 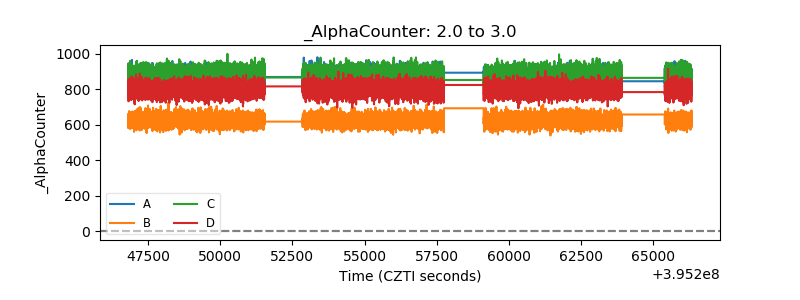 |
| _CPM_Rate | 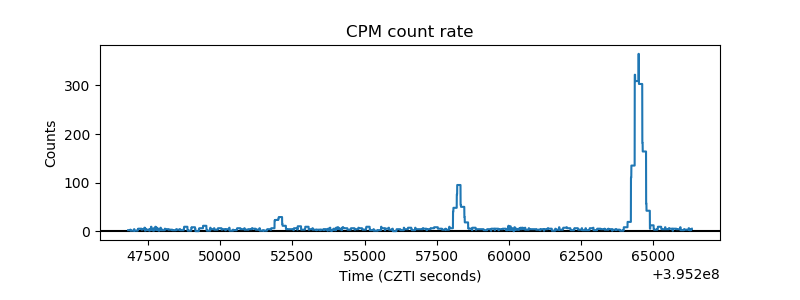 |
| CZT Counter | 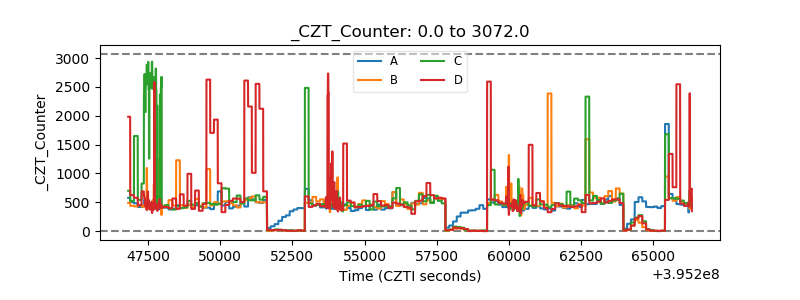 |
| +2.5 Volts monitor | 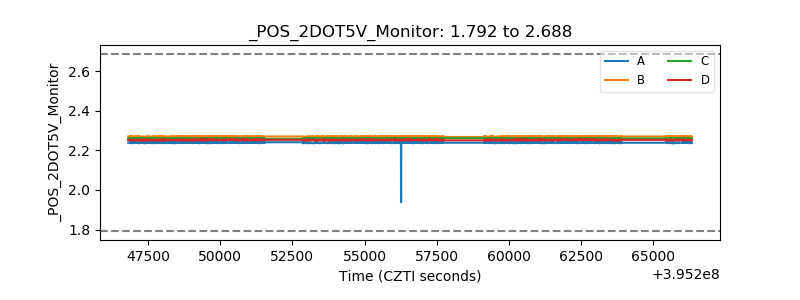 |
| +5 Volts monitor |  |
| _ROLL_ROT | 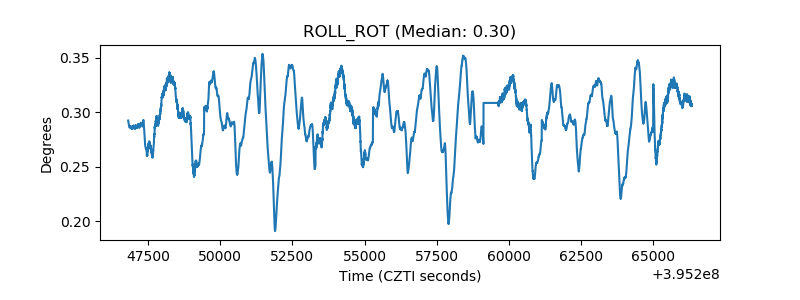 |
| _Roll_DEC | 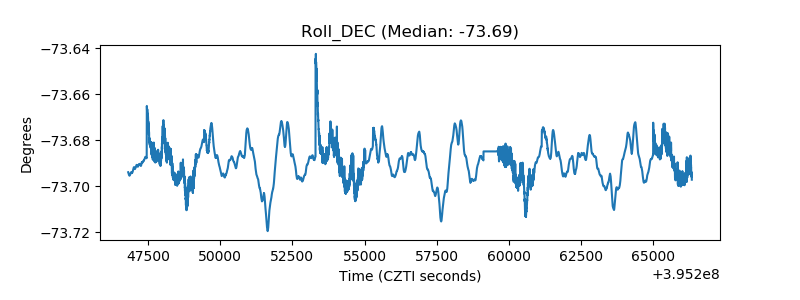 |
| _Roll_RA | 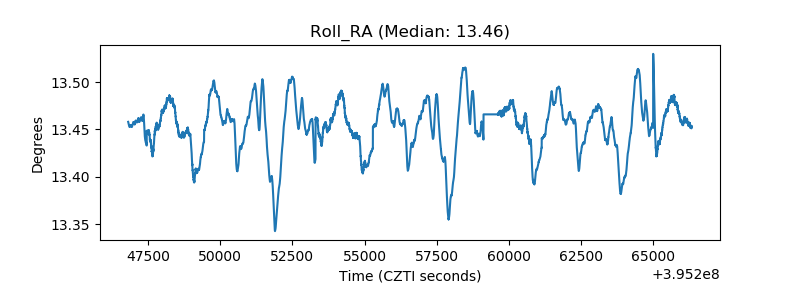 |
| Veto Counter | 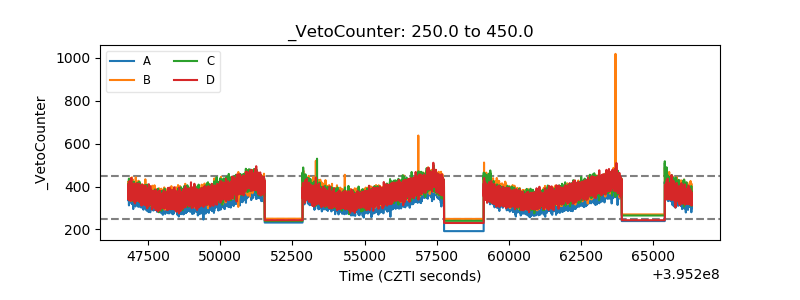 |