| Param | Original file | Final file |
|---|---|---|
| Filename | modeM0/AS1T05_041T01_9000005234_36690cztM0_level2.evt | modeM0/AS1T05_041T01_9000005234_36690cztM0_level2_quad_clean.evt |
| Size (bytes) | 420,134,400 | 101,162,880 |
| Size | 400.7 MB | 96.5 MB |
| Events in quadrant A | 2,617,012 | 684,504 |
| Events in quadrant B | 3,019,283 | 682,736 |
| Events in quadrant C | 3,345,605 | 665,491 |
| Events in quadrant D | 3,367,984 | 646,078 |
| Mode M9 | |||
|---|---|---|---|
| Quadrant | BADHDUFLAG | Total packets | Discarded packets |
| A | 0 | 27 | 0 |
| B | 0 | 27 | 0 |
| C | 0 | 27 | 0 |
| D | 0 | 28 | 0 |
| Mode M0 | |||
|---|---|---|---|
| Quadrant | BADHDUFLAG | Total packets | Discarded packets |
| A | 0 | 11472 | 3 |
| B | 0 | 12553 | 2 |
| C | 0 | 13292 | 2 |
| D | 0 | 13811 | 2 |
| Mode SS | |||
|---|---|---|---|
| Quadrant | BADHDUFLAG | Total packets | Discarded packets |
| A | 0 | 112 | 0 |
| B | 0 | 112 | 0 |
| C | 0 | 112 | 0 |
| D | 0 | 112 | 0 |
| Quadrant | Total seconds | Saturated seconds | Saturation percentage |
|---|---|---|---|
| A | 5500 | 10 | 0.181818% |
| B | 5500 | 75 | 1.363636% |
| C | 5500 | 222 | 4.036364% |
| D | 5500 | 152 | 2.763636% |
Noise dominated data is calculated using 1-second bins in cleaned event files. If a bin has >2000 counts, and if more than 50% of those come from <1% of pixels, then it is considered to be noise-dominated and hence unusable.
| Quadrant | # 1 sec bins | Bins with >0 counts | Bins with >2000 counts | High rate bins dominated by noise | Noise dominated (total time) | Noise dominated (detector-on time) | Marked lightcurve |
|---|---|---|---|---|---|---|---|
| A | 7114 | 5501 | 1 | 1 | 0.01% | 0.02% | 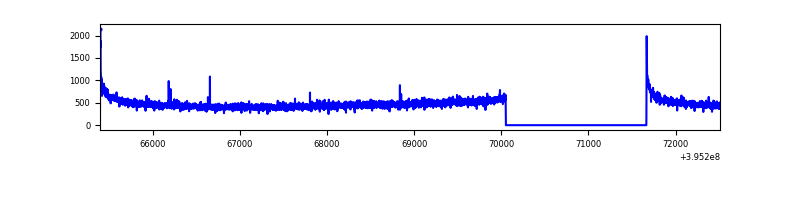 |
| B | 7114 | 5501 | 40 | 40 | 0.56% | 0.73% | 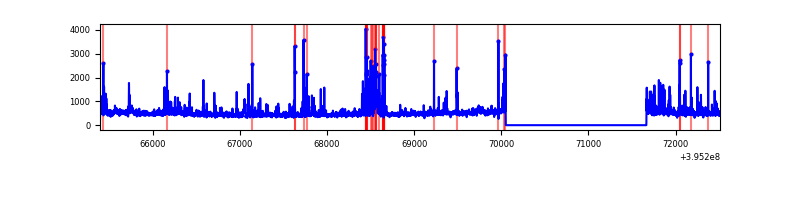 |
| C | 7114 | 5501 | 175 | 175 | 2.46% | 3.18% | 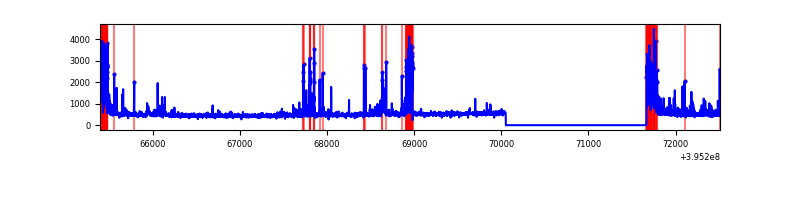 |
| D | 7114 | 5501 | 138 | 138 | 1.94% | 2.51% | 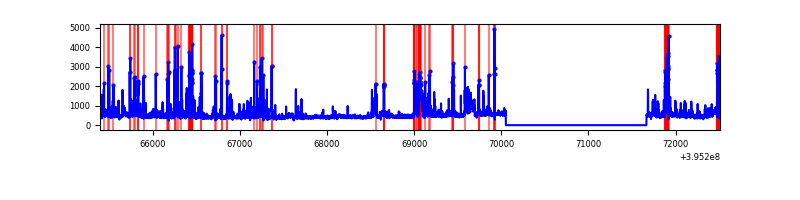 |
Top three noisy pixels from each quadrant. If the there are fewer than three noisy pixels in the level2.evt file, extra rows are filled as -1
| Pixel properties | Quadrant properties | ||||||
|---|---|---|---|---|---|---|---|
| Quadrant | DetID | PixID | Counts | Sigma | Mean | Median | Sigma |
| A | 10 | 83 | 212386 | 1689.84 | 619 | 608 | 125.3 |
| A | 13 | 254 | 9003 | 66.99 | 619 | 608 | 125.3 |
| A | 3 | 137 | 6588 | 47.72 | 619 | 608 | 125.3 |
| B | 5 | 255 | 394379 | 3318.29 | 615 | 599 | 118.7 |
| B | 0 | 189 | 113391 | 950.47 | 615 | 599 | 118.7 |
| B | 0 | 199 | 21411 | 175.38 | 615 | 599 | 118.7 |
| C | 0 | 10 | 496470 | 3523.71 | 597 | 598 | 140.7 |
| C | 15 | 214 | 246564 | 1747.86 | 597 | 598 | 140.7 |
| C | 0 | 207 | 189794 | 1344.44 | 597 | 598 | 140.7 |
| D | 13 | 249 | 379393 | 2593.04 | 599 | 582 | 146.1 |
| D | 7 | 38 | 148517 | 1012.65 | 599 | 582 | 146.1 |
| D | 12 | 233 | 119464 | 813.77 | 599 | 582 | 146.1 |
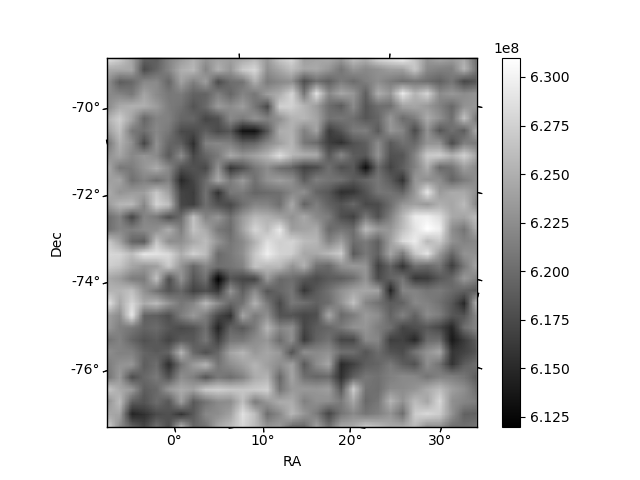
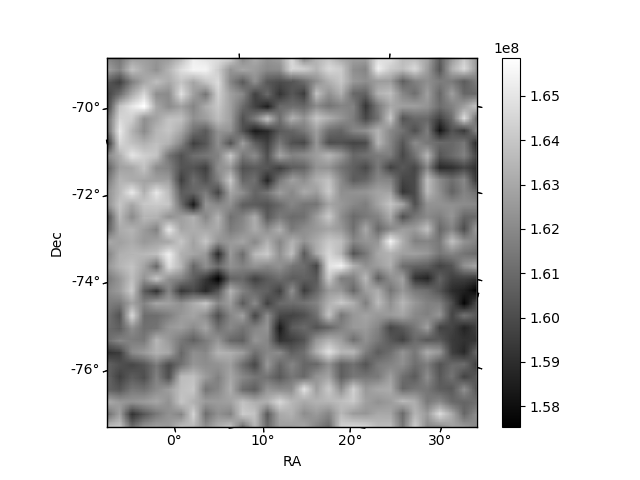
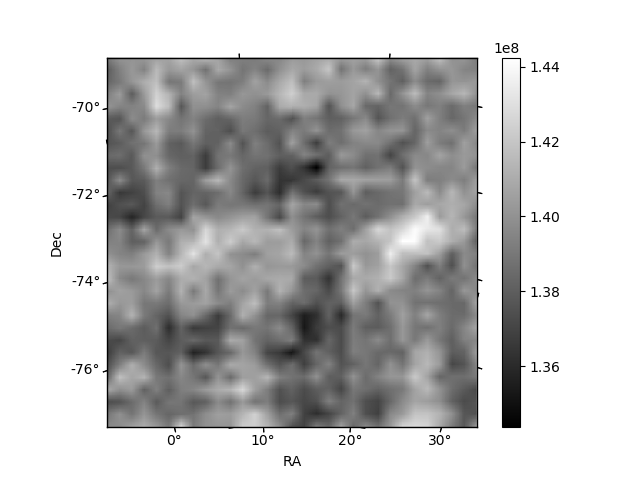
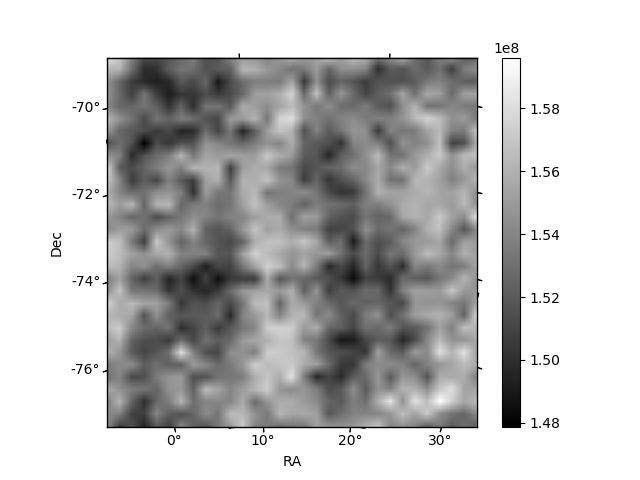
Histogram calculated using DETX and DETY for each event in the final _common_clean file
| Quadrant A | 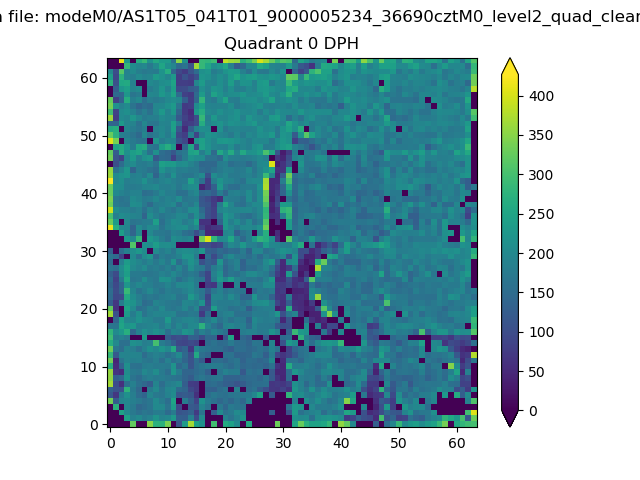 |
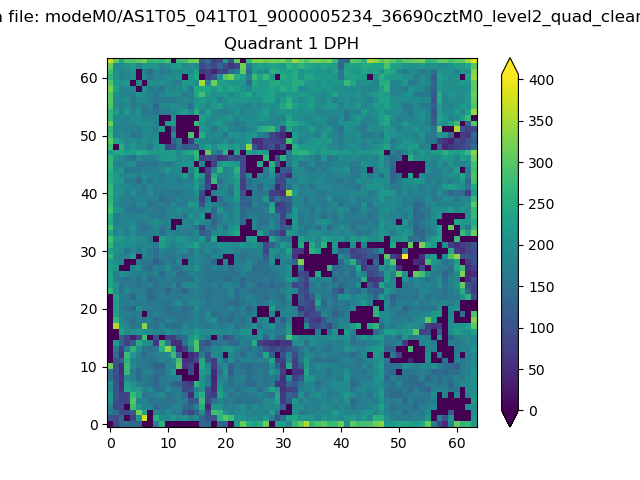 |
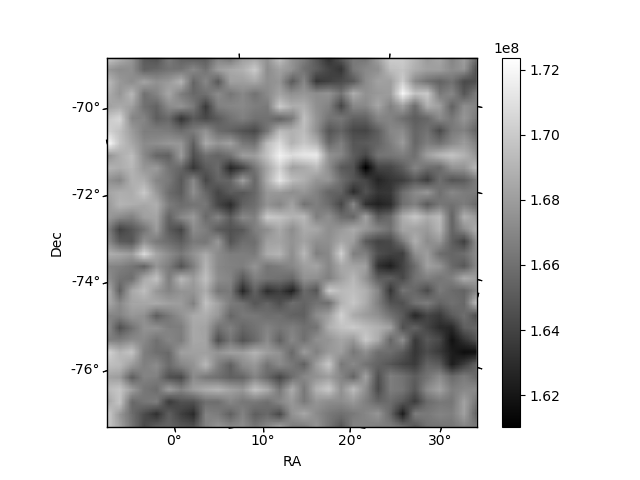
Quadrant B |
|---|---|---|---|
| Quadrant D | 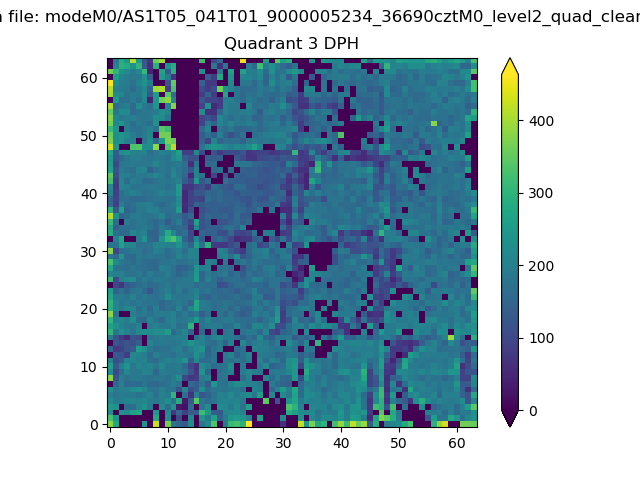 |
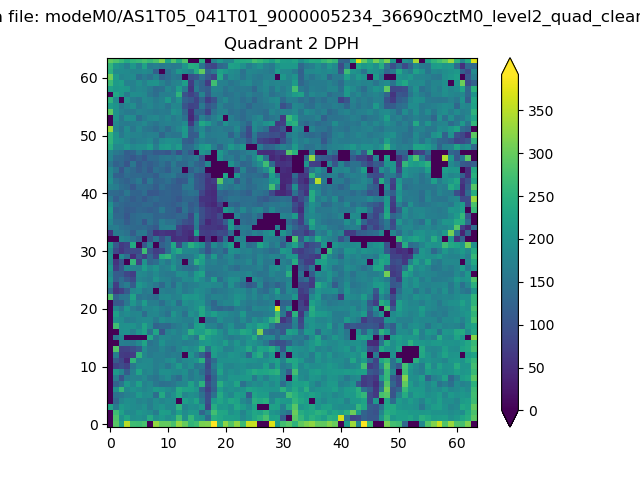 |
Quadrant C |
| Plot type | Count rate plots | Images |
|---|---|---|
| Comparison with Poisson distribution Blue bars denote a histogram of data divided into 1 sec bins. Red curve is a Poisson curve with rate = median count rate of data. |
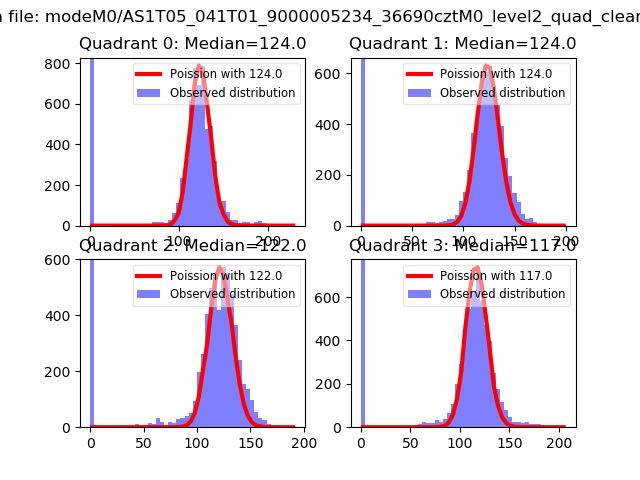 |
 |
| Quadrant-wise count rates Data is divided into 100 sec bins |
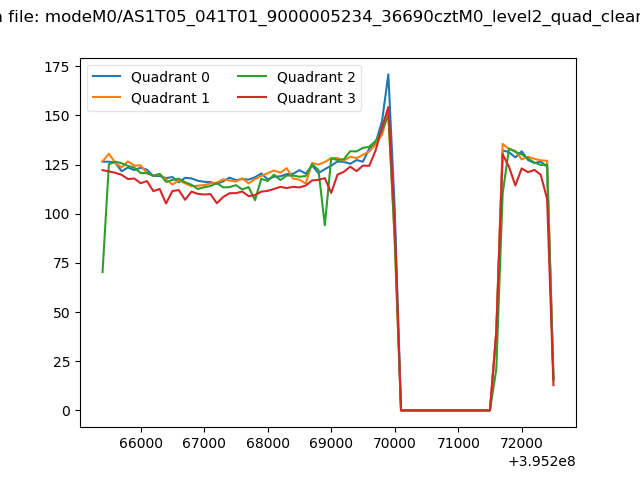 |
|
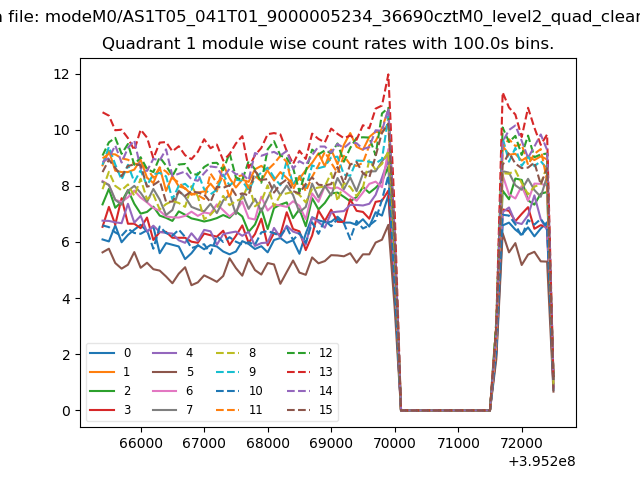
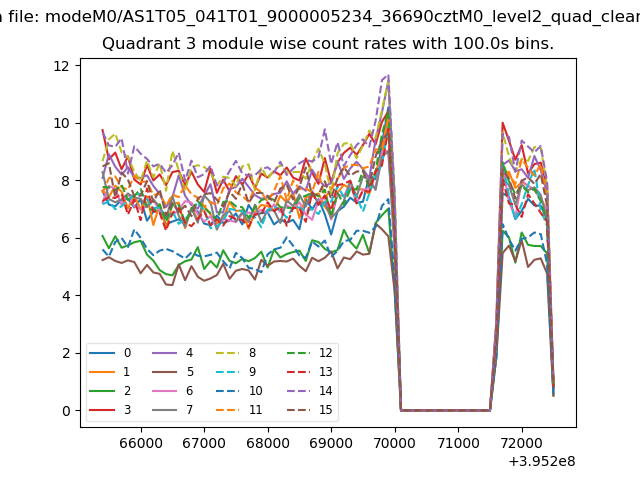
| Module-wise count rates for Quadrant A Data is divided into 100 sec bins |
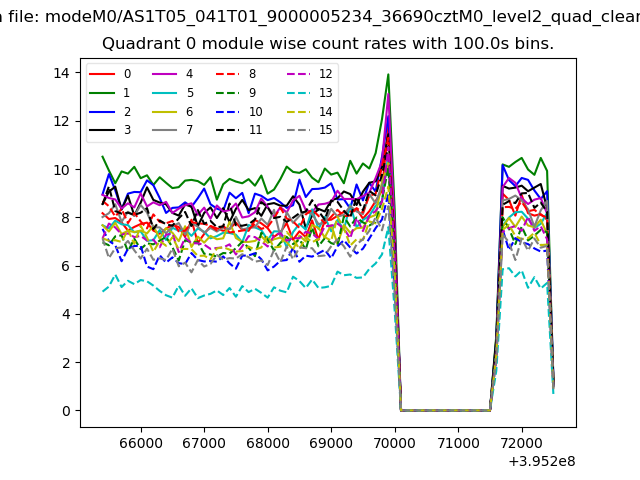 |
 |
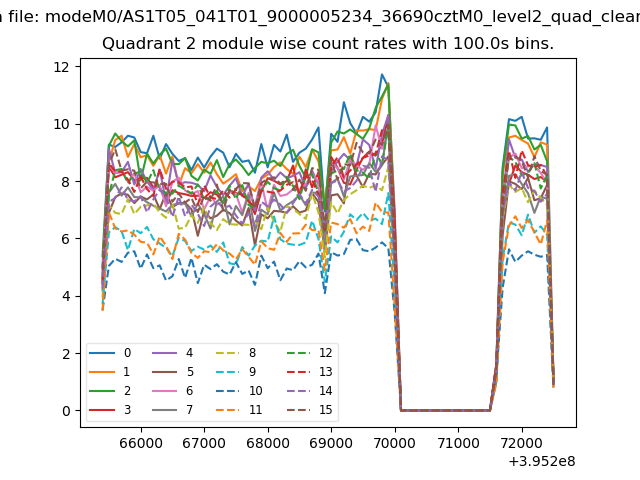
| Module-wise count rates for Quadrant B Data is divided into 100 sec bins |
 |
 |
| Module-wise count rates for Quadrant C Data is divided into 100 sec bins |
 |
 |
| Module-wise count rates for Quadrant D Data is divided into 100 sec bins |
 |
 |
| Parameter | Plot |
|---|---|
| CZT HV Monitor | 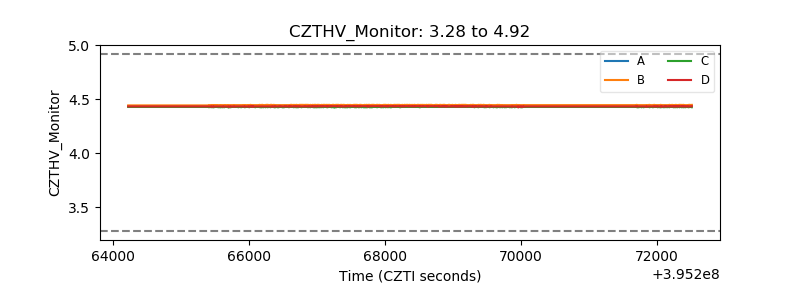 |
| D_VDD | 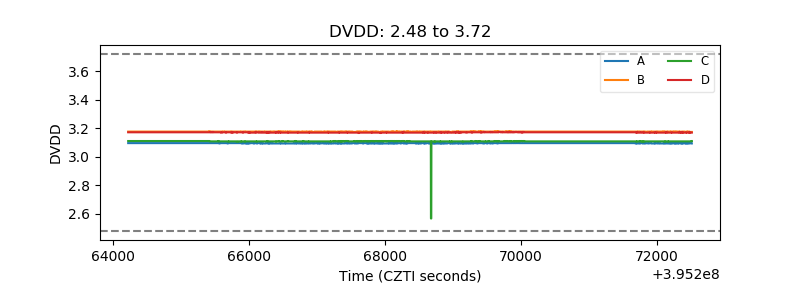 |
| Temperature 1 | 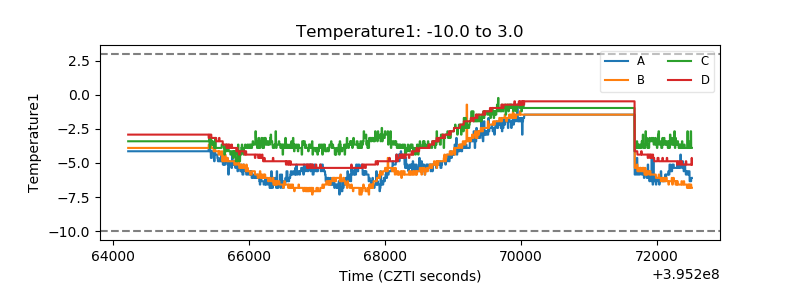 |
| Veto HV Monitor | 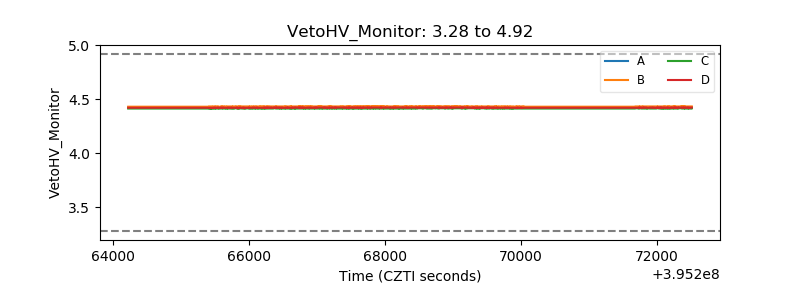 |
| Veto LLD | 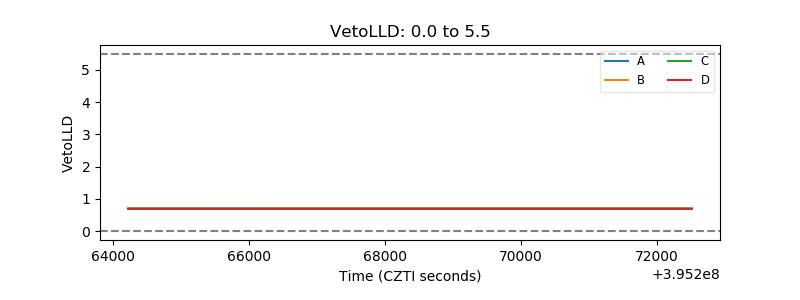 |
| Alpha Counter | 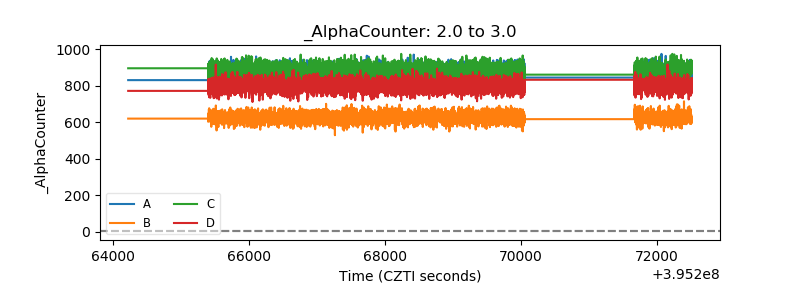 |
| _CPM_Rate | 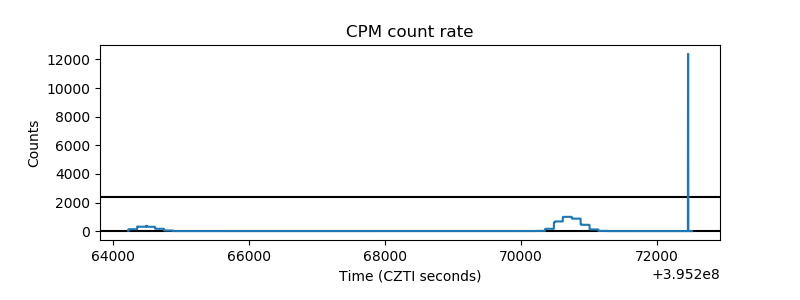 |
| CZT Counter | 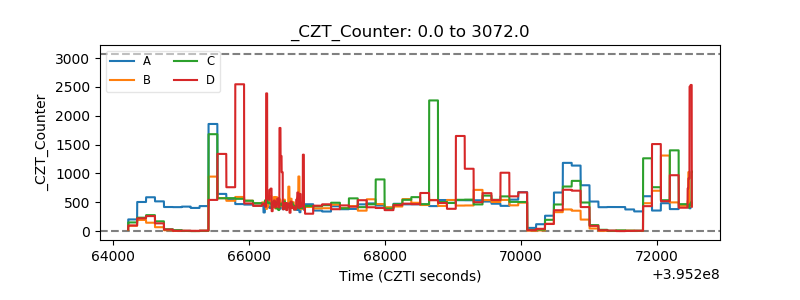 |
| +2.5 Volts monitor | 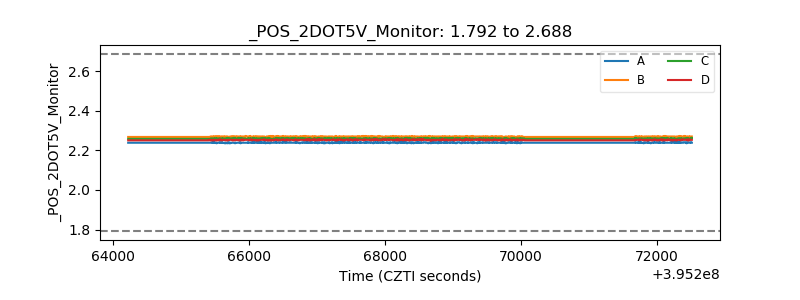 |
| +5 Volts monitor | 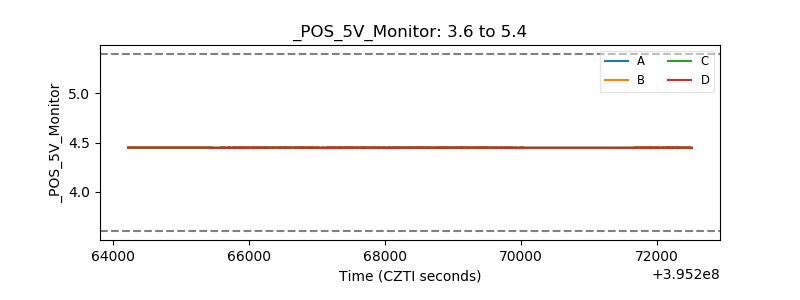 |
| _ROLL_ROT | 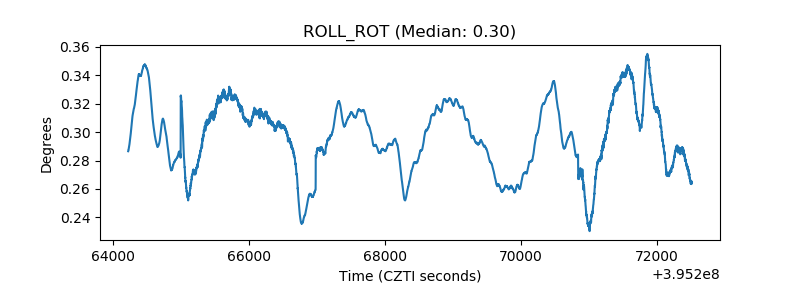 |
| _Roll_DEC | 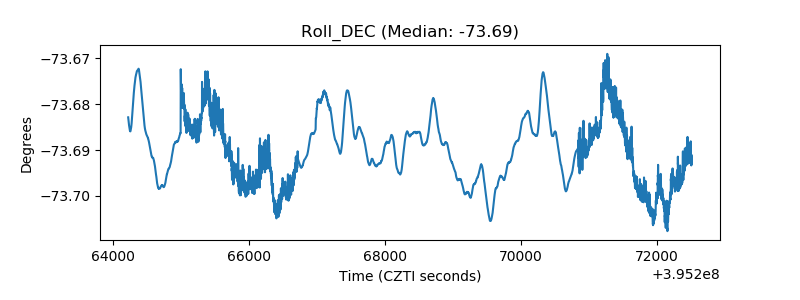 |
| _Roll_RA | 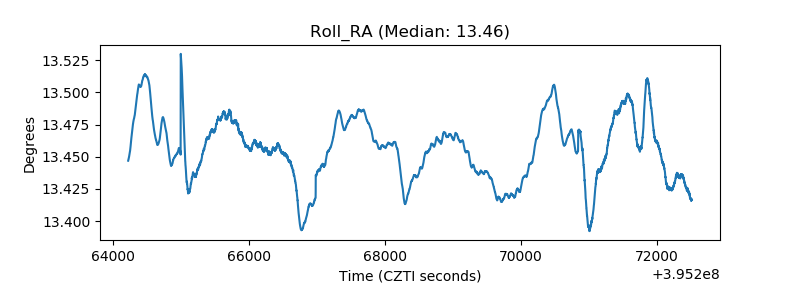 |
| Veto Counter | 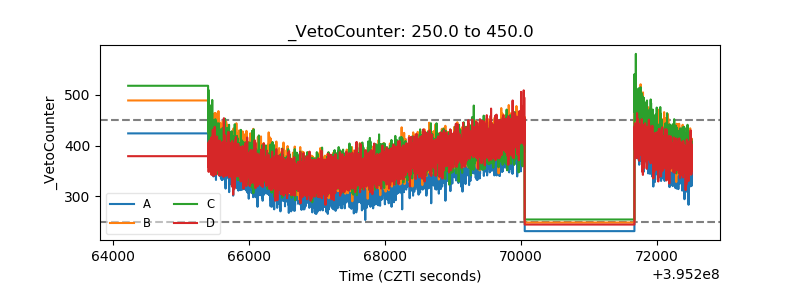 |