| Param | Original file | Final file |
|---|---|---|
| Filename | modeM0/AS1T05_041T01_9000005234_36692cztM0_level2.evt | modeM0/AS1T05_041T01_9000005234_36692cztM0_level2_quad_clean.evt |
| Size (bytes) | 416,442,240 | 106,061,760 |
| Size | 397.2 MB | 101.1 MB |
| Events in quadrant A | 2,731,365 | 714,036 |
| Events in quadrant B | 2,873,443 | 722,515 |
| Events in quadrant C | 3,417,447 | 704,949 |
| Events in quadrant D | 3,206,296 | 676,244 |
| Mode M9 | |||
|---|---|---|---|
| Quadrant | BADHDUFLAG | Total packets | Discarded packets |
| A | 0 | 29 | 0 |
| B | 0 | 29 | 0 |
| C | 0 | 29 | 0 |
| D | 0 | 30 | 0 |
| Mode M0 | |||
|---|---|---|---|
| Quadrant | BADHDUFLAG | Total packets | Discarded packets |
| A | 0 | 11786 | 3 |
| B | 0 | 12180 | 2 |
| C | 0 | 13407 | 2 |
| D | 0 | 13418 | 2 |
| Mode SS | |||
|---|---|---|---|
| Quadrant | BADHDUFLAG | Total packets | Discarded packets |
| A | 0 | 114 | 0 |
| B | 0 | 114 | 0 |
| C | 0 | 114 | 0 |
| D | 0 | 114 | 0 |
| Quadrant | Total seconds | Saturated seconds | Saturation percentage |
|---|---|---|---|
| A | 5643 | 9 | 0.159490% |
| B | 5643 | 40 | 0.708843% |
| C | 5643 | 158 | 2.799929% |
| D | 5643 | 104 | 1.842991% |
Noise dominated data is calculated using 1-second bins in cleaned event files. If a bin has >2000 counts, and if more than 50% of those come from <1% of pixels, then it is considered to be noise-dominated and hence unusable.
| Quadrant | # 1 sec bins | Bins with >0 counts | Bins with >2000 counts | High rate bins dominated by noise | Noise dominated (total time) | Noise dominated (detector-on time) | Marked lightcurve |
|---|---|---|---|---|---|---|---|
| A | 7376 | 5644 | 3 | 3 | 0.04% | 0.05% | 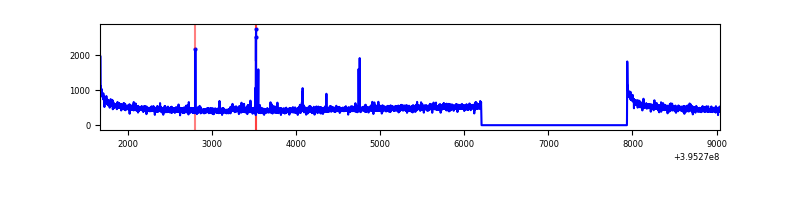 |
| B | 7376 | 5644 | 17 | 17 | 0.23% | 0.30% | 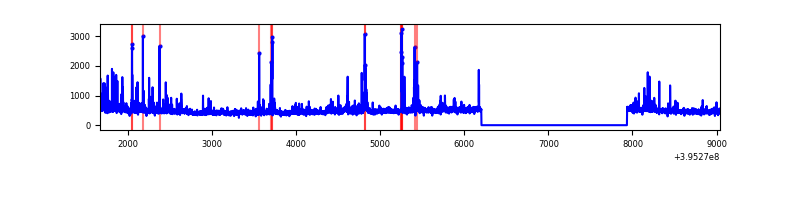 |
| C | 7376 | 5644 | 126 | 126 | 1.71% | 2.23% | 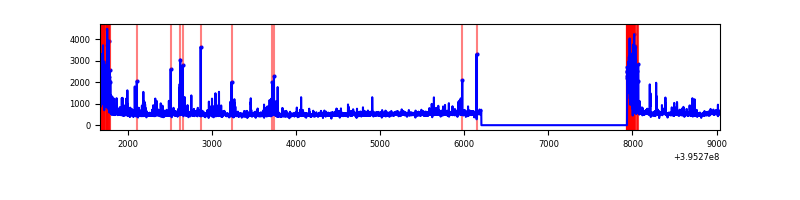 |
| D | 7376 | 5644 | 76 | 76 | 1.03% | 1.35% | 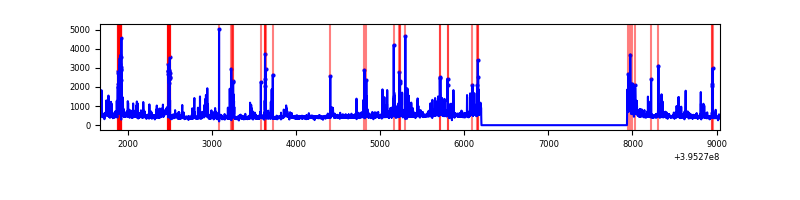 |
Top three noisy pixels from each quadrant. If the there are fewer than three noisy pixels in the level2.evt file, extra rows are filled as -1
| Pixel properties | Quadrant properties | ||||||
|---|---|---|---|---|---|---|---|
| Quadrant | DetID | PixID | Counts | Sigma | Mean | Median | Sigma |
| A | 10 | 83 | 208886 | 1615.65 | 638 | 624 | 128.9 |
| A | 9 | 143 | 32193 | 244.9 | 638 | 624 | 128.9 |
| A | 13 | 6 | 19177 | 143.93 | 638 | 624 | 128.9 |
| B | 5 | 255 | 209562 | 1710.23 | 638 | 619 | 122.2 |
| B | 0 | 189 | 31869 | 255.79 | 638 | 619 | 122.2 |
| B | 0 | 221 | 29695 | 237.99 | 638 | 619 | 122.2 |
| C | 0 | 10 | 601761 | 4168.8 | 624 | 628 | 144.2 |
| C | 15 | 214 | 252423 | 1746.17 | 624 | 628 | 144.2 |
| C | 10 | 49 | 77532 | 533.32 | 624 | 628 | 144.2 |
| D | 13 | 249 | 271104 | 1780.77 | 625 | 607 | 151.9 |
| D | 12 | 233 | 199152 | 1307.08 | 625 | 607 | 151.9 |
| D | 2 | 137 | 96187 | 629.23 | 625 | 607 | 151.9 |
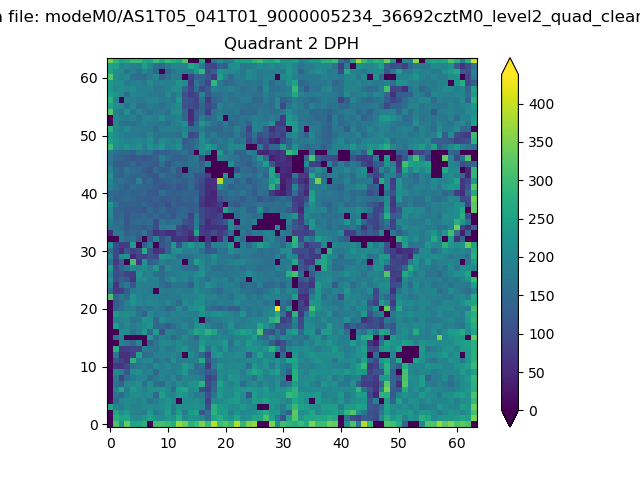
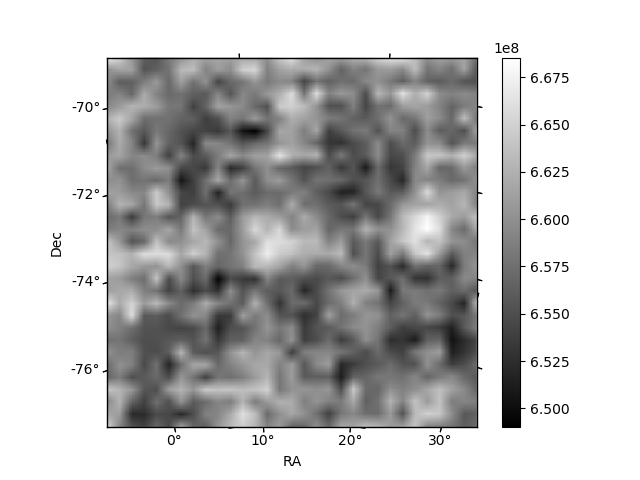
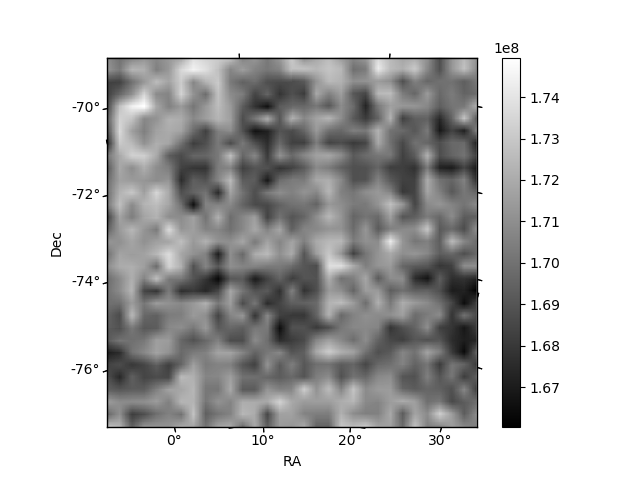
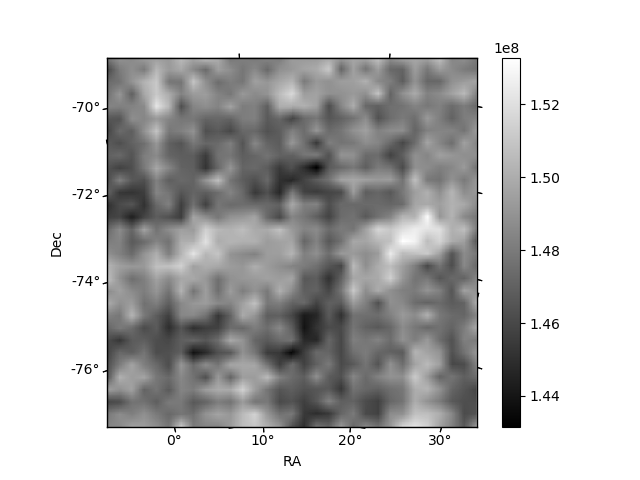
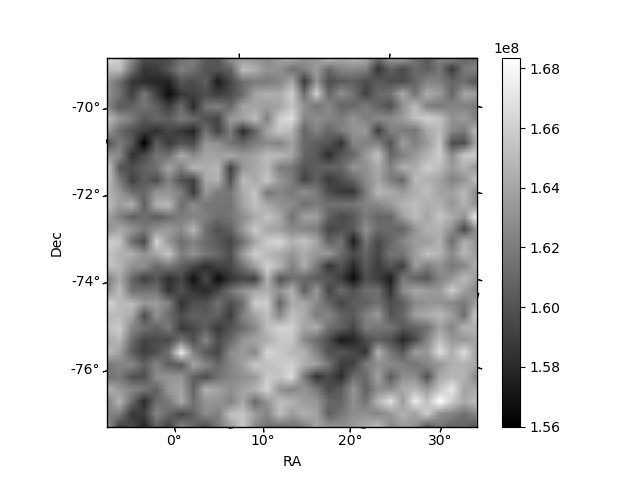
Histogram calculated using DETX and DETY for each event in the final _common_clean file
| Quadrant A | 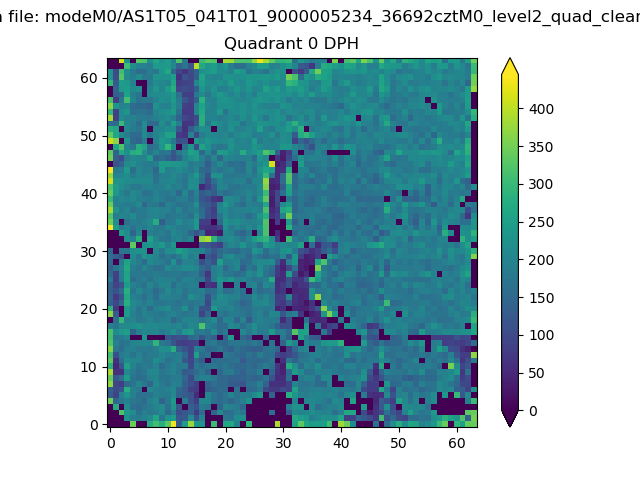 |
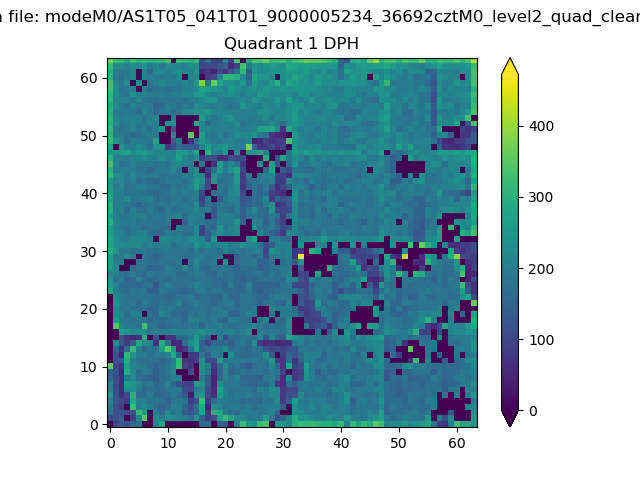 |
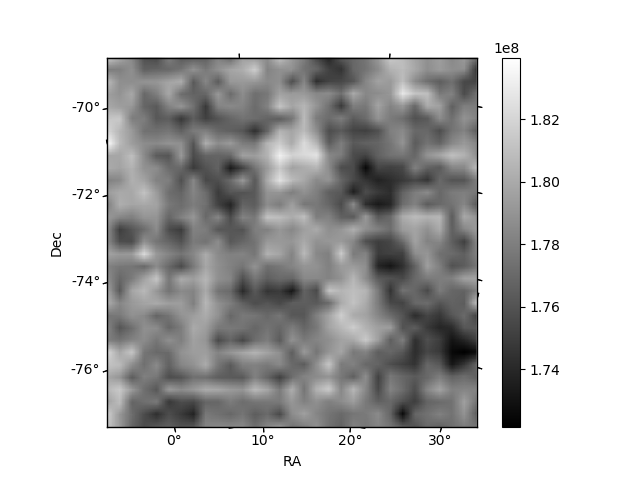
Quadrant B |
|---|---|---|---|
| Quadrant D | 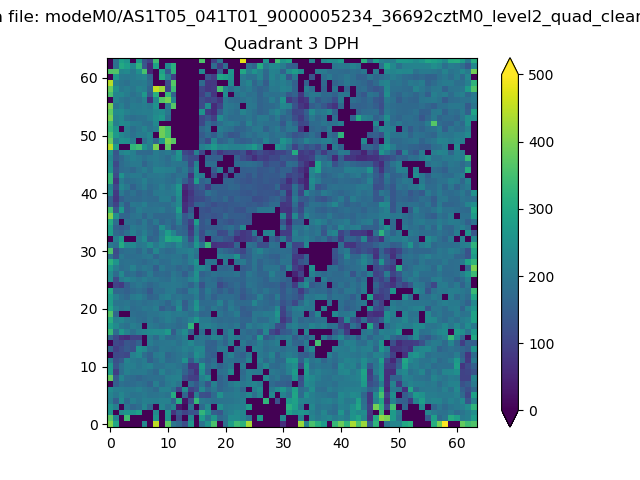 |
 |
Quadrant C |
| Plot type | Count rate plots | Images |
|---|---|---|
| Comparison with Poisson distribution Blue bars denote a histogram of data divided into 1 sec bins. Red curve is a Poisson curve with rate = median count rate of data. |
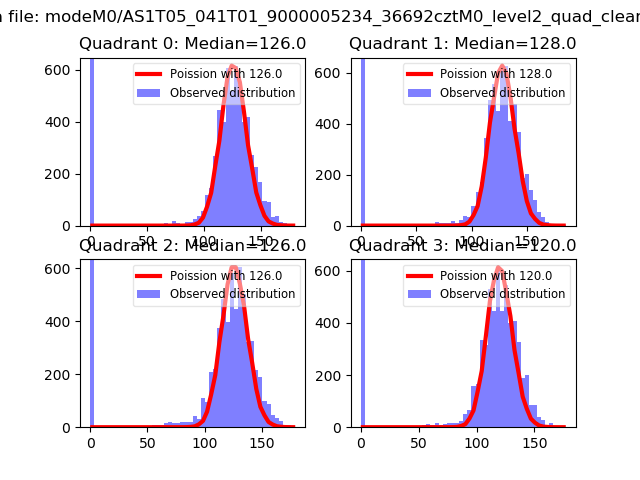 |
 |
| Quadrant-wise count rates Data is divided into 100 sec bins |
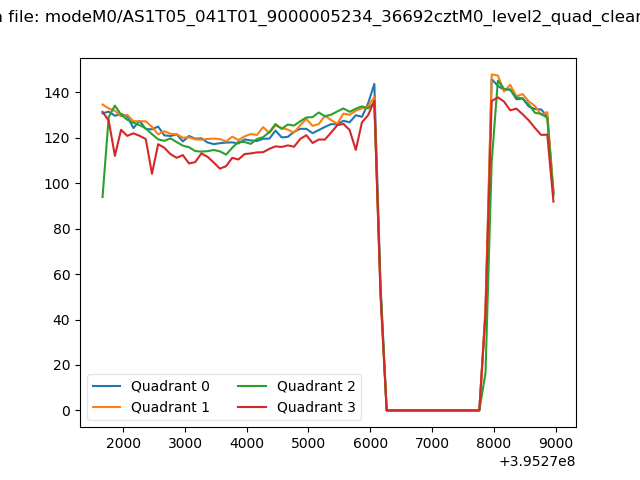 |
|
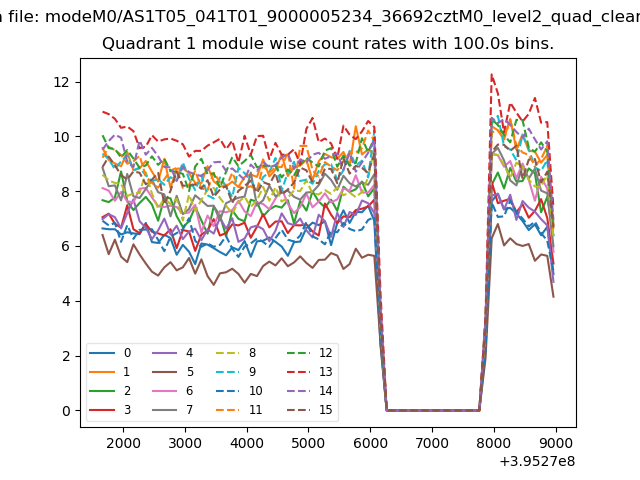
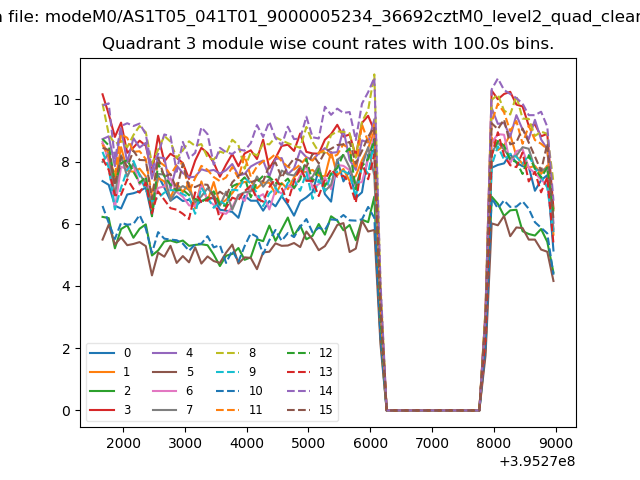
| Module-wise count rates for Quadrant A Data is divided into 100 sec bins |
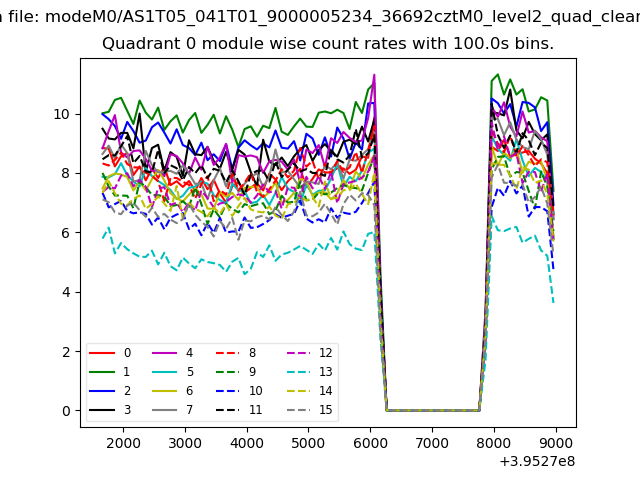 |
 |
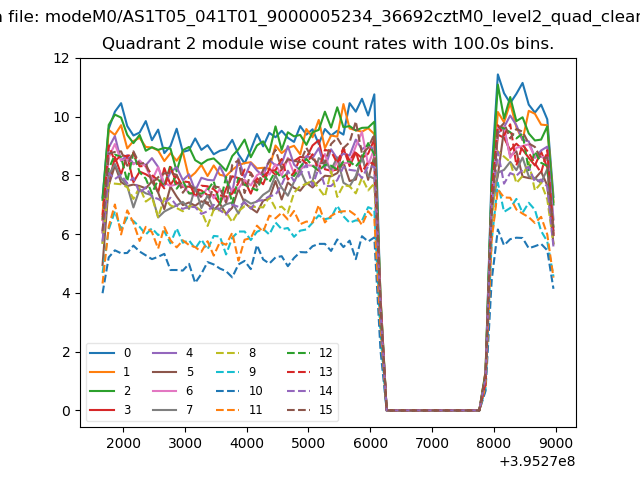
| Module-wise count rates for Quadrant B Data is divided into 100 sec bins |
 |
 |
| Module-wise count rates for Quadrant C Data is divided into 100 sec bins |
 |
 |
| Module-wise count rates for Quadrant D Data is divided into 100 sec bins |
 |
 |
| Parameter | Plot |
|---|---|
| CZT HV Monitor | 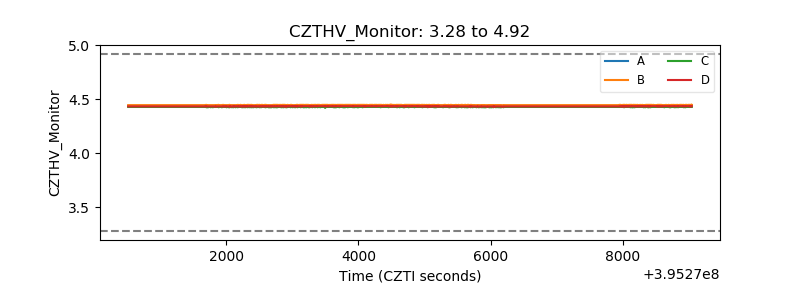 |
| D_VDD | 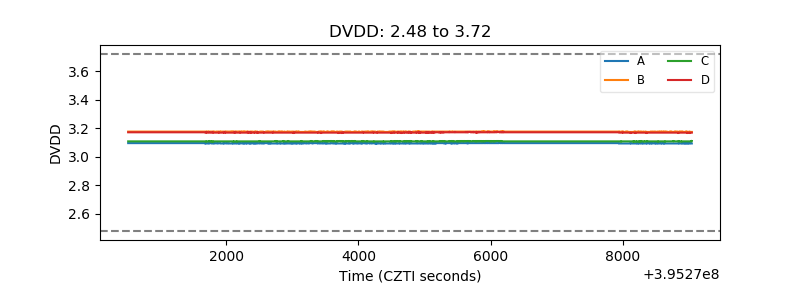 |
| Temperature 1 | 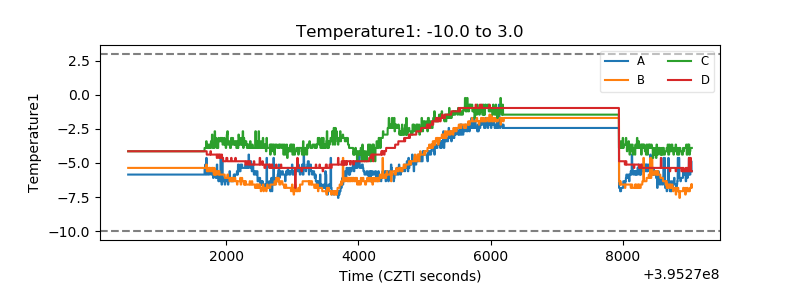 |
| Veto HV Monitor | 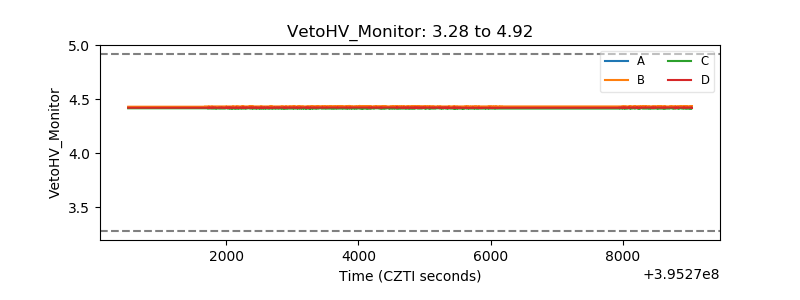 |
| Veto LLD | 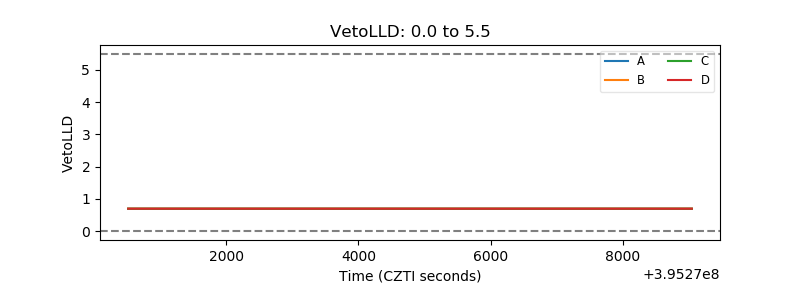 |
| Alpha Counter | 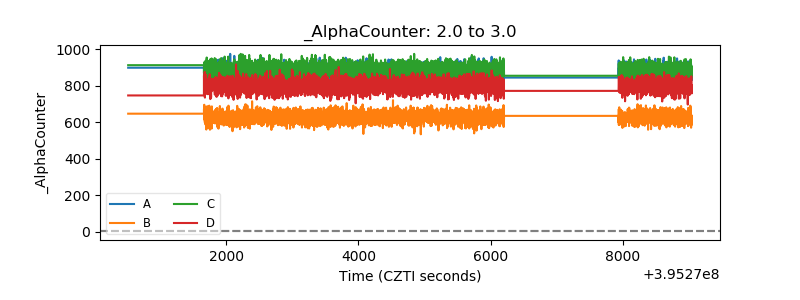 |
| _CPM_Rate | 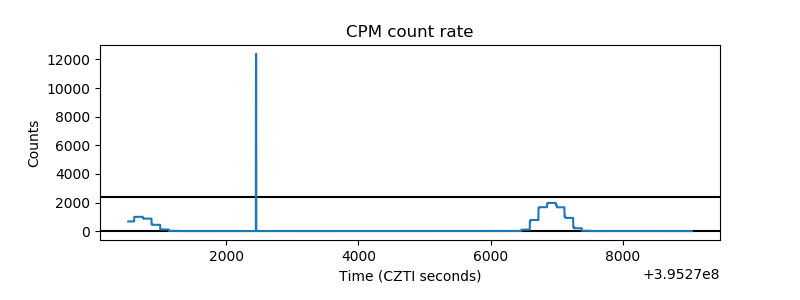 |
| CZT Counter | 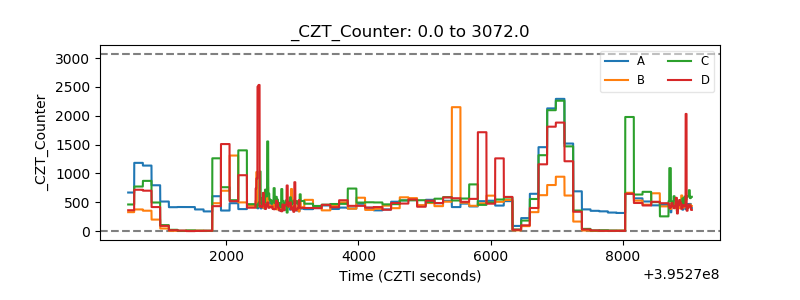 |
| +2.5 Volts monitor | 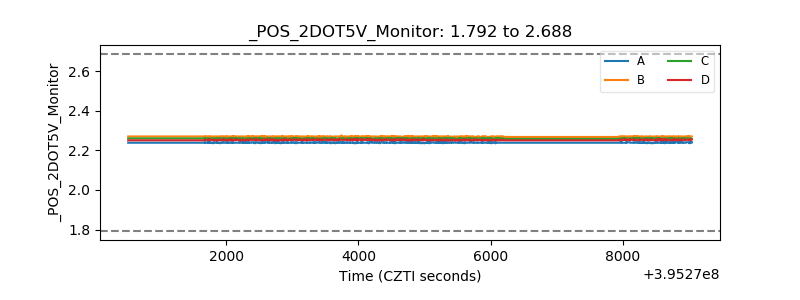 |
| +5 Volts monitor | 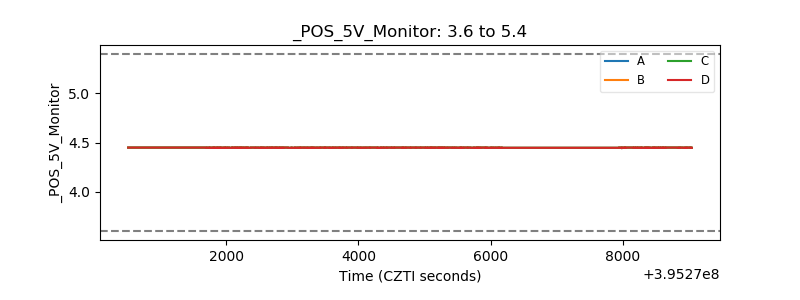 |
| _ROLL_ROT | 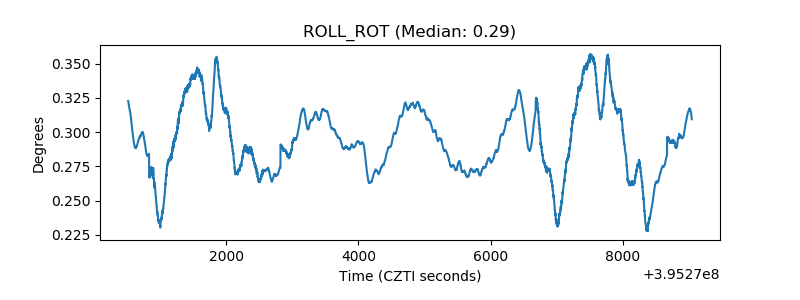 |
| _Roll_DEC | 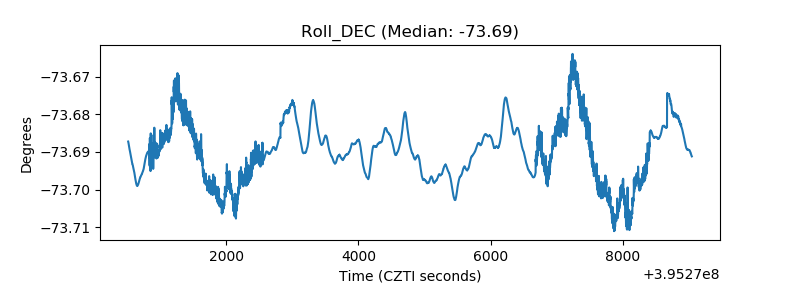 |
| _Roll_RA | 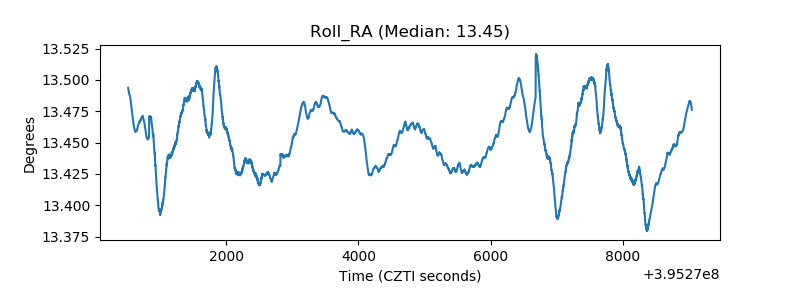 |
| Veto Counter | 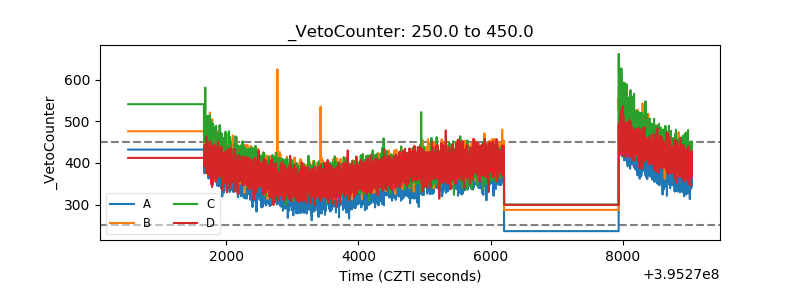 |