| Param | Original file | Final file |
|---|---|---|
| Filename | modeM0/AS1T05_041T01_9000005234_36694cztM0_level2.evt | modeM0/AS1T05_041T01_9000005234_36694cztM0_level2_quad_clean.evt |
| Size (bytes) | 411,324,480 | 110,750,400 |
| Size | 392.3 MB | 105.6 MB |
| Events in quadrant A | 2,744,313 | 742,853 |
| Events in quadrant B | 2,924,653 | 761,747 |
| Events in quadrant C | 3,212,113 | 758,800 |
| Events in quadrant D | 3,214,514 | 718,603 |
| Mode M9 | |||
|---|---|---|---|
| Quadrant | BADHDUFLAG | Total packets | Discarded packets |
| A | 0 | 31 | 0 |
| B | 0 | 31 | 0 |
| C | 0 | 31 | 0 |
| D | 0 | 32 | 0 |
| Mode M0 | |||
|---|---|---|---|
| Quadrant | BADHDUFLAG | Total packets | Discarded packets |
| A | 0 | 11360 | 3 |
| B | 0 | 11948 | 2 |
| C | 0 | 12635 | 2 |
| D | 0 | 12989 | 2 |
| Mode SS | |||
|---|---|---|---|
| Quadrant | BADHDUFLAG | Total packets | Discarded packets |
| A | 0 | 108 | 0 |
| B | 0 | 108 | 0 |
| C | 0 | 108 | 0 |
| D | 0 | 108 | 0 |
| Quadrant | Total seconds | Saturated seconds | Saturation percentage |
|---|---|---|---|
| A | 5321 | 17 | 0.319489% |
| B | 5321 | 66 | 1.240368% |
| C | 5321 | 111 | 2.086074% |
| D | 5321 | 92 | 1.728998% |
Noise dominated data is calculated using 1-second bins in cleaned event files. If a bin has >2000 counts, and if more than 50% of those come from <1% of pixels, then it is considered to be noise-dominated and hence unusable.
| Quadrant | # 1 sec bins | Bins with >0 counts | Bins with >2000 counts | High rate bins dominated by noise | Noise dominated (total time) | Noise dominated (detector-on time) | Marked lightcurve |
|---|---|---|---|---|---|---|---|
| A | 7294 | 5322 | 3 | 3 | 0.04% | 0.06% | 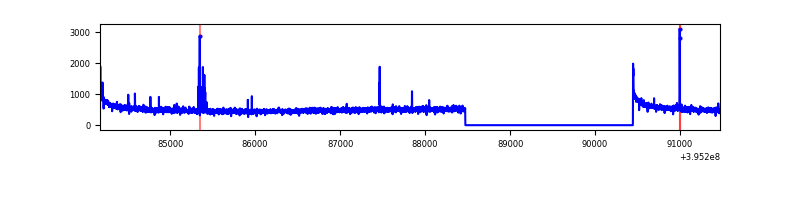 |
| B | 7294 | 5322 | 39 | 39 | 0.53% | 0.73% | 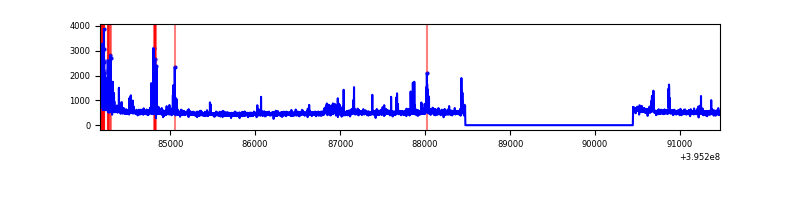 |
| C | 7294 | 5322 | 78 | 78 | 1.07% | 1.47% | 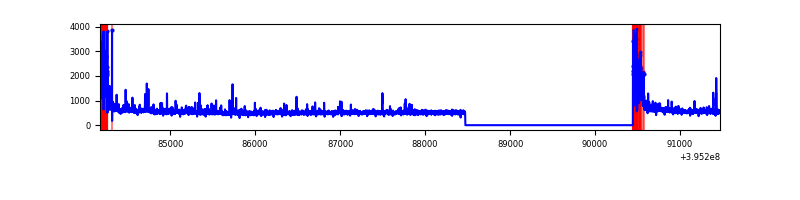 |
| D | 7294 | 5322 | 64 | 64 | 0.88% | 1.20% | 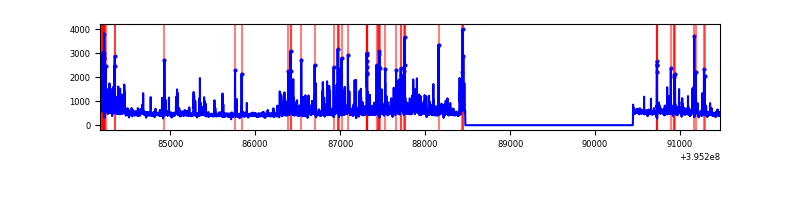 |
Top three noisy pixels from each quadrant. If the there are fewer than three noisy pixels in the level2.evt file, extra rows are filled as -1
| Pixel properties | Quadrant properties | ||||||
|---|---|---|---|---|---|---|---|
| Quadrant | DetID | PixID | Counts | Sigma | Mean | Median | Sigma |
| A | 10 | 83 | 207369 | 1612.72 | 641 | 630 | 128.2 |
| A | 9 | 143 | 51285 | 395.15 | 641 | 630 | 128.2 |
| A | 13 | 254 | 8829 | 63.96 | 641 | 630 | 128.2 |
| B | 5 | 255 | 193947 | 1595.74 | 640 | 622 | 121.2 |
| B | 4 | 171 | 60107 | 491.0 | 640 | 622 | 121.2 |
| B | 15 | 35 | 37001 | 300.27 | 640 | 622 | 121.2 |
| C | 0 | 10 | 371239 | 2553.08 | 641 | 649 | 145.2 |
| C | 15 | 214 | 240740 | 1654.04 | 641 | 649 | 145.2 |
| C | 0 | 207 | 87859 | 600.81 | 641 | 649 | 145.2 |
| D | 13 | 249 | 218239 | 1418.37 | 636 | 621 | 153.4 |
| D | 12 | 233 | 149798 | 972.29 | 636 | 621 | 153.4 |
| D | 13 | 171 | 129890 | 842.54 | 636 | 621 | 153.4 |
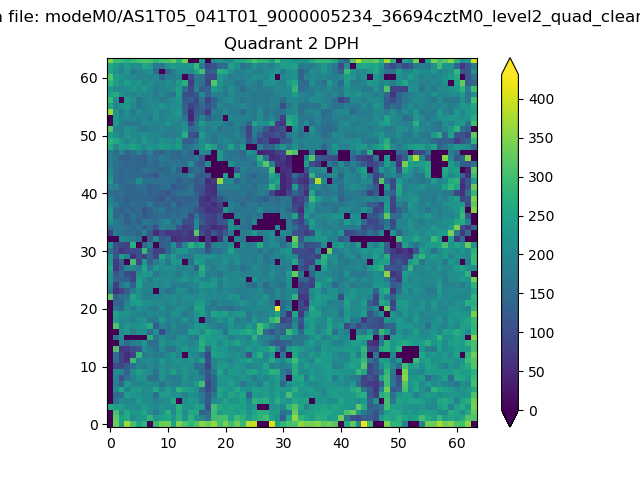
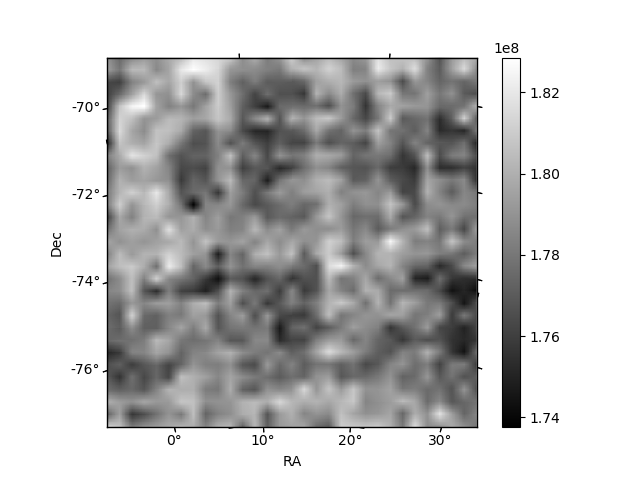
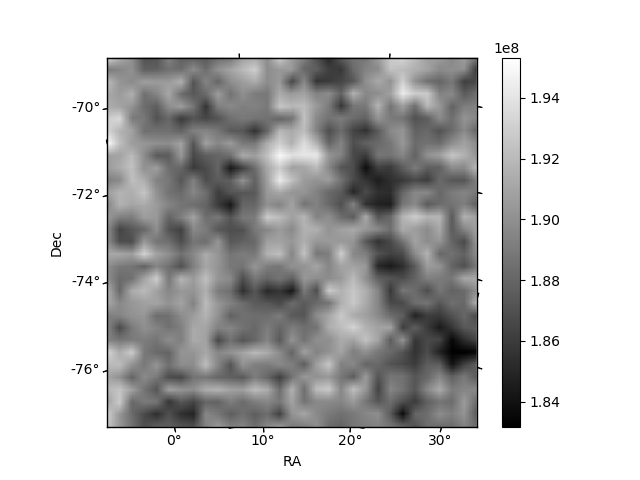
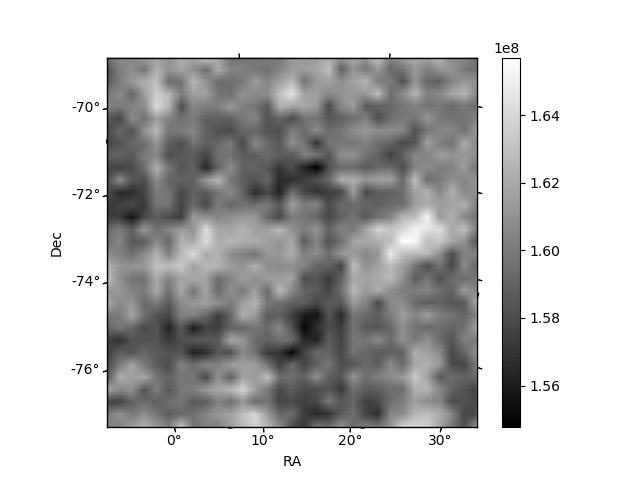
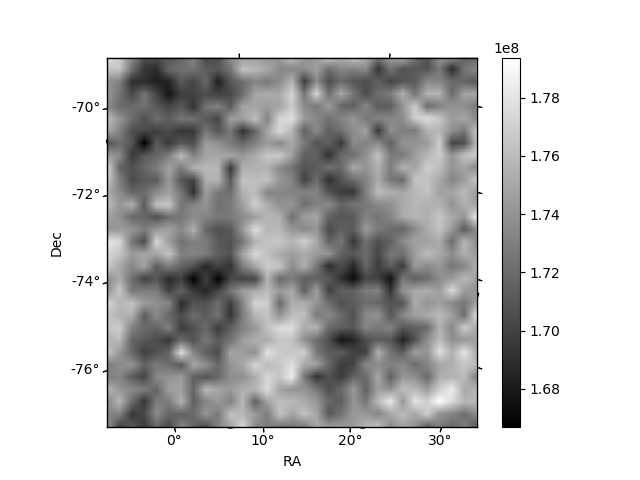
Histogram calculated using DETX and DETY for each event in the final _common_clean file
| Quadrant A | 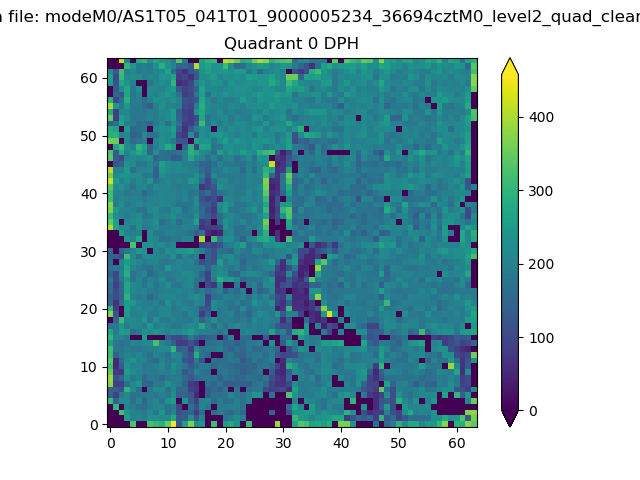 |
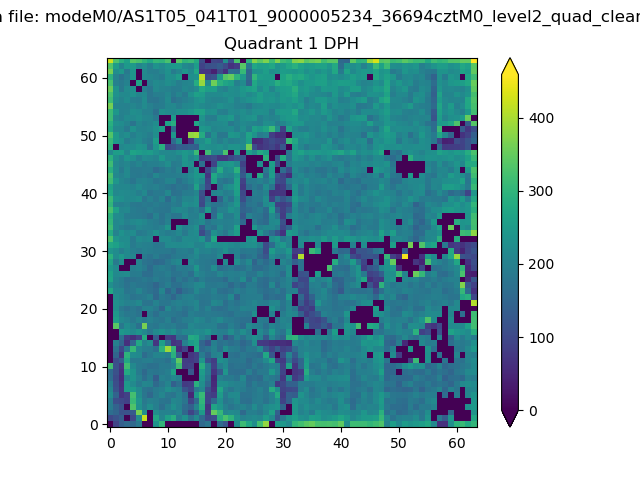 |
Quadrant B |
|---|---|---|---|
| Quadrant D | 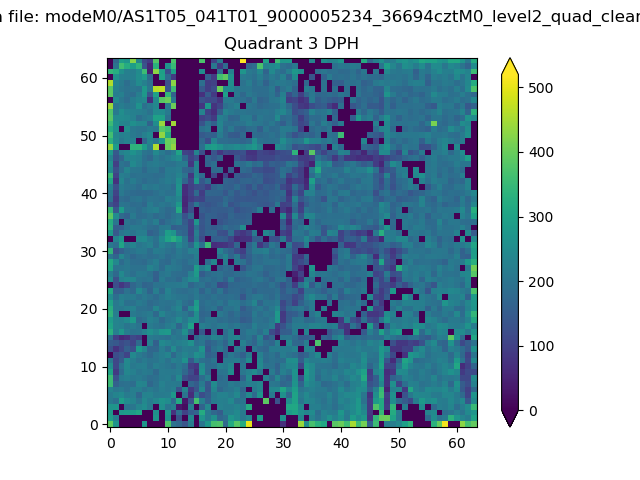 |
 |
Quadrant C |
| Plot type | Count rate plots | Images |
|---|---|---|
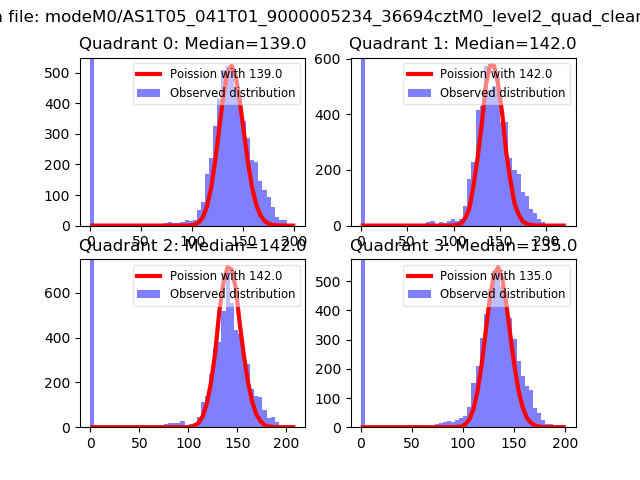
| Comparison with Poisson distribution Blue bars denote a histogram of data divided into 1 sec bins. Red curve is a Poisson curve with rate = median count rate of data. |
 |
 |
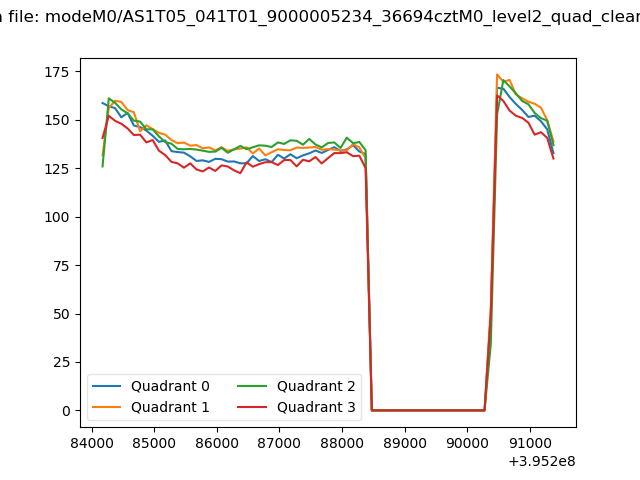
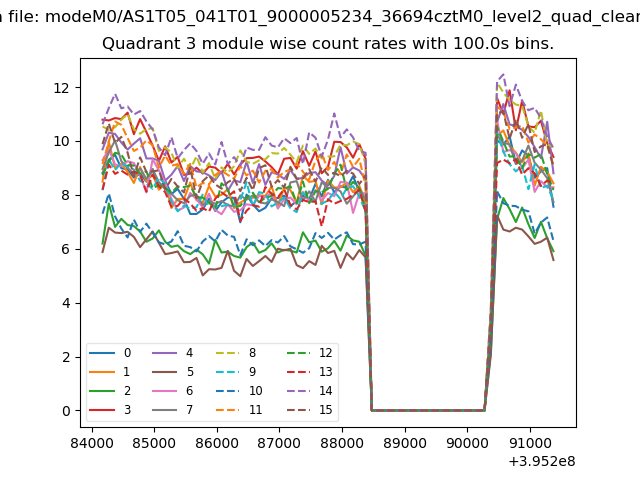
| Quadrant-wise count rates Data is divided into 100 sec bins |
 |
|
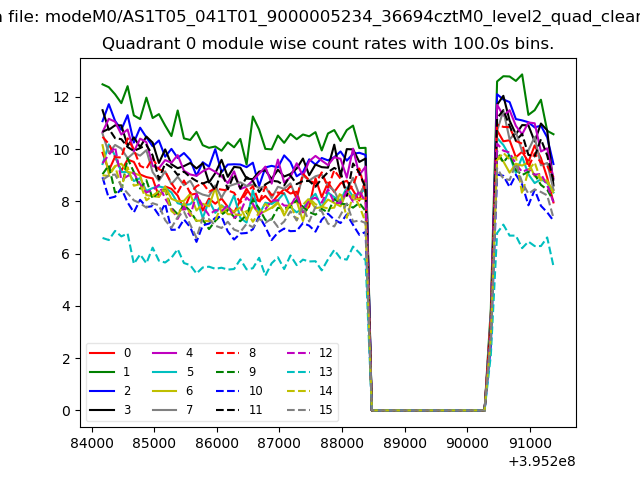
| Module-wise count rates for Quadrant A Data is divided into 100 sec bins |
 |
 |
| Module-wise count rates for Quadrant B Data is divided into 100 sec bins |
 |
 |
| Module-wise count rates for Quadrant C Data is divided into 100 sec bins |
 |
 |
| Module-wise count rates for Quadrant D Data is divided into 100 sec bins |
 |
 |
| Parameter | Plot |
|---|---|
| CZT HV Monitor |  |
| D_VDD | 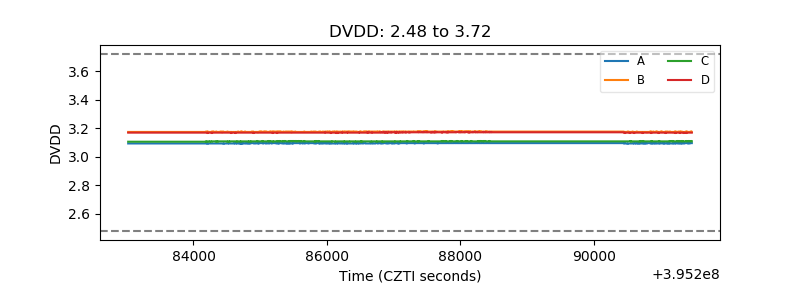 |
| Temperature 1 | 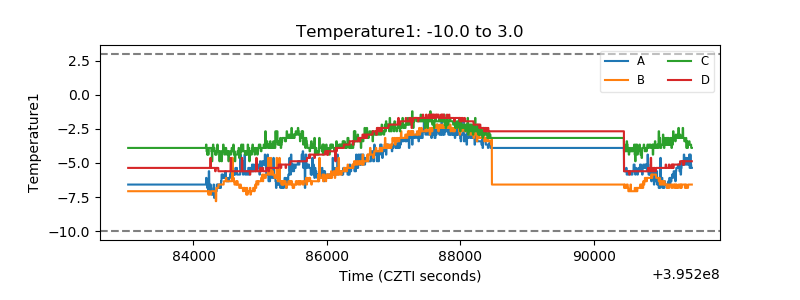 |
| Veto HV Monitor |  |
| Veto LLD | 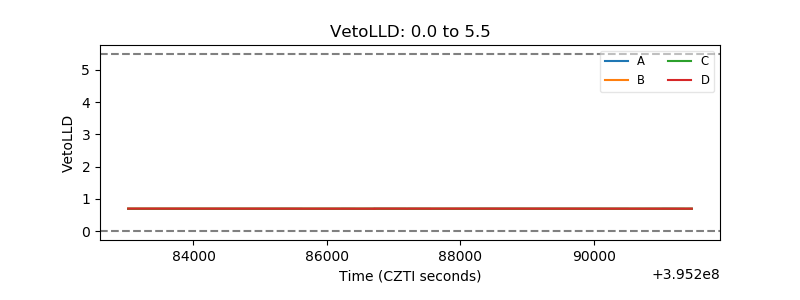 |
| Alpha Counter | 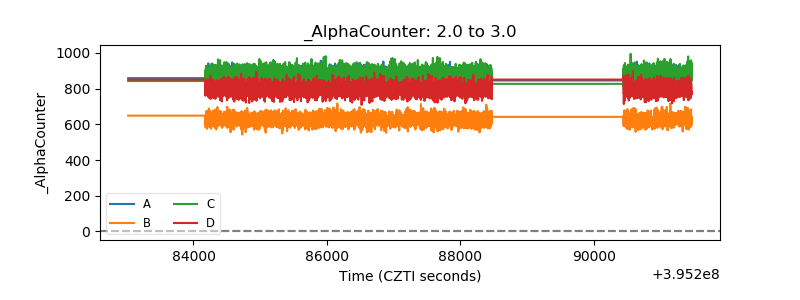 |
| _CPM_Rate | 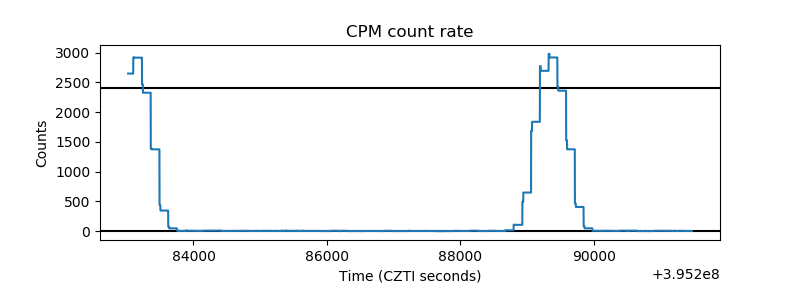 |
| CZT Counter | 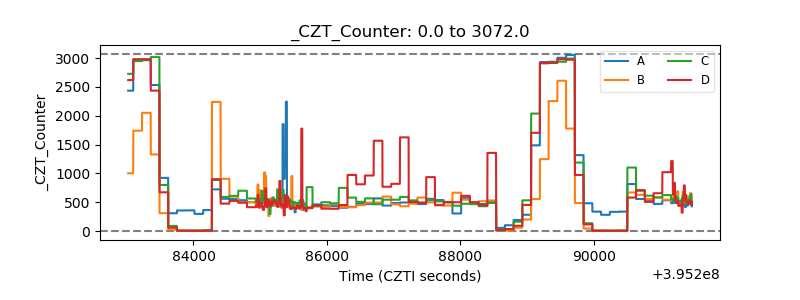 |
| +2.5 Volts monitor | 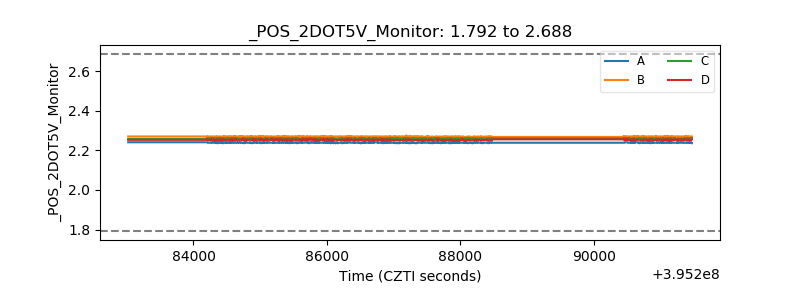 |
| +5 Volts monitor |  |
| _ROLL_ROT |  |
| _Roll_DEC | 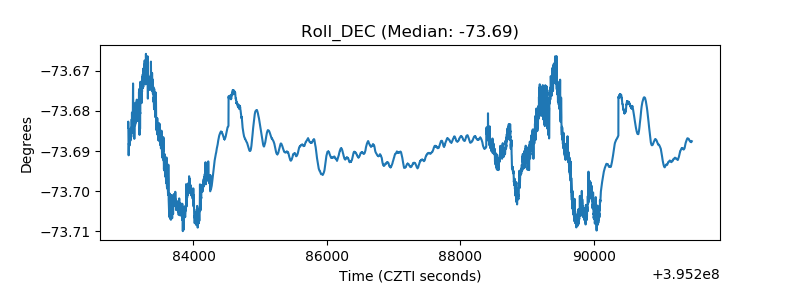 |
| _Roll_RA | 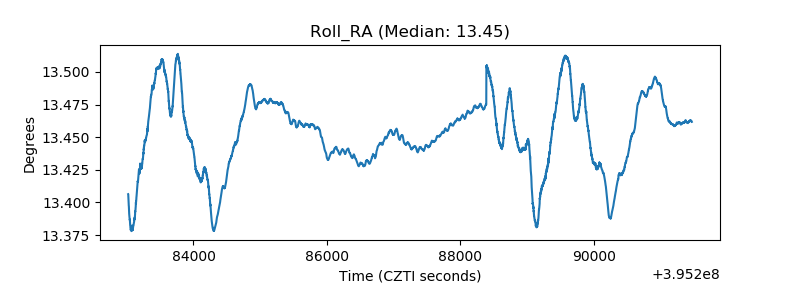 |
| Veto Counter |  |