| Param | Original file | Final file |
|---|---|---|
| Filename | modeM0/AS1T05_041T01_9000005234_36695cztM0_level2.evt | modeM0/AS1T05_041T01_9000005234_36695cztM0_level2_quad_clean.evt |
| Size (bytes) | 153,717,120 | 43,701,120 |
| Size | 146.6 MB | 41.7 MB |
| Events in quadrant A | 1,043,939 | 291,623 |
| Events in quadrant B | 1,052,898 | 304,201 |
| Events in quadrant C | 1,257,998 | 298,991 |
| Events in quadrant D | 1,162,780 | 283,557 |
| Mode M9 | |||
|---|---|---|---|
| Quadrant | BADHDUFLAG | Total packets | Discarded packets |
| A | 0 | 12 | 0 |
| B | 0 | 12 | 0 |
| C | 0 | 12 | 0 |
| D | 0 | 13 | 0 |
| Mode M0 | |||
|---|---|---|---|
| Quadrant | BADHDUFLAG | Total packets | Discarded packets |
| A | 0 | 4330 | 1 |
| B | 0 | 4314 | 1 |
| C | 0 | 4910 | 1 |
| D | 0 | 4706 | 1 |
| Mode SS | |||
|---|---|---|---|
| Quadrant | BADHDUFLAG | Total packets | Discarded packets |
| A | 0 | 40 | 0 |
| B | 0 | 40 | 0 |
| C | 0 | 40 | 0 |
| D | 0 | 40 | 0 |
| Quadrant | Total seconds | Saturated seconds | Saturation percentage |
|---|---|---|---|
| A | 1990 | 7 | 0.351759% |
| B | 1990 | 3 | 0.150754% |
| C | 1990 | 57 | 2.864322% |
| D | 1990 | 21 | 1.055276% |
Noise dominated data is calculated using 1-second bins in cleaned event files. If a bin has >2000 counts, and if more than 50% of those come from <1% of pixels, then it is considered to be noise-dominated and hence unusable.
| Quadrant | # 1 sec bins | Bins with >0 counts | Bins with >2000 counts | High rate bins dominated by noise | Noise dominated (total time) | Noise dominated (detector-on time) | Marked lightcurve |
|---|---|---|---|---|---|---|---|
| A | 1990 | 1990 | 4 | 4 | 0.20% | 0.20% | 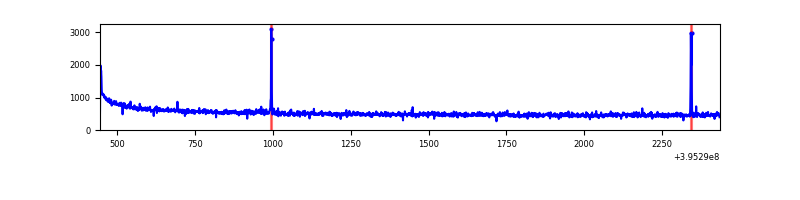 |
| B | 1990 | 1990 | 0 | 0 | 0.00% | 0.00% | 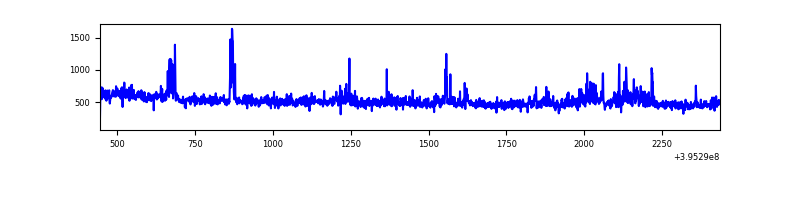 |
| C | 1990 | 1990 | 39 | 39 | 1.96% | 1.96% | 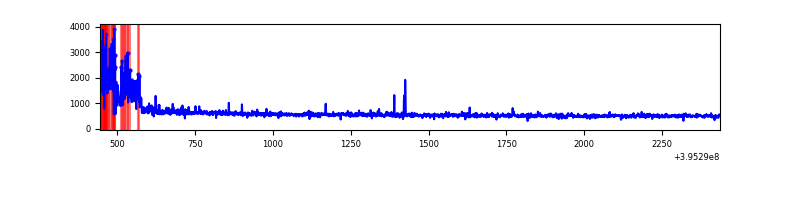 |
| D | 1990 | 1990 | 22 | 22 | 1.11% | 1.11% | 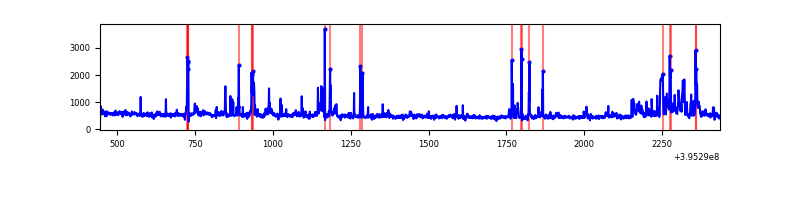 |
Top three noisy pixels from each quadrant. If the there are fewer than three noisy pixels in the level2.evt file, extra rows are filled as -1
| Pixel properties | Quadrant properties | ||||||
|---|---|---|---|---|---|---|---|
| Quadrant | DetID | PixID | Counts | Sigma | Mean | Median | Sigma |
| A | 10 | 83 | 90350 | 1826.97 | 240 | 236 | 49.3 |
| A | 9 | 143 | 17755 | 355.18 | 240 | 236 | 49.3 |
| A | 13 | 6 | 5599 | 108.73 | 240 | 236 | 49.3 |
| B | 4 | 232 | 35825 | 754.59 | 243 | 237 | 47.2 |
| B | 0 | 221 | 20523 | 430.13 | 243 | 237 | 47.2 |
| B | 5 | 255 | 16016 | 334.57 | 243 | 237 | 47.2 |
| C | 0 | 10 | 200532 | 3467.16 | 247 | 249 | 57.8 |
| C | 15 | 214 | 91509 | 1579.83 | 247 | 249 | 57.8 |
| C | 14 | 254 | 2210 | 33.95 | 247 | 249 | 57.8 |
| D | 13 | 249 | 102581 | 1753.47 | 242 | 237 | 58.4 |
| D | 12 | 233 | 57006 | 972.63 | 242 | 237 | 58.4 |
| D | 2 | 250 | 44448 | 757.47 | 242 | 237 | 58.4 |
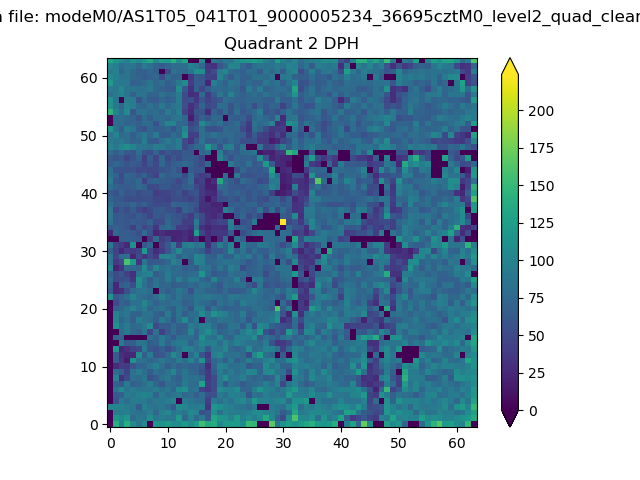
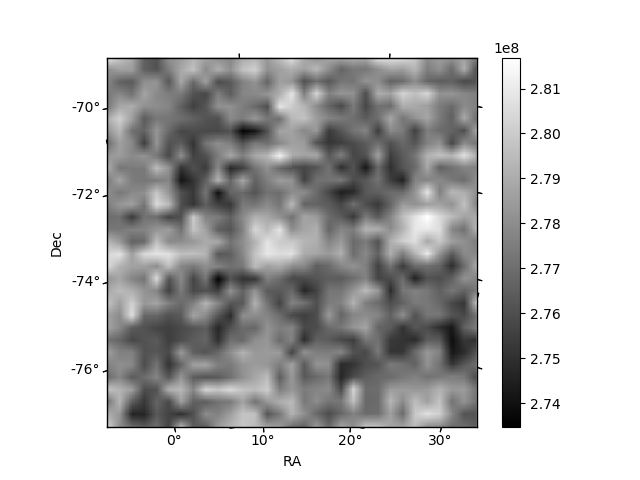
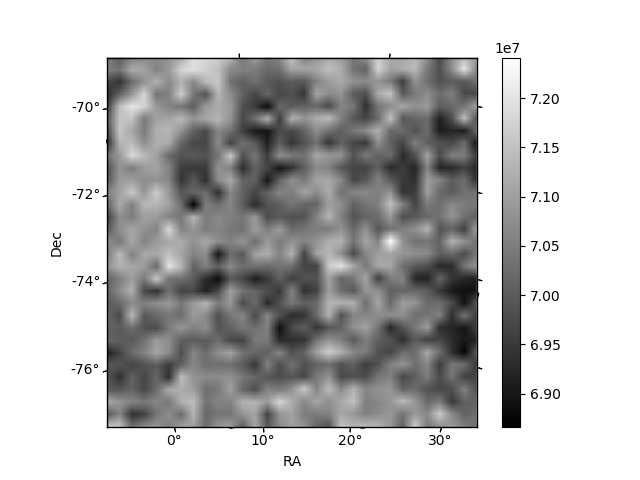
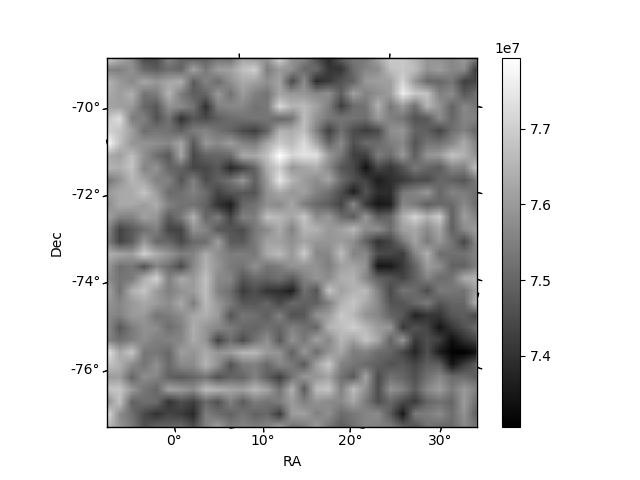
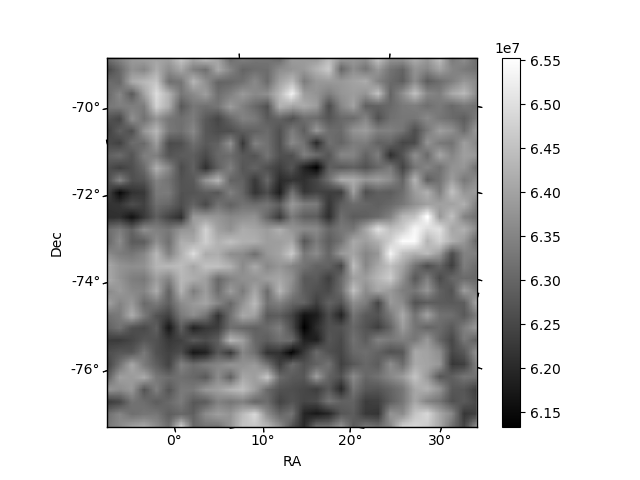
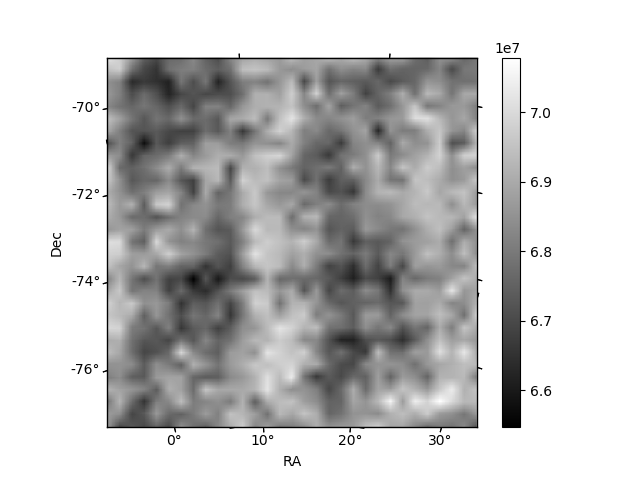
Histogram calculated using DETX and DETY for each event in the final _common_clean file
| Quadrant A | 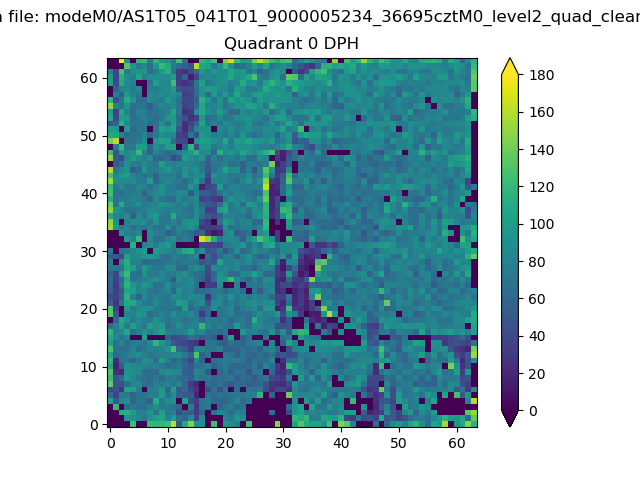 |
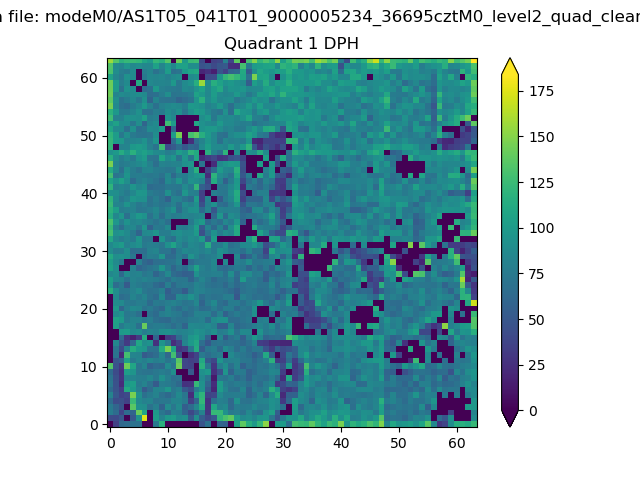 |
Quadrant B |
|---|---|---|---|
| Quadrant D | 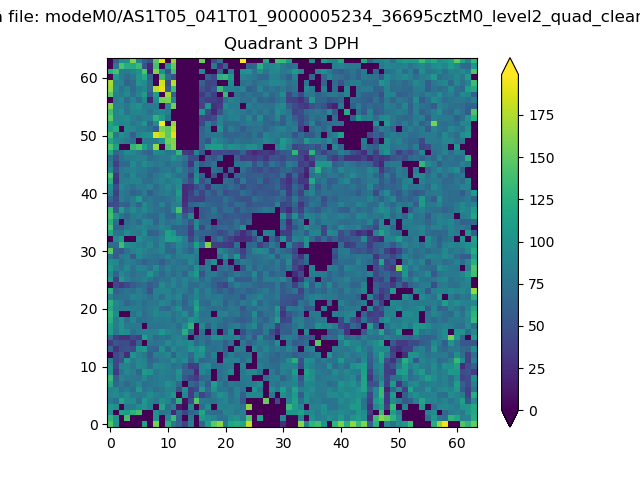 |
 |
Quadrant C |
| Plot type | Count rate plots | Images |
|---|---|---|
| Comparison with Poisson distribution Blue bars denote a histogram of data divided into 1 sec bins. Red curve is a Poisson curve with rate = median count rate of data. |
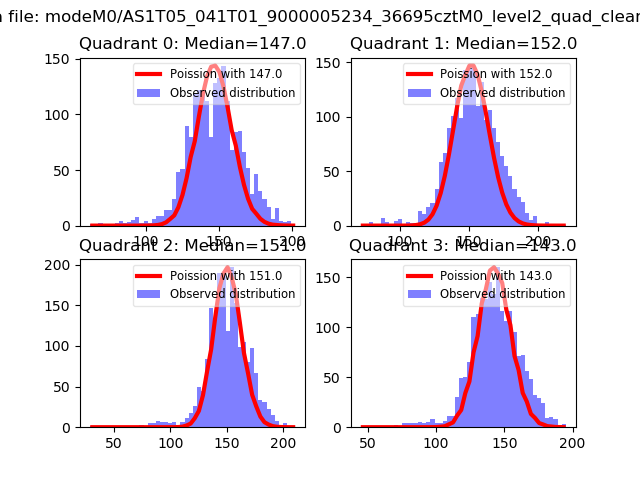 |
 |
| Quadrant-wise count rates Data is divided into 100 sec bins |
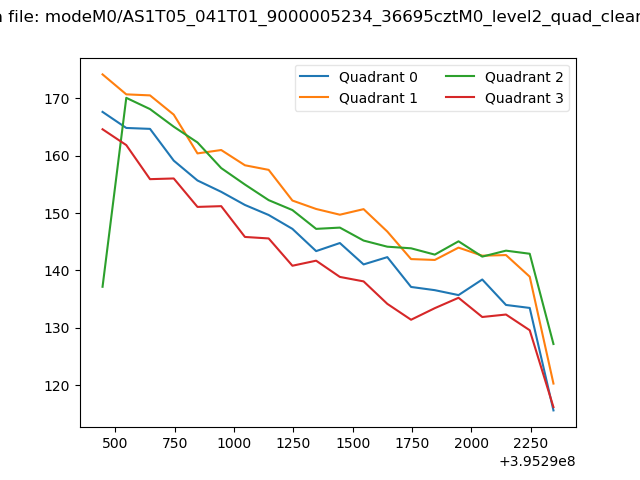 |
|
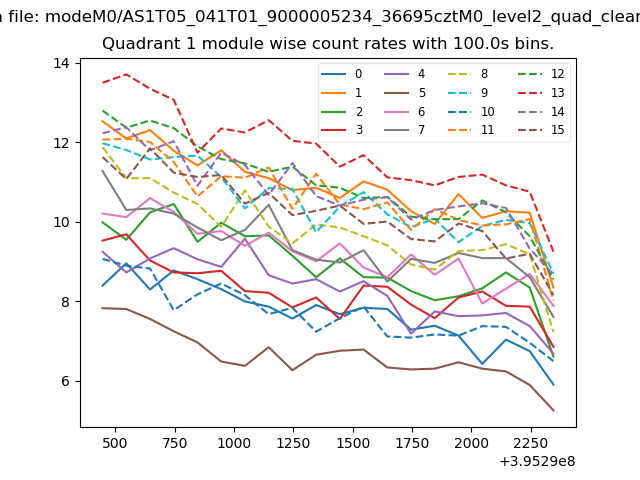
| Module-wise count rates for Quadrant A Data is divided into 100 sec bins |
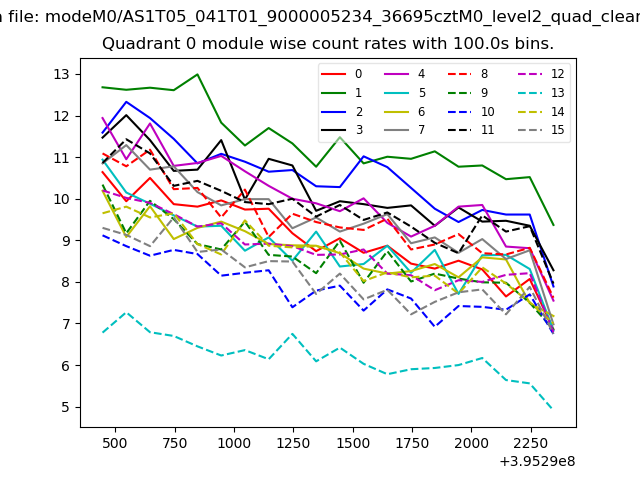 |
 |
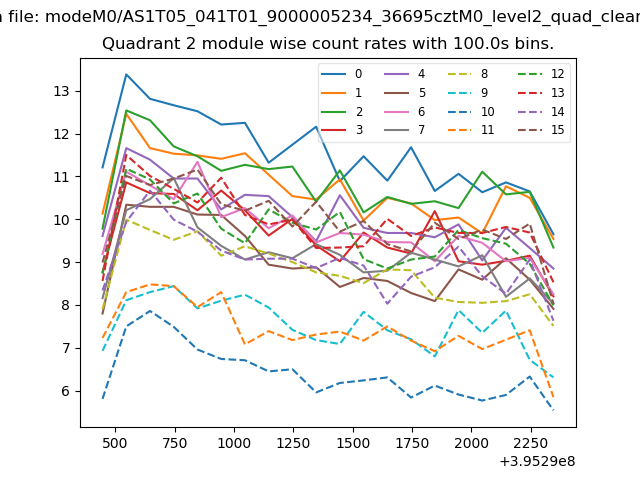
| Module-wise count rates for Quadrant B Data is divided into 100 sec bins |
 |
 |
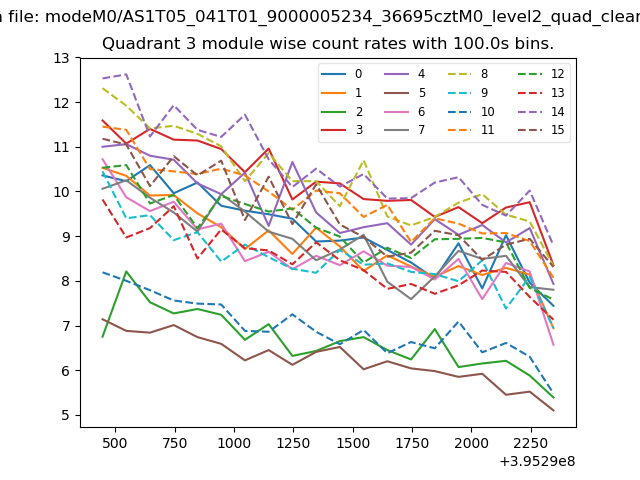
| Module-wise count rates for Quadrant C Data is divided into 100 sec bins |
 |
 |
| Module-wise count rates for Quadrant D Data is divided into 100 sec bins |
 |
 |
| Parameter | Plot |
|---|---|
| CZT HV Monitor | 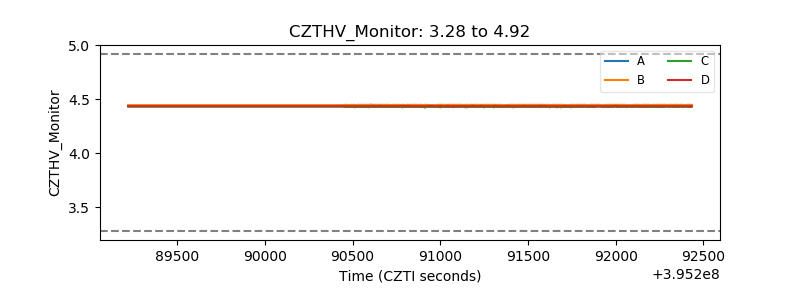 |
| D_VDD | 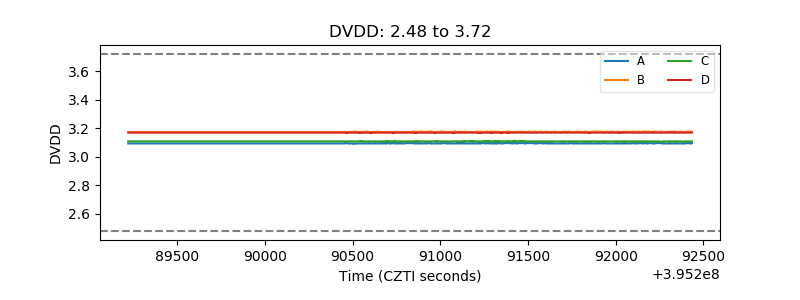 |
| Temperature 1 | 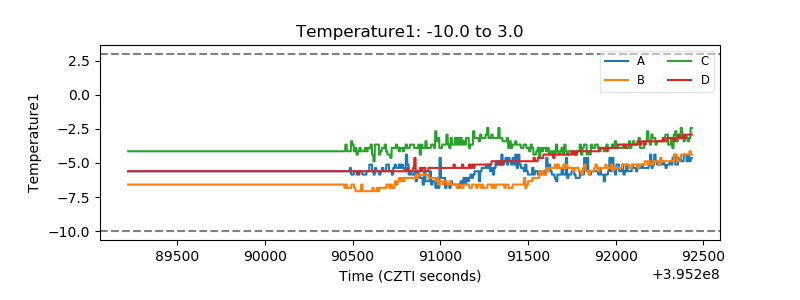 |
| Veto HV Monitor | 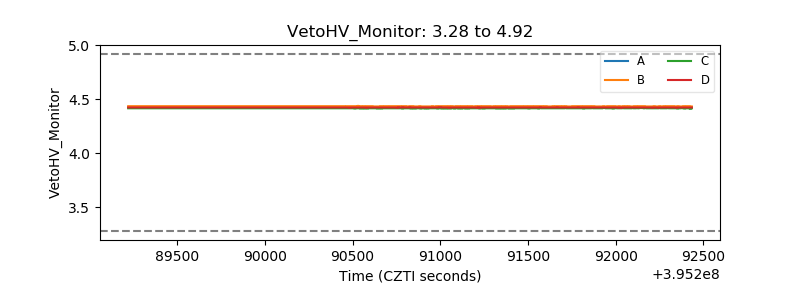 |
| Veto LLD | 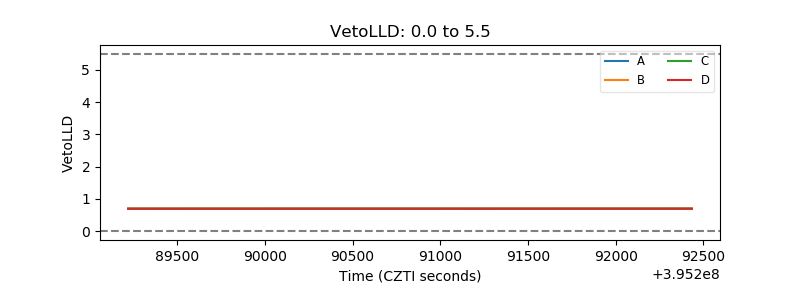 |
| Alpha Counter | 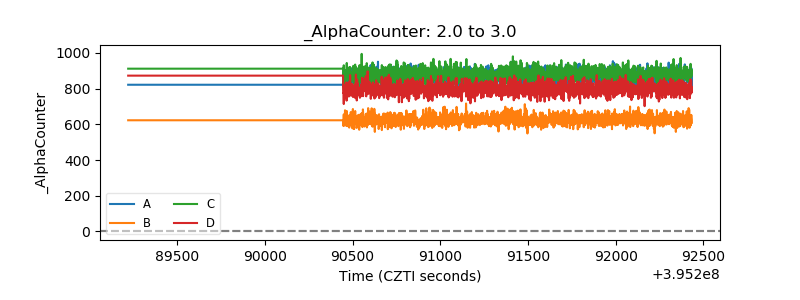 |
| _CPM_Rate | 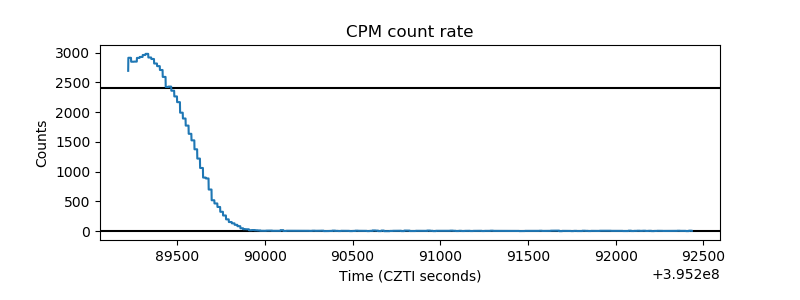 |
| CZT Counter | 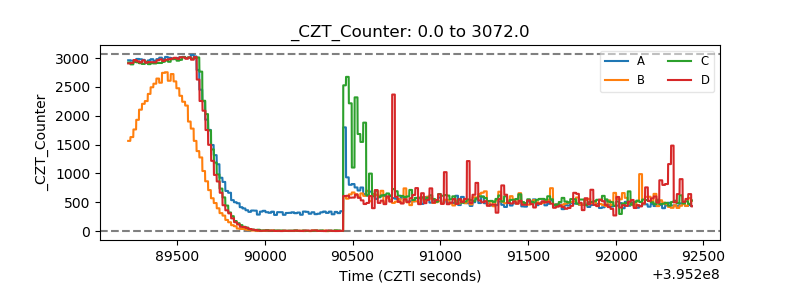 |
| +2.5 Volts monitor | 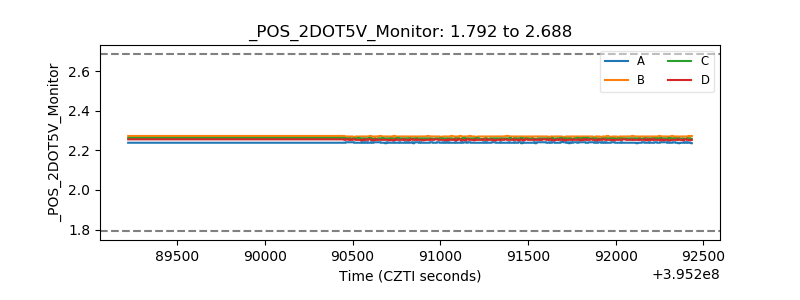 |
| +5 Volts monitor | 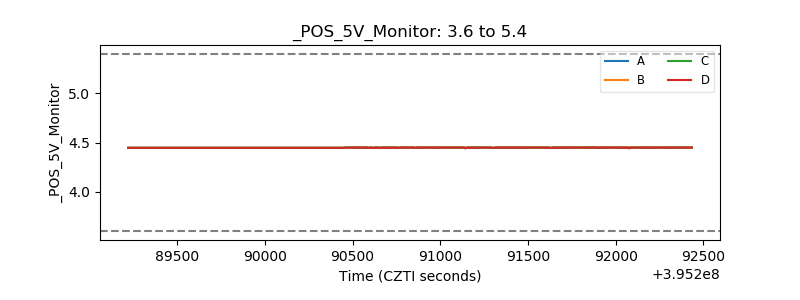 |
| _ROLL_ROT | 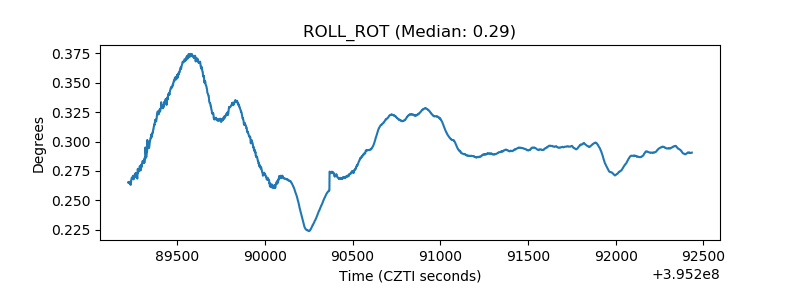 |
| _Roll_DEC | 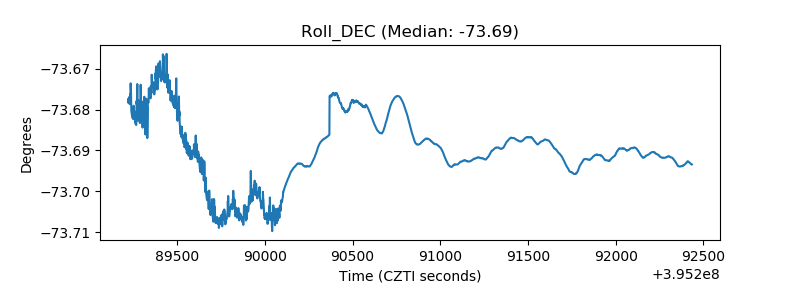 |
| _Roll_RA | 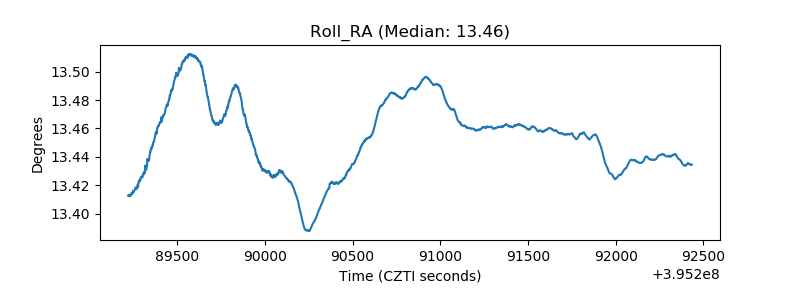 |
| Veto Counter | 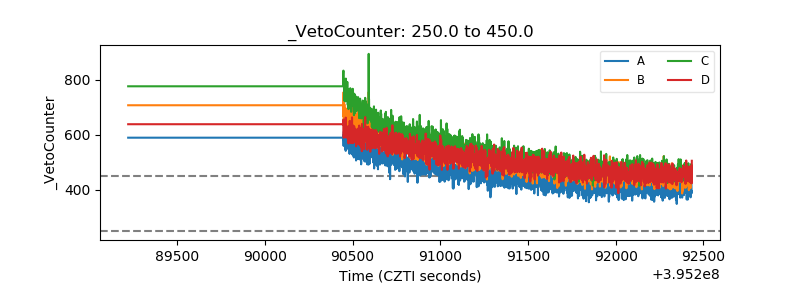 |