| Param | Original file | Final file |
|---|---|---|
| Filename | modeM0/AS1C07_001T09_9000005236cztM0_level2.fits | modeM0/AS1C07_001T09_9000005236cztM0_level2_quad_clean.evt |
| Size (bytes) | 652,469,760 | 983,744,640 |
| Size | 622.2 MB | 938.2 MB |
| Events in quadrant A | 4,003,812 | 6,632,127 |
| Events in quadrant B | 3,781,932 | 6,510,981 |
| Events in quadrant C | 3,821,898 | 6,191,689 |
| Events in quadrant D | 3,300,528 | 5,612,495 |
| Mode SS | |||
|---|---|---|---|
| Quadrant | BADHDUFLAG | Total packets | Discarded packets |
| A | 0 | 1446 | 0 |
| B | 0 | 1446 | 0 |
| C | 0 | 1446 | 0 |
| D | 0 | 1446 | 0 |
| Mode M9 | |||
|---|---|---|---|
| Quadrant | BADHDUFLAG | Total packets | Discarded packets |
| A | 0 | 286 | 0 |
| B | 0 | 286 | 0 |
| C | 0 | 286 | 0 |
| D | 0 | 286 | 0 |
| Mode M0 | |||
|---|---|---|---|
| Quadrant | BADHDUFLAG | Total packets | Discarded packets |
| A | 0 | 147552 | 0 |
| B | 0 | 159112 | 0 |
| C | 0 | 171799 | 0 |
| D | 0 | 188539 | 0 |
| Quadrant | Total seconds | Saturated seconds | Saturation percentage |
|---|---|---|---|
| A | 70734 | 214 | 0.302542% |
| B | 70734 | 874 | 1.235615% |
| C | 70734 | 2100 | 2.968869% |
| D | 70734 | 3104 | 4.388272% |
Noise dominated data is calculated using 1-second bins in cleaned event files. If a bin has >2000 counts, and if more than 50% of those come from <1% of pixels, then it is considered to be noise-dominated and hence unusable.
| Quadrant | # 1 sec bins | Bins with >0 counts | Bins with >2000 counts | High rate bins dominated by noise | Noise dominated (total time) | Noise dominated (detector-on time) | Marked lightcurve |
|---|---|---|---|---|---|---|---|
| A | 99304 | 70734 | 0 | 0 | 0.00% | 0.00% | 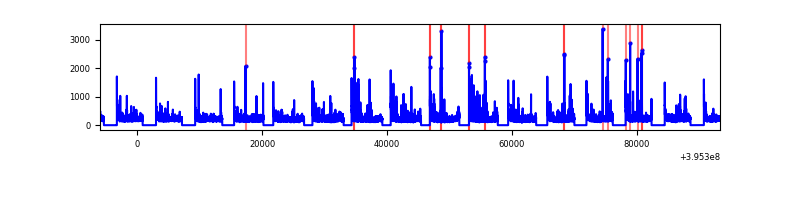 |
| B | 99304 | 70729 | 0 | 0 | 0.00% | 0.00% |  |
| C | 99304 | 70709 | 0 | 0 | 0.00% | 0.00% |  |
| D | 99304 | 70671 | 0 | 0 | 0.00% | 0.00% |  |
Top three noisy pixels from each quadrant. If the there are fewer than three noisy pixels in the level2.evt file, extra rows are filled as -1
| Pixel properties | Quadrant properties | ||||||
|---|---|---|---|---|---|---|---|
| Quadrant | DetID | PixID | Counts | Sigma | Mean | Median | Sigma |
| A | 9 | 19 | 3297 | 8.92 | 1046 | 988 | 258.8 |
| A | 7 | 110 | 3278 | 8.85 | 1046 | 988 | 258.8 |
| A | 0 | 29 | 3144 | 8.33 | 1046 | 988 | 258.8 |
| B | 2 | 9 | 3273 | 11.92 | 1006 | 969 | 193.3 |
| B | 3 | 80 | 3106 | 11.05 | 1006 | 969 | 193.3 |
| B | 2 | 8 | 2697 | 8.94 | 1006 | 969 | 193.3 |
| C | 1 | 81 | 3199 | 8.72 | 1010 | 954 | 257.4 |
| C | 3 | 203 | 3088 | 8.29 | 1010 | 954 | 257.4 |
| C | 1 | 80 | 3050 | 8.14 | 1010 | 954 | 257.4 |
| D | 7 | 3 | 2485 | 6.39 | 946 | 864 | 253.8 |
| D | 4 | 160 | 2482 | 6.37 | 946 | 864 | 253.8 |
| D | 10 | 189 | 2458 | 6.28 | 946 | 864 | 253.8 |
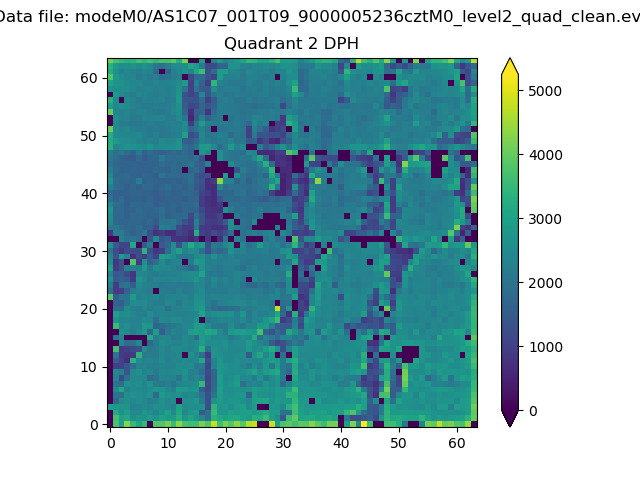
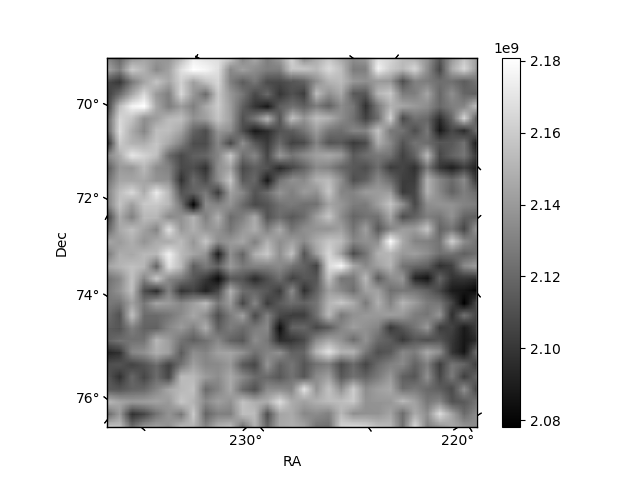
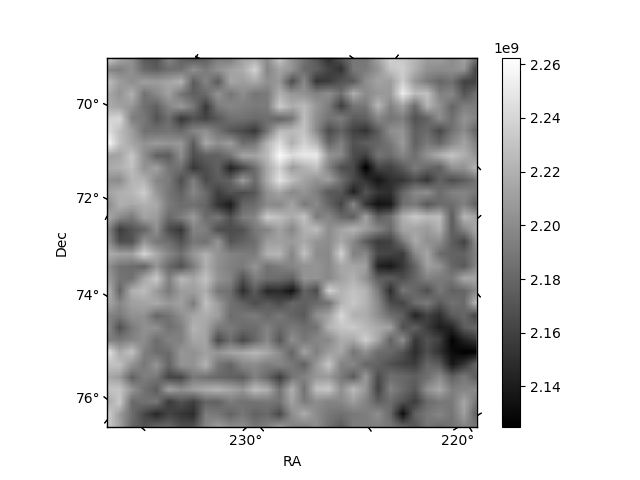
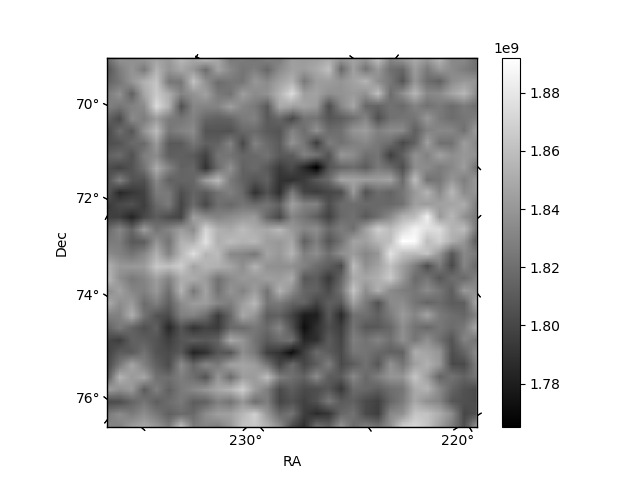
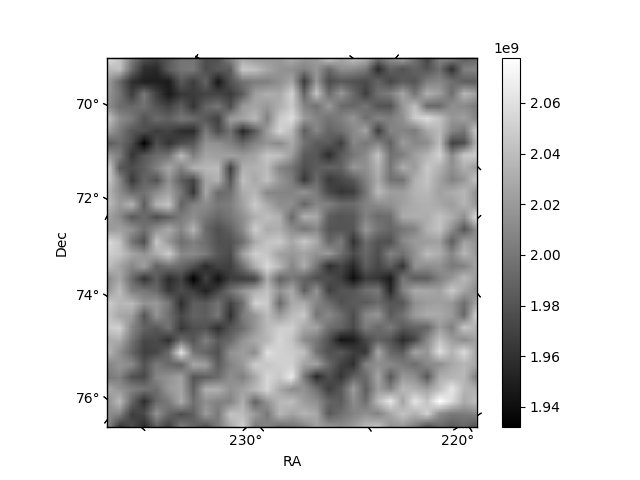
Histogram calculated using DETX and DETY for each event in the final _common_clean file
| Quadrant A |  |
 |
Quadrant B |
|---|---|---|---|
| Quadrant D | 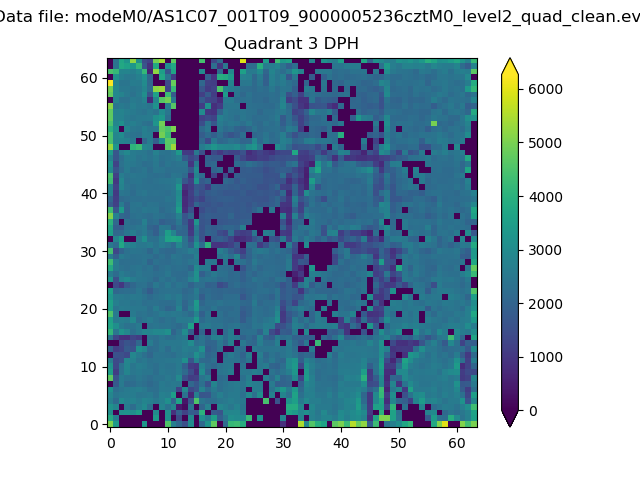 |
 |
Quadrant C |
| Plot type | Count rate plots | Images |
|---|---|---|
| Comparison with Poisson distribution Blue bars denote a histogram of data divided into 1 sec bins. Red curve is a Poisson curve with rate = median count rate of data. |
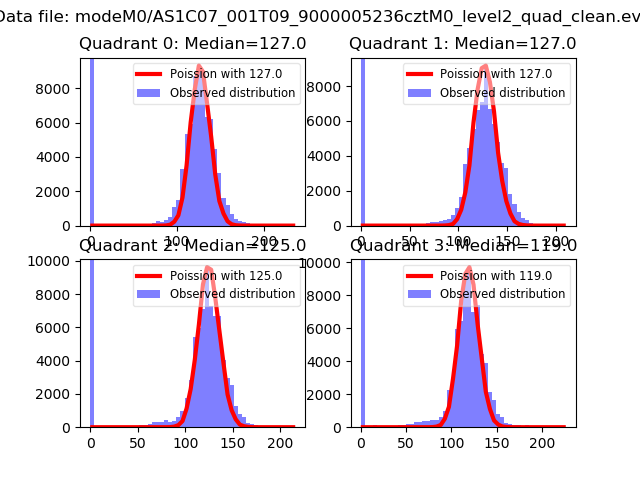 |
 |
| Quadrant-wise count rates Data is divided into 100 sec bins |
 |
|
| Module-wise count rates for Quadrant A Data is divided into 100 sec bins |
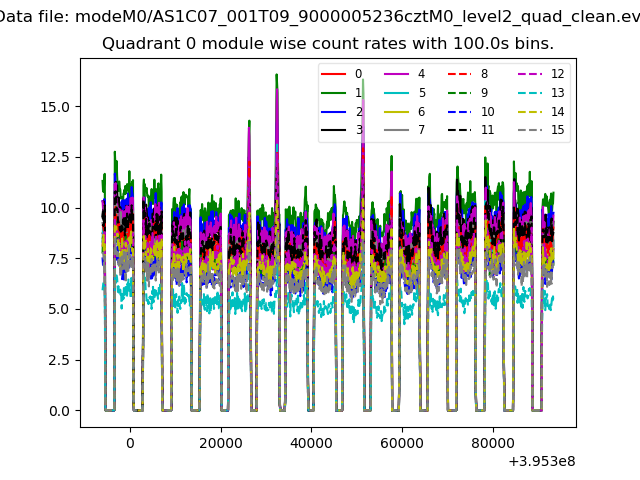 |
 |
| Module-wise count rates for Quadrant B Data is divided into 100 sec bins |
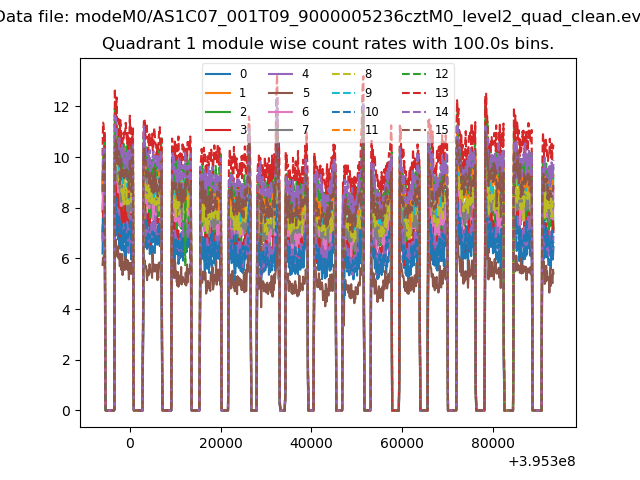 |
 |
| Module-wise count rates for Quadrant C Data is divided into 100 sec bins |
 |
 |
| Module-wise count rates for Quadrant D Data is divided into 100 sec bins |
 |
 |
| Parameter | Plot |
|---|---|
| CZT HV Monitor |  |
| D_VDD |  |
| Temperature 1 | 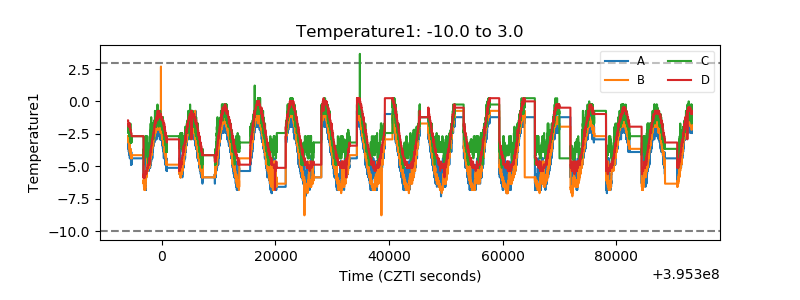 |
| Veto HV Monitor | 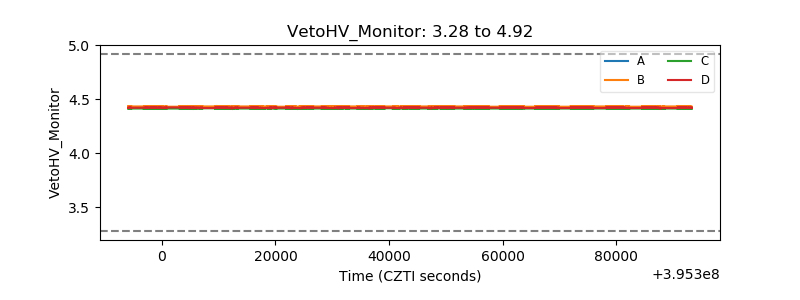 |
| Veto LLD |  |
| Alpha Counter |  |
| _CPM_Rate | 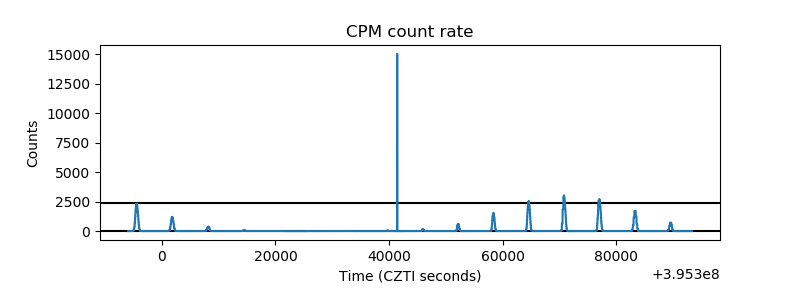 |
| CZT Counter |  |
| +2.5 Volts monitor |  |
| +5 Volts monitor |  |
| _ROLL_ROT |  |
| _Roll_DEC |  |
| _Roll_RA |  |
| Veto Counter |  |