| Param | Original file | Final file |
|---|---|---|
| Filename | modeM0/AS1C07_001T09_9000005236_36695cztM0_level2.evt | modeM0/AS1C07_001T09_9000005236_36695cztM0_level2_quad_clean.evt |
| Size (bytes) | 130,913,280 | 33,491,520 |
| Size | 124.8 MB | 31.9 MB |
| Events in quadrant A | 860,465 | 229,158 |
| Events in quadrant B | 895,933 | 231,685 |
| Events in quadrant C | 1,075,126 | 222,102 |
| Events in quadrant D | 1,024,150 | 215,221 |
| Mode SS | |||
|---|---|---|---|
| Quadrant | BADHDUFLAG | Total packets | Discarded packets |
| A | 0 | 32 | 0 |
| B | 0 | 32 | 0 |
| C | 0 | 32 | 0 |
| D | 0 | 32 | 0 |
| Mode M9 | |||
|---|---|---|---|
| Quadrant | BADHDUFLAG | Total packets | Discarded packets |
| A | 0 | 21 | 0 |
| B | 0 | 21 | 0 |
| C | 0 | 21 | 0 |
| D | 0 | 21 | 0 |
| Mode M0 | |||
|---|---|---|---|
| Quadrant | BADHDUFLAG | Total packets | Discarded packets |
| A | 0 | 3440 | 2 |
| B | 0 | 3539 | 1 |
| C | 0 | 4065 | 1 |
| D | 0 | 4063 | 1 |
| Quadrant | Total seconds | Saturated seconds | Saturation percentage |
|---|---|---|---|
| A | 1571 | 3 | 0.190961% |
| B | 1571 | 20 | 1.273074% |
| C | 1571 | 85 | 5.410567% |
| D | 1571 | 59 | 3.755570% |
Noise dominated data is calculated using 1-second bins in cleaned event files. If a bin has >2000 counts, and if more than 50% of those come from <1% of pixels, then it is considered to be noise-dominated and hence unusable.
| Quadrant | # 1 sec bins | Bins with >0 counts | Bins with >2000 counts | High rate bins dominated by noise | Noise dominated (total time) | Noise dominated (detector-on time) | Marked lightcurve |
|---|---|---|---|---|---|---|---|
| A | 3664 | 1572 | 1 | 1 | 0.03% | 0.06% | 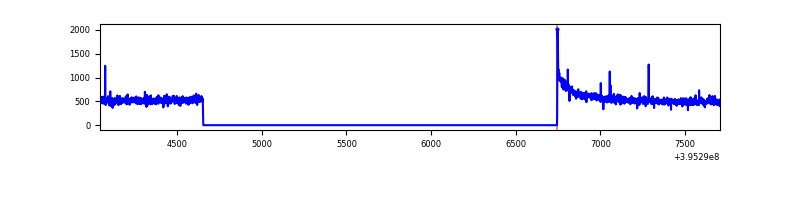 |
| B | 3664 | 1572 | 12 | 12 | 0.33% | 0.76% | 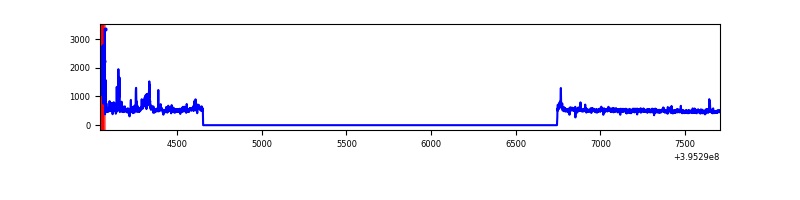 |
| C | 3664 | 1572 | 67 | 67 | 1.83% | 4.26% | 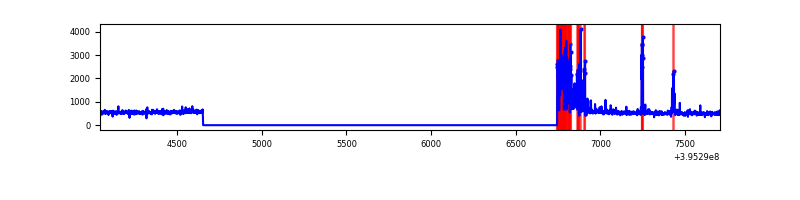 |
| D | 3664 | 1572 | 55 | 55 | 1.50% | 3.50% | 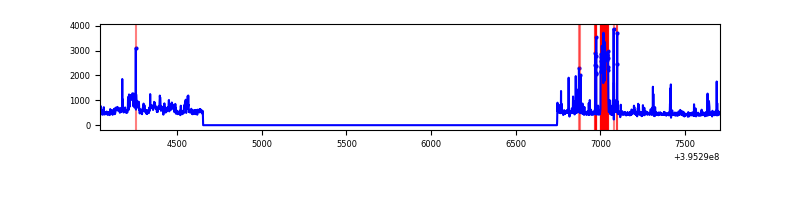 |
Top three noisy pixels from each quadrant. If the there are fewer than three noisy pixels in the level2.evt file, extra rows are filled as -1
| Pixel properties | Quadrant properties | ||||||
|---|---|---|---|---|---|---|---|
| Quadrant | DetID | PixID | Counts | Sigma | Mean | Median | Sigma |
| A | 10 | 83 | 86858 | 2124.58 | 198 | 194 | 40.8 |
| A | 9 | 143 | 3645 | 84.6 | 198 | 194 | 40.8 |
| A | 13 | 254 | 2435 | 54.94 | 198 | 194 | 40.8 |
| B | 15 | 85 | 55830 | 1459.54 | 195 | 191 | 38.1 |
| B | 14 | 254 | 29370 | 765.43 | 195 | 191 | 38.1 |
| B | 5 | 255 | 7859 | 201.15 | 195 | 191 | 38.1 |
| C | 0 | 10 | 257450 | 5815.94 | 187 | 188 | 44.2 |
| C | 15 | 214 | 72943 | 1644.78 | 187 | 188 | 44.2 |
| C | 14 | 254 | 11839 | 263.4 | 187 | 188 | 44.2 |
| D | 10 | 253 | 96077 | 2032.38 | 190 | 185 | 47.2 |
| D | 13 | 249 | 80752 | 1707.58 | 190 | 185 | 47.2 |
| D | 7 | 55 | 26977 | 567.84 | 190 | 185 | 47.2 |
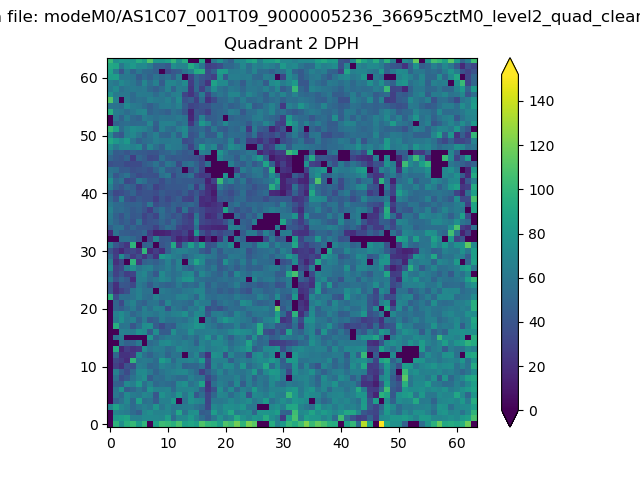
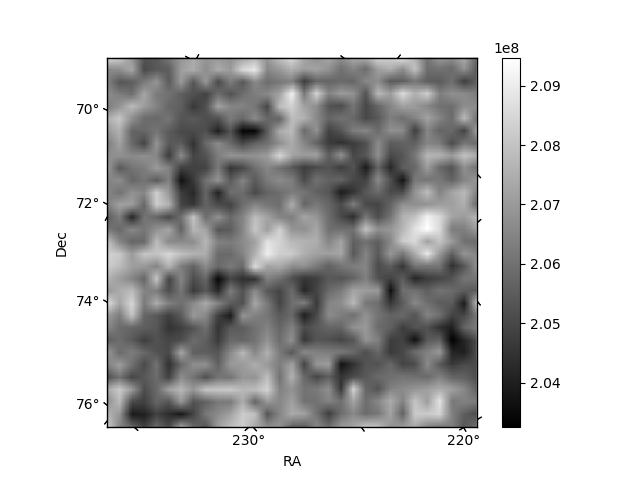
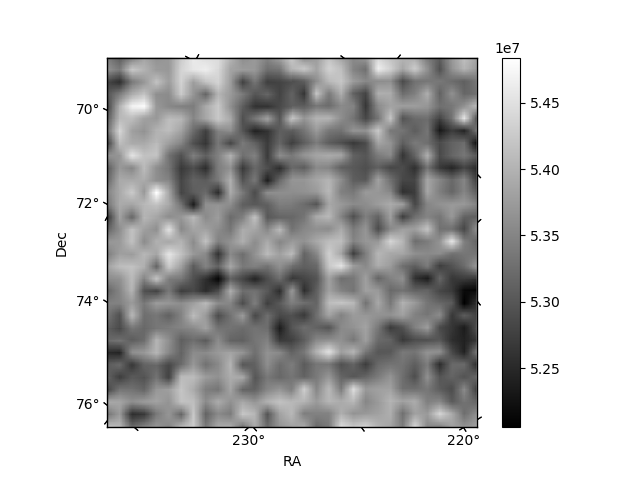
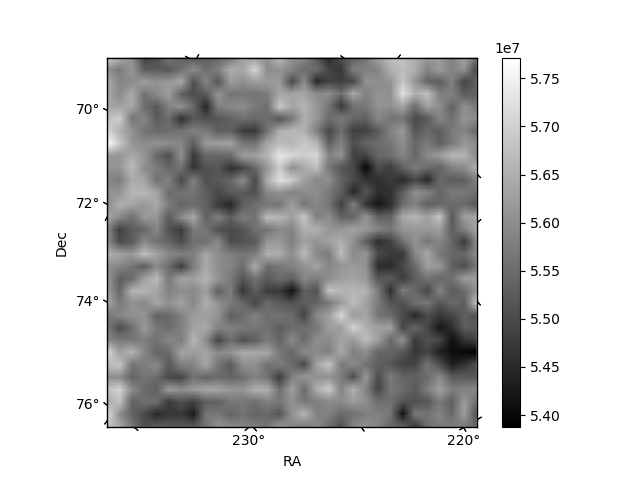
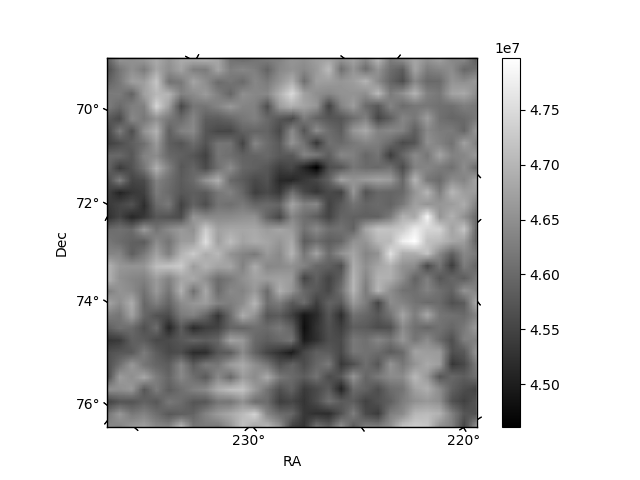
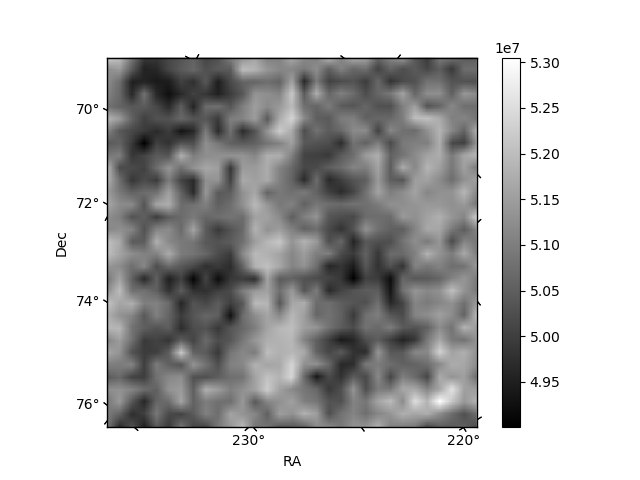
Histogram calculated using DETX and DETY for each event in the final _common_clean file
| Quadrant A | 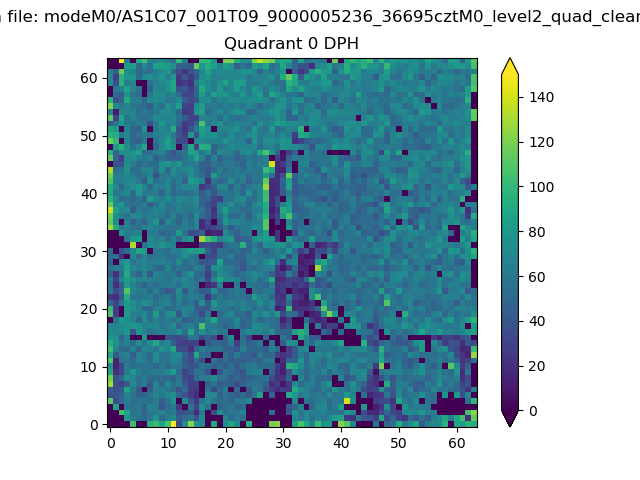 |
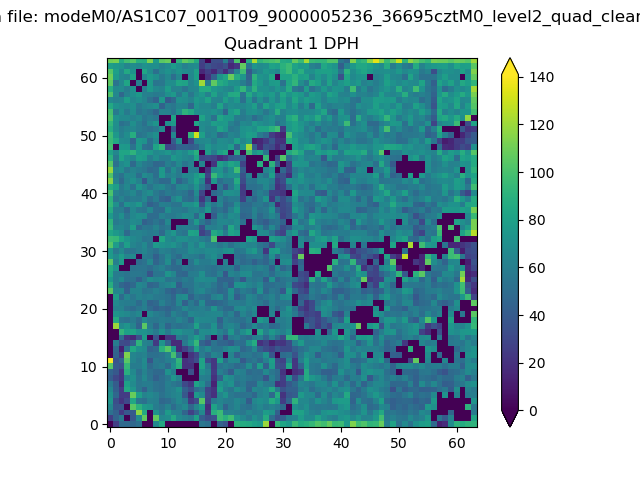 |
Quadrant B |
|---|---|---|---|
| Quadrant D | 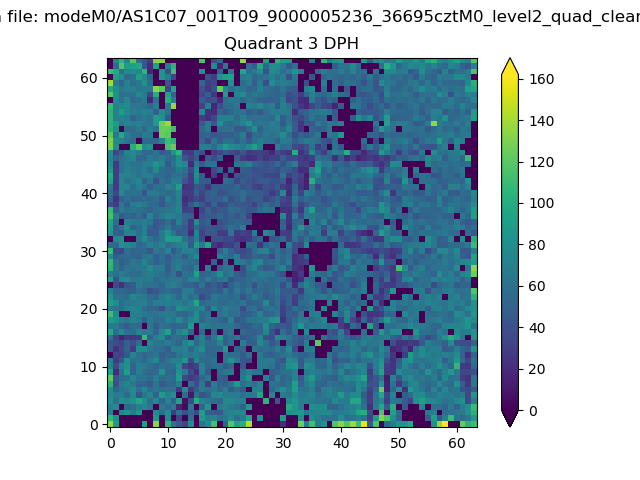 |
 |
Quadrant C |
| Plot type | Count rate plots | Images |
|---|---|---|
| Comparison with Poisson distribution Blue bars denote a histogram of data divided into 1 sec bins. Red curve is a Poisson curve with rate = median count rate of data. |
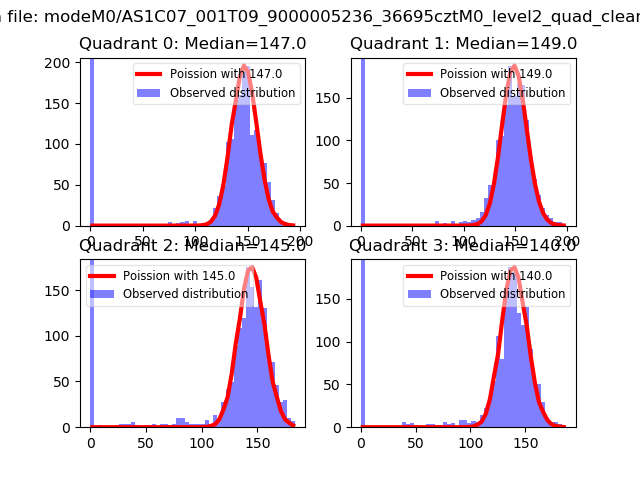 |
 |
| Quadrant-wise count rates Data is divided into 100 sec bins |
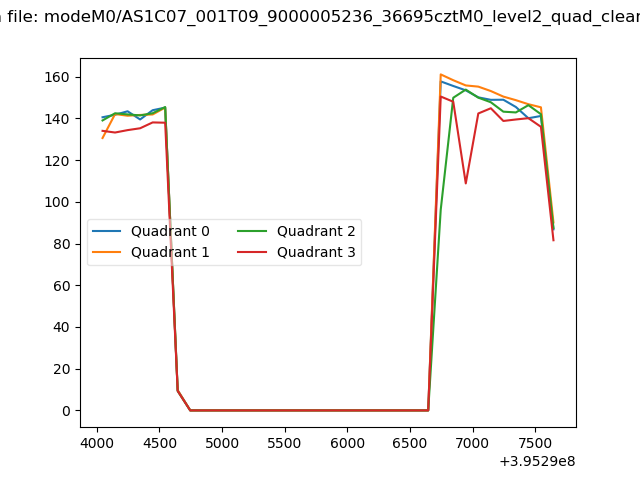 |
|
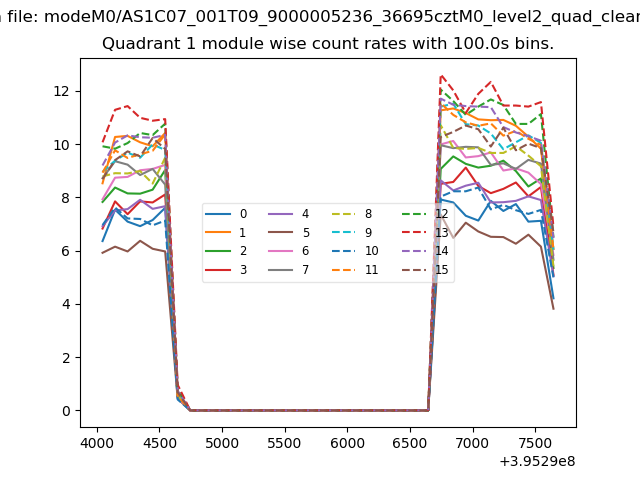
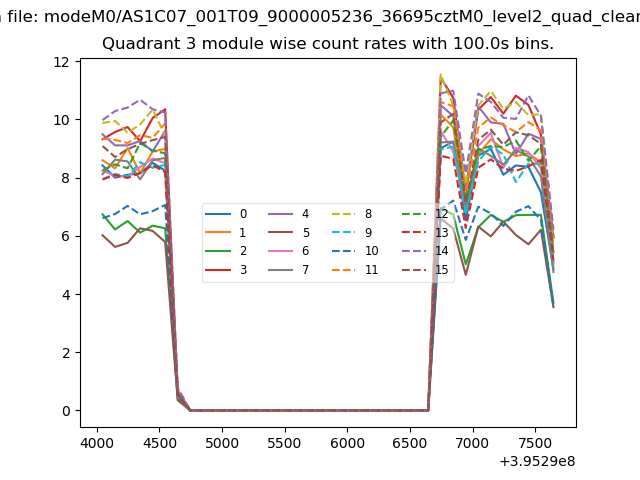
| Module-wise count rates for Quadrant A Data is divided into 100 sec bins |
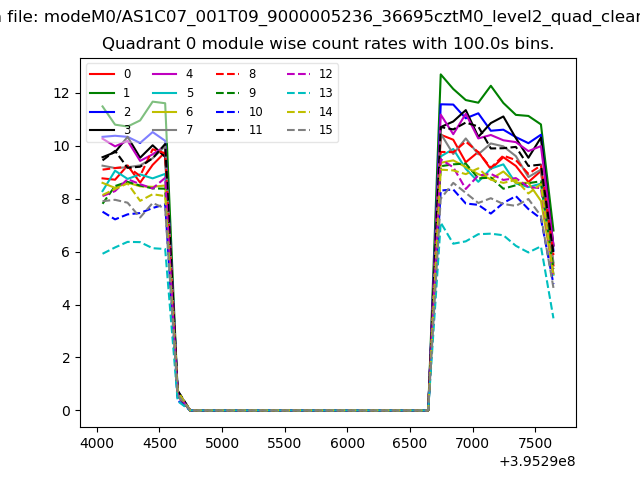 |
 |
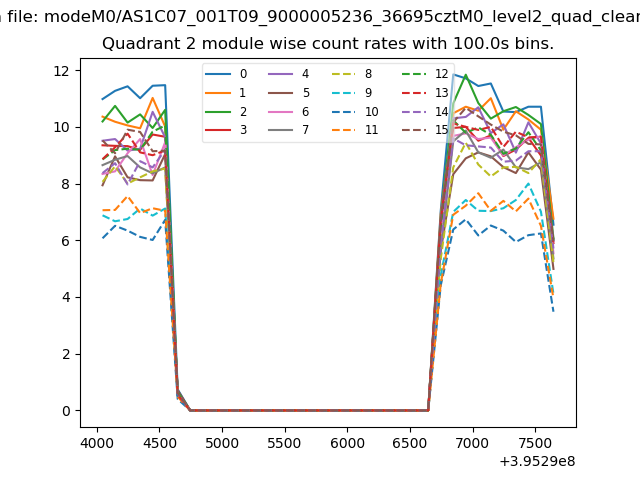
| Module-wise count rates for Quadrant B Data is divided into 100 sec bins |
 |
 |
| Module-wise count rates for Quadrant C Data is divided into 100 sec bins |
 |
 |
| Module-wise count rates for Quadrant D Data is divided into 100 sec bins |
 |
 |
| Parameter | Plot |
|---|---|
| CZT HV Monitor | 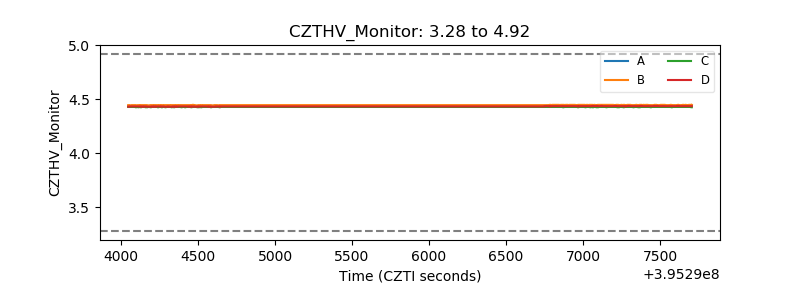 |
| D_VDD | 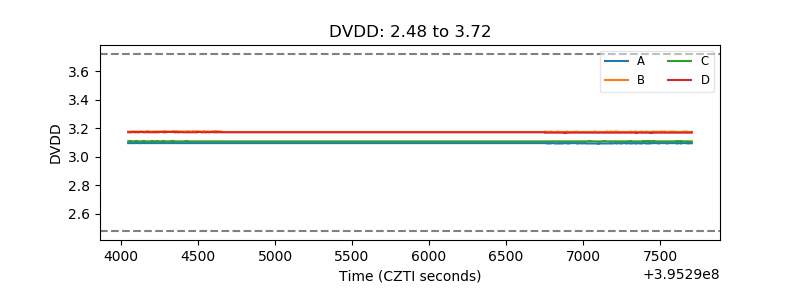 |
| Temperature 1 | 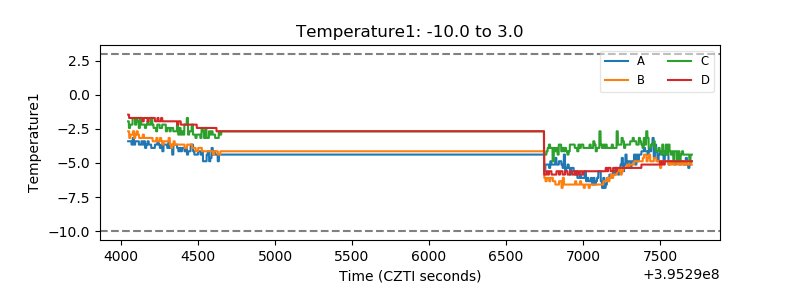 |
| Veto HV Monitor |  |
| Veto LLD | 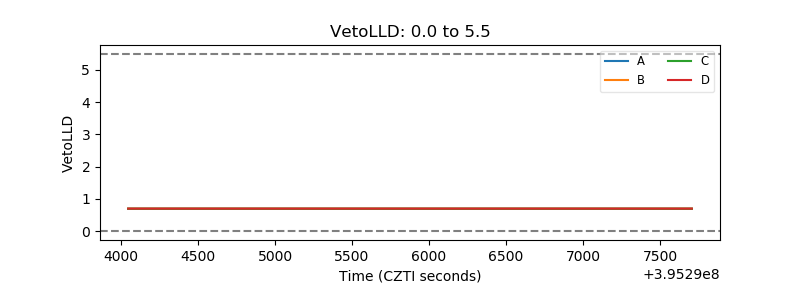 |
| Alpha Counter | 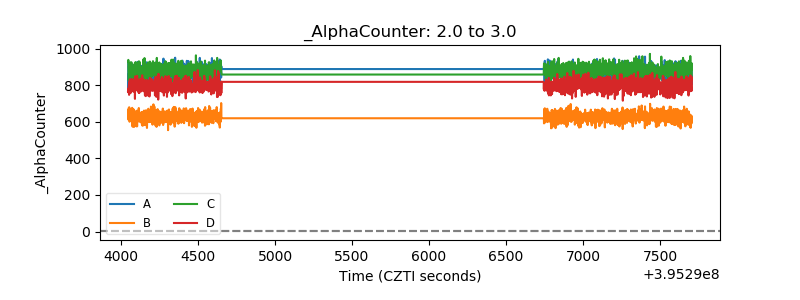 |
| _CPM_Rate | 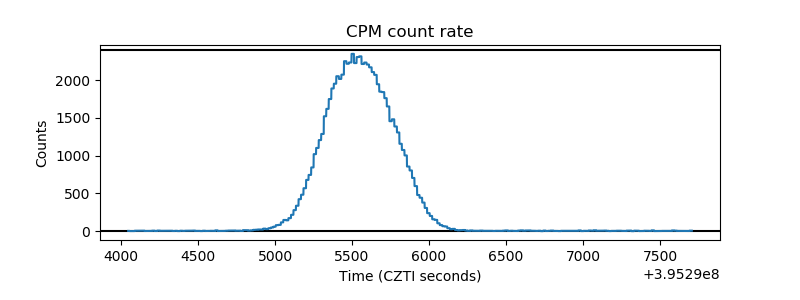 |
| CZT Counter | 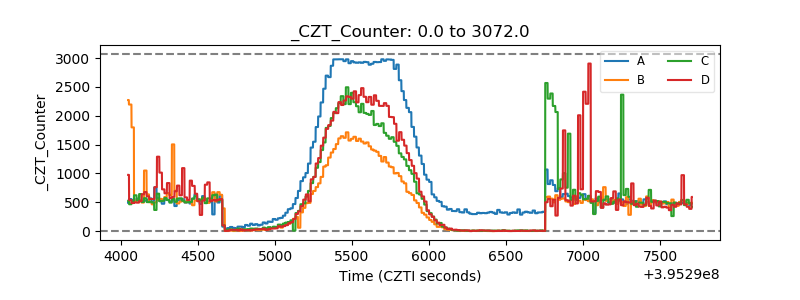 |
| +2.5 Volts monitor | 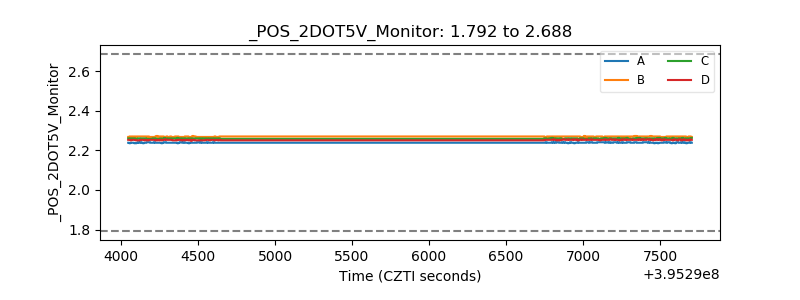 |
| +5 Volts monitor |  |
| _ROLL_ROT | 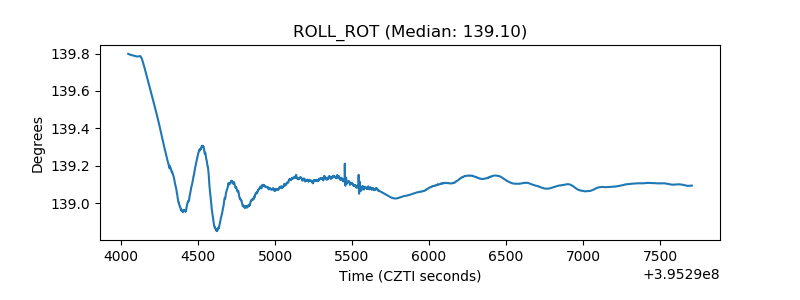 |
| _Roll_DEC | 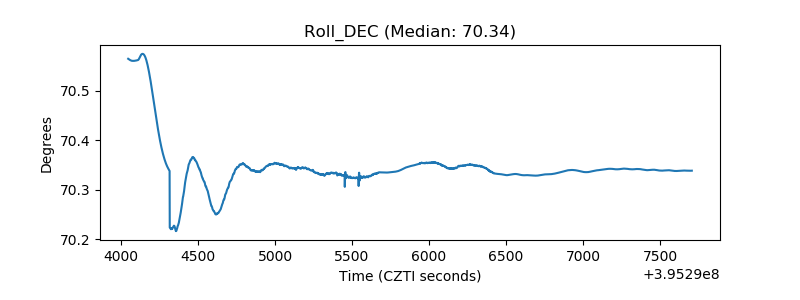 |
| _Roll_RA | 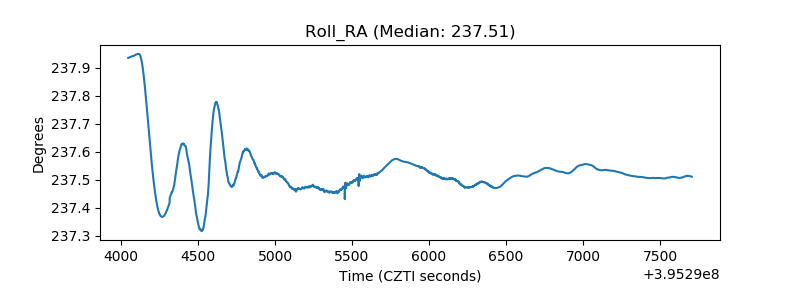 |
| Veto Counter | 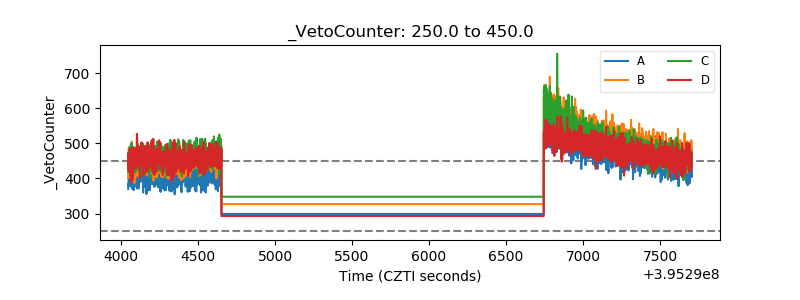 |