| Param | Original file | Final file |
|---|---|---|
| Filename | modeM0/AS1C07_001T09_9000005236_36696cztM0_level2.evt | modeM0/AS1C07_001T09_9000005236_36696cztM0_level2_quad_clean.evt |
| Size (bytes) | 357,664,320 | 94,305,600 |
| Size | 341.1 MB | 89.9 MB |
| Events in quadrant A | 2,351,836 | 646,534 |
| Events in quadrant B | 2,553,402 | 651,376 |
| Events in quadrant C | 2,831,504 | 632,154 |
| Events in quadrant D | 2,779,158 | 599,929 |
| Mode SS | |||
|---|---|---|---|
| Quadrant | BADHDUFLAG | Total packets | Discarded packets |
| A | 0 | 96 | 0 |
| B | 0 | 96 | 0 |
| C | 0 | 96 | 0 |
| D | 0 | 96 | 0 |
| Mode M9 | |||
|---|---|---|---|
| Quadrant | BADHDUFLAG | Total packets | Discarded packets |
| A | 0 | 21 | 0 |
| B | 0 | 21 | 0 |
| C | 0 | 21 | 0 |
| D | 0 | 21 | 0 |
| Mode M0 | |||
|---|---|---|---|
| Quadrant | BADHDUFLAG | Total packets | Discarded packets |
| A | 0 | 9634 | 2 |
| B | 0 | 10339 | 1 |
| C | 0 | 11070 | 1 |
| D | 0 | 11204 | 1 |
| Quadrant | Total seconds | Saturated seconds | Saturation percentage |
|---|---|---|---|
| A | 4638 | 2 | 0.043122% |
| B | 4638 | 70 | 1.509271% |
| C | 4638 | 112 | 2.414834% |
| D | 4638 | 128 | 2.759810% |
Noise dominated data is calculated using 1-second bins in cleaned event files. If a bin has >2000 counts, and if more than 50% of those come from <1% of pixels, then it is considered to be noise-dominated and hence unusable.
| Quadrant | # 1 sec bins | Bins with >0 counts | Bins with >2000 counts | High rate bins dominated by noise | Noise dominated (total time) | Noise dominated (detector-on time) | Marked lightcurve |
|---|---|---|---|---|---|---|---|
| A | 6791 | 4639 | 0 | 0 | 0.00% | 0.00% | 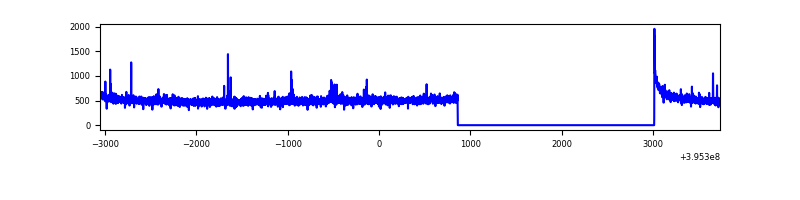 |
| B | 6791 | 4639 | 48 | 48 | 0.71% | 1.03% | 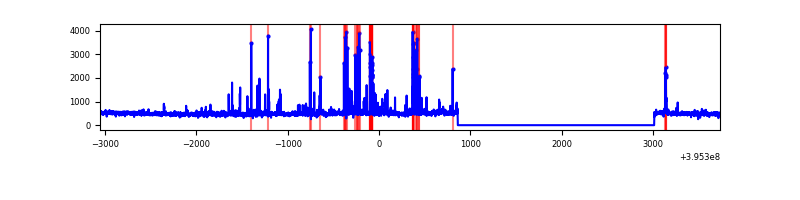 |
| C | 6791 | 4639 | 95 | 95 | 1.40% | 2.05% | 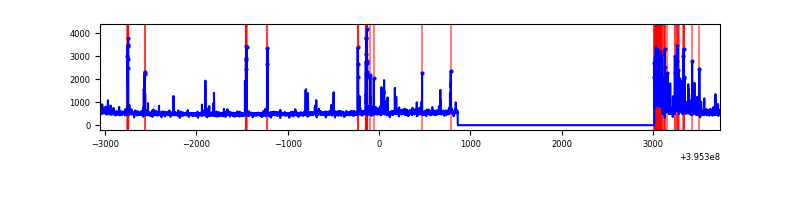 |
| D | 6791 | 4639 | 105 | 105 | 1.55% | 2.26% | 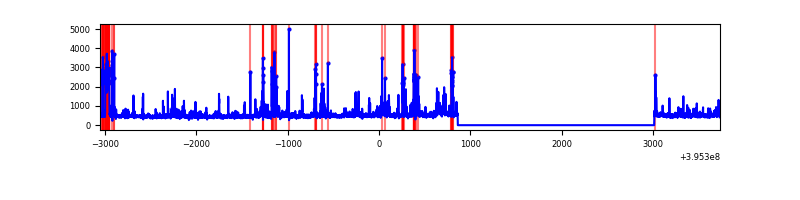 |
Top three noisy pixels from each quadrant. If the there are fewer than three noisy pixels in the level2.evt file, extra rows are filled as -1
| Pixel properties | Quadrant properties | ||||||
|---|---|---|---|---|---|---|---|
| Quadrant | DetID | PixID | Counts | Sigma | Mean | Median | Sigma |
| A | 10 | 83 | 162144 | 1445.63 | 558 | 548 | 111.8 |
| A | 9 | 143 | 20127 | 175.15 | 558 | 548 | 111.8 |
| A | 13 | 6 | 10486 | 88.9 | 558 | 548 | 111.8 |
| B | 5 | 255 | 280244 | 2697.3 | 550 | 536 | 103.7 |
| B | 0 | 221 | 19806 | 185.83 | 550 | 536 | 103.7 |
| B | 0 | 190 | 19711 | 184.91 | 550 | 536 | 103.7 |
| C | 0 | 10 | 366263 | 2999.78 | 531 | 536 | 121.9 |
| C | 15 | 214 | 211375 | 1729.35 | 531 | 536 | 121.9 |
| C | 14 | 254 | 149255 | 1219.83 | 531 | 536 | 121.9 |
| D | 13 | 171 | 213953 | 1657.71 | 534 | 522 | 128.8 |
| D | 10 | 253 | 97627 | 754.21 | 534 | 522 | 128.8 |
| D | 12 | 233 | 83301 | 642.94 | 534 | 522 | 128.8 |
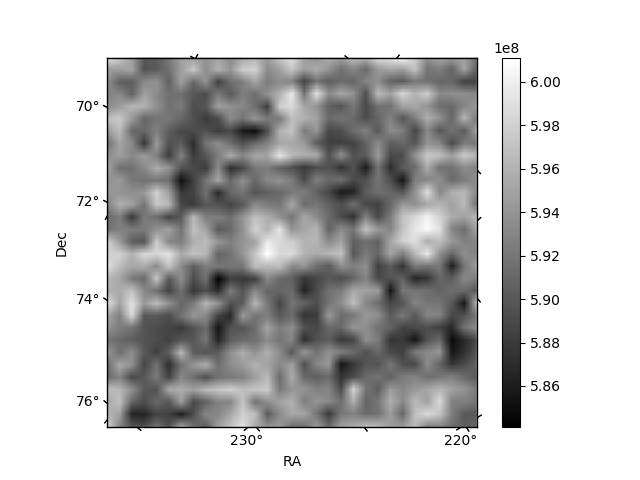
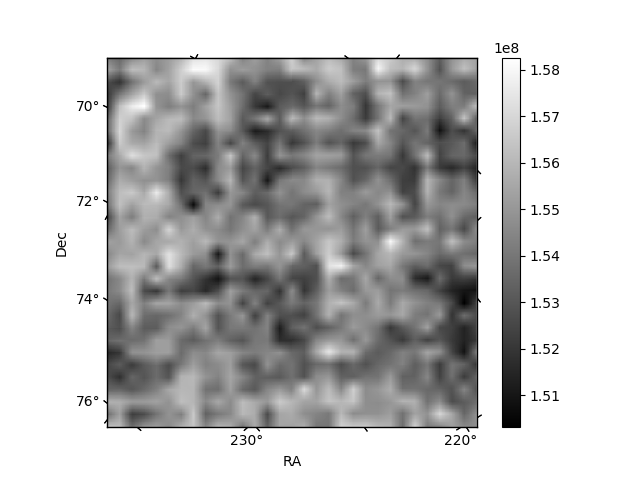
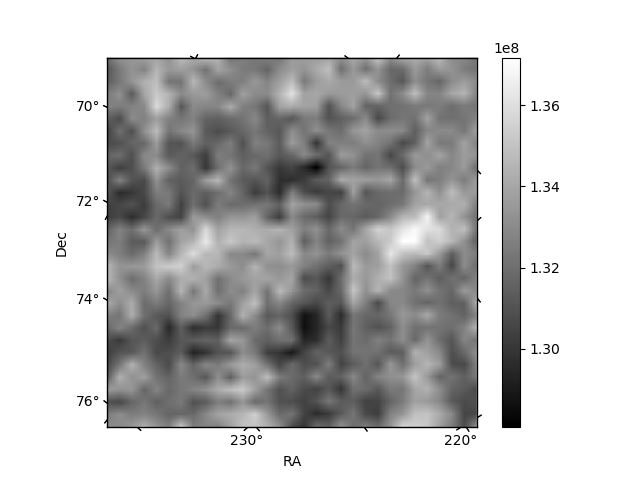
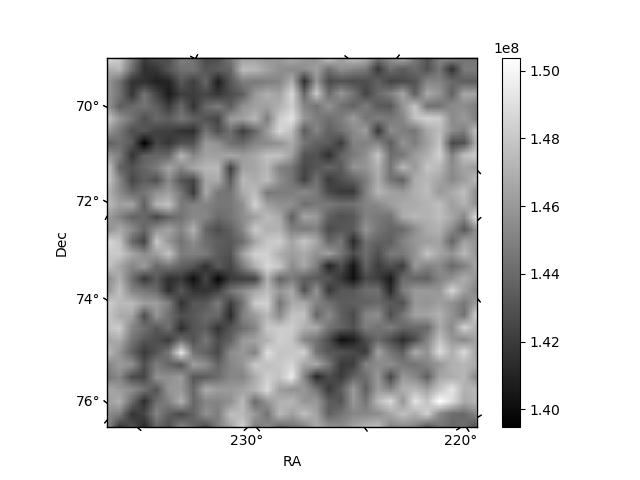
Histogram calculated using DETX and DETY for each event in the final _common_clean file
| Quadrant A | 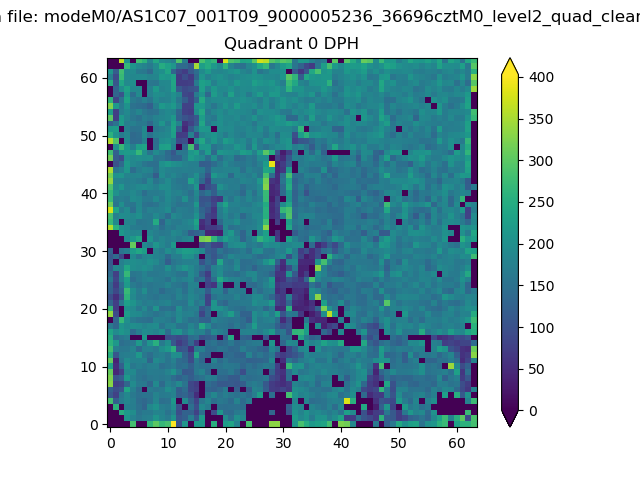 |
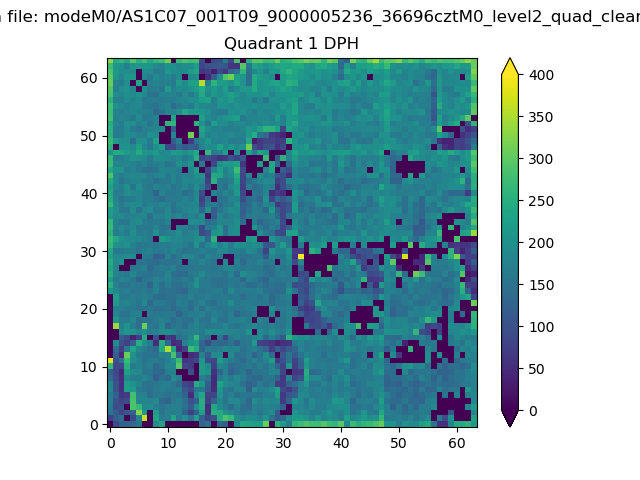 |
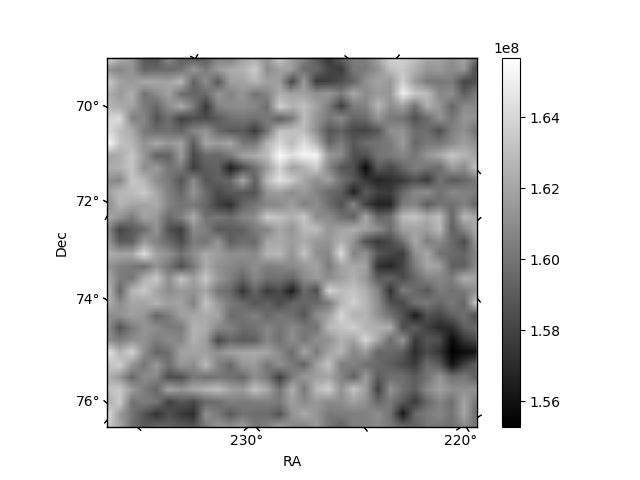
Quadrant B |
|---|---|---|---|
| Quadrant D | 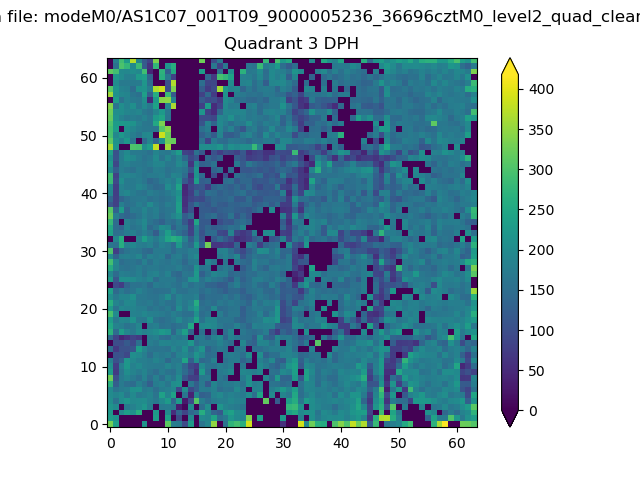 |
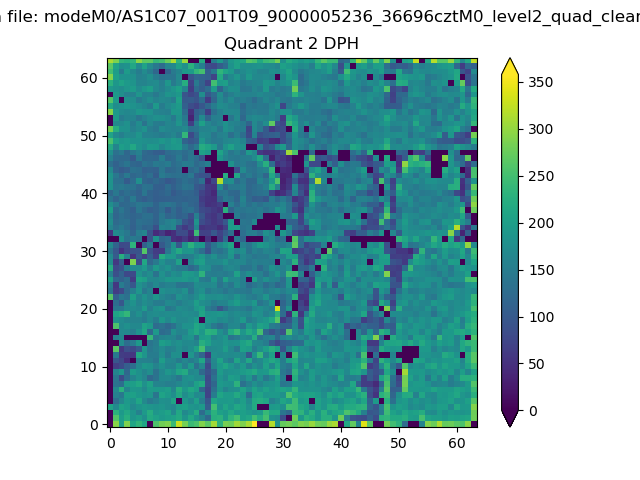 |
Quadrant C |
| Plot type | Count rate plots | Images |
|---|---|---|
| Comparison with Poisson distribution Blue bars denote a histogram of data divided into 1 sec bins. Red curve is a Poisson curve with rate = median count rate of data. |
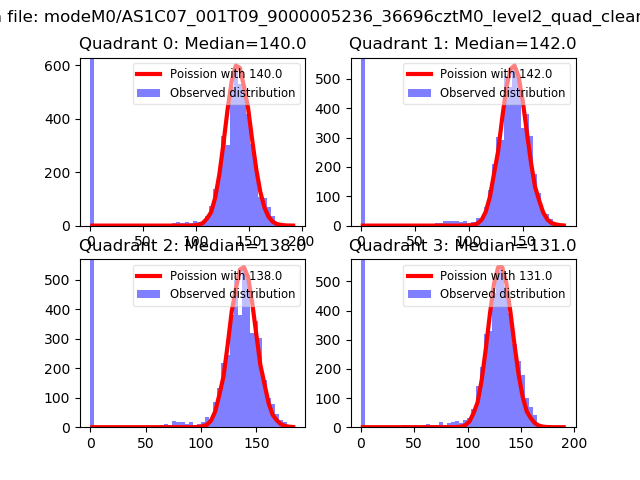 |
 |
| Quadrant-wise count rates Data is divided into 100 sec bins |
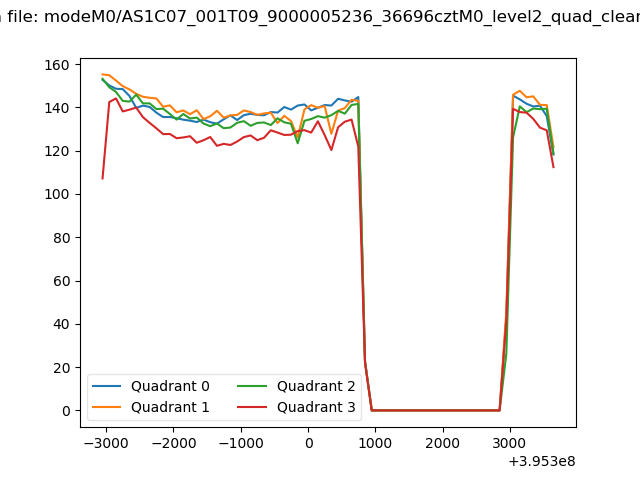 |
|
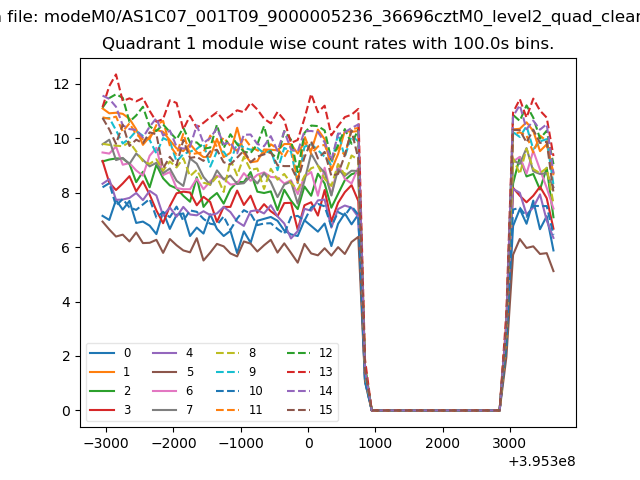
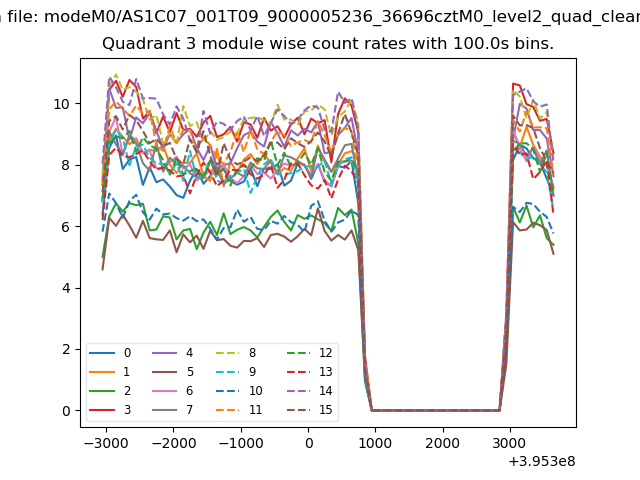
| Module-wise count rates for Quadrant A Data is divided into 100 sec bins |
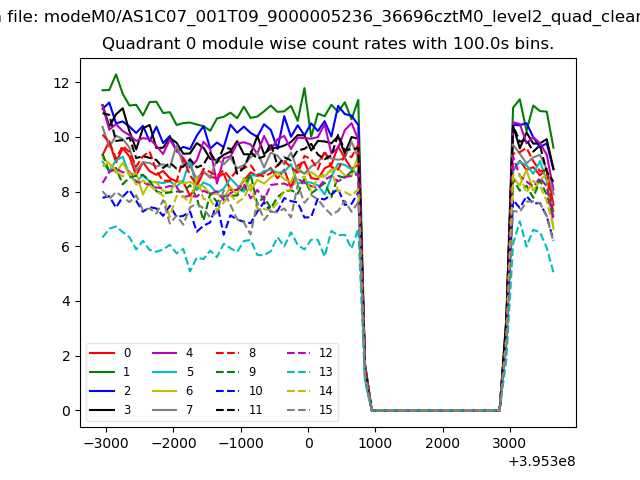 |
 |
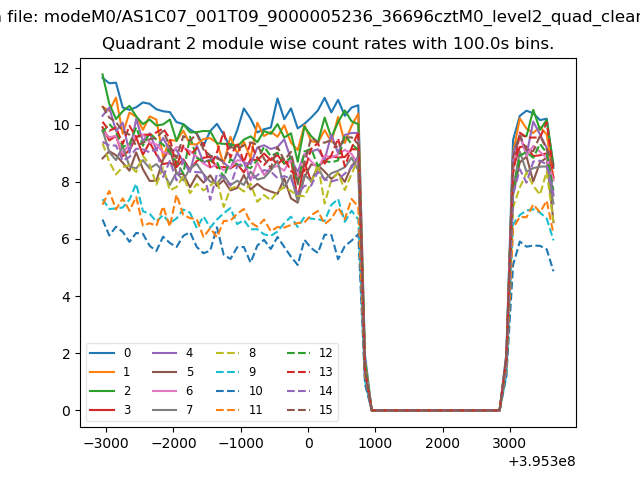
| Module-wise count rates for Quadrant B Data is divided into 100 sec bins |
 |
 |
| Module-wise count rates for Quadrant C Data is divided into 100 sec bins |
 |
 |
| Module-wise count rates for Quadrant D Data is divided into 100 sec bins |
 |
 |
| Parameter | Plot |
|---|---|
| CZT HV Monitor | 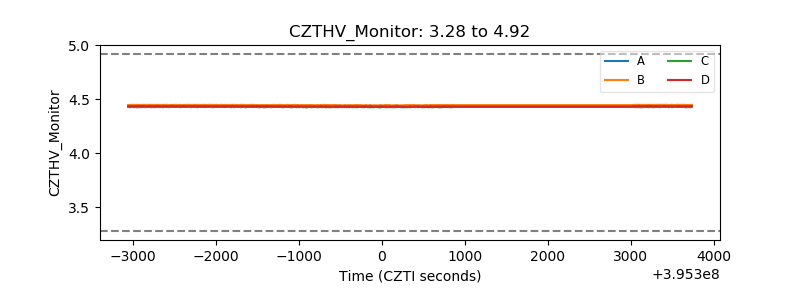 |
| D_VDD | 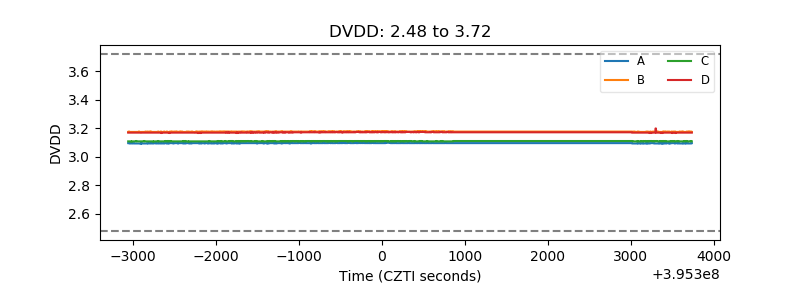 |
| Temperature 1 | 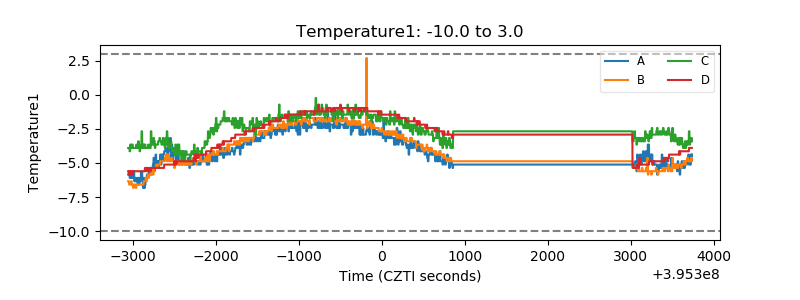 |
| Veto HV Monitor | 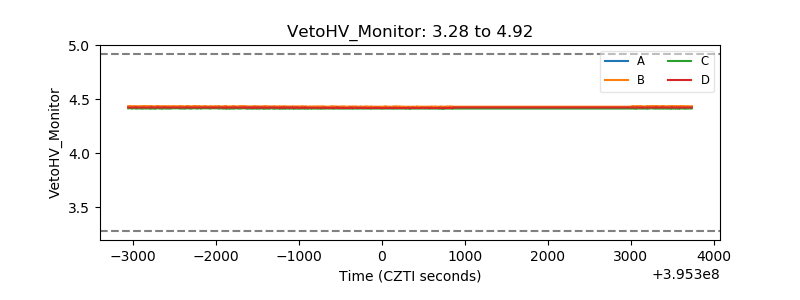 |
| Veto LLD | 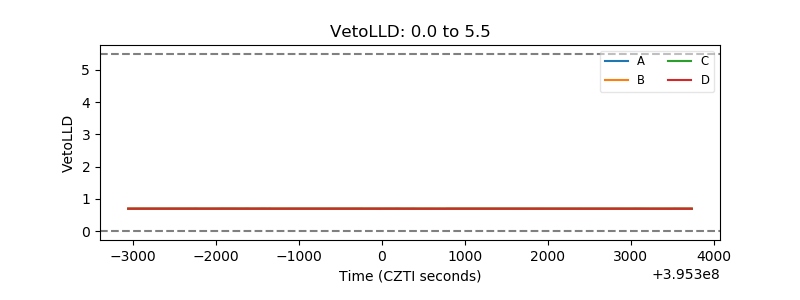 |
| Alpha Counter | 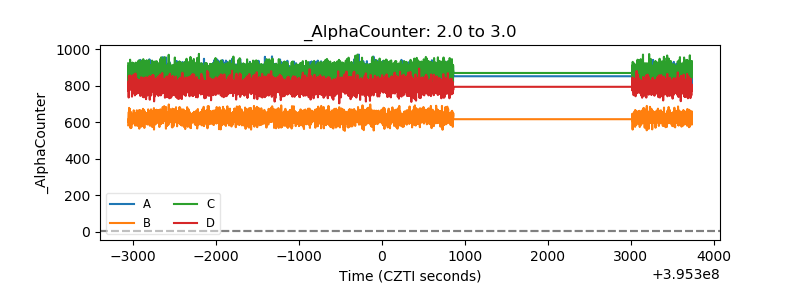 |
| _CPM_Rate | 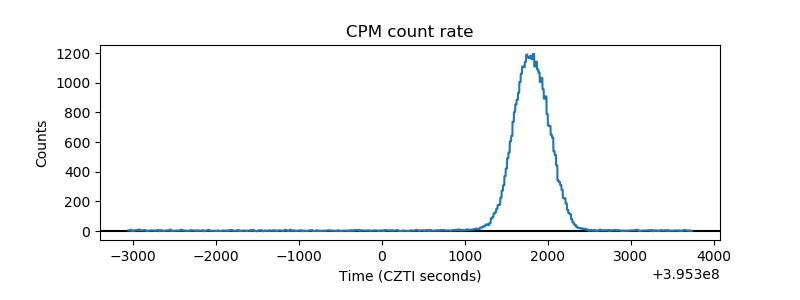 |
| CZT Counter | 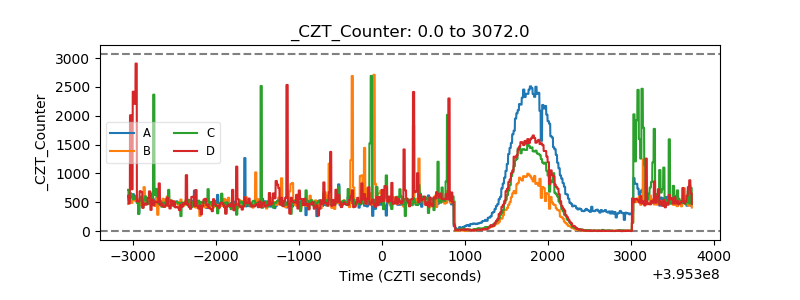 |
| +2.5 Volts monitor | 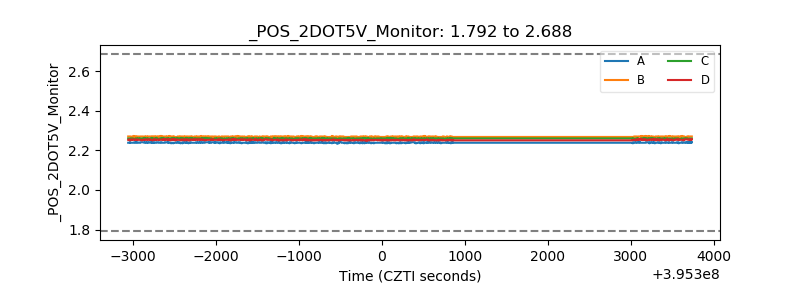 |
| +5 Volts monitor |  |
| _ROLL_ROT | 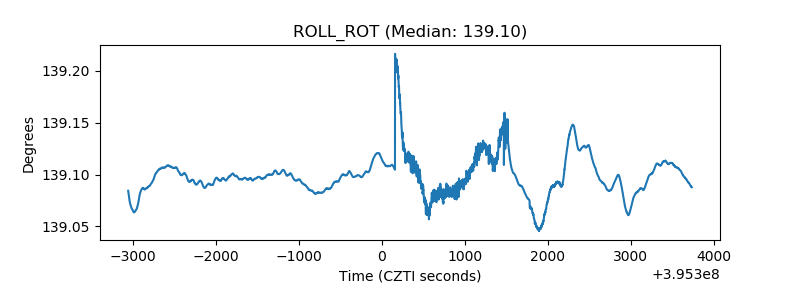 |
| _Roll_DEC | 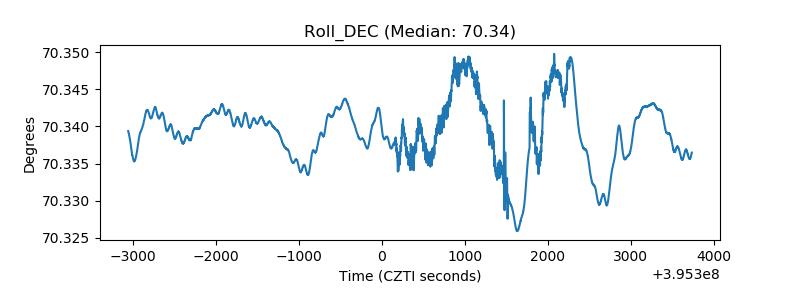 |
| _Roll_RA | 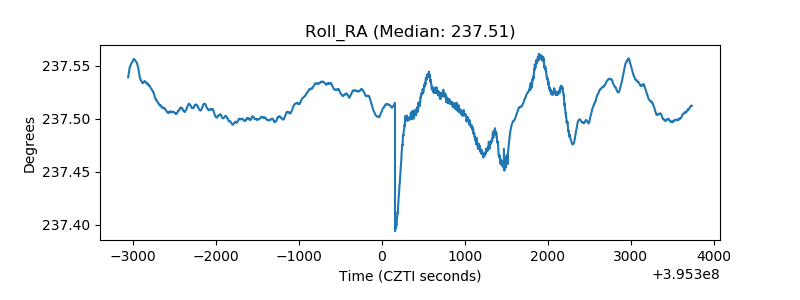 |
| Veto Counter | 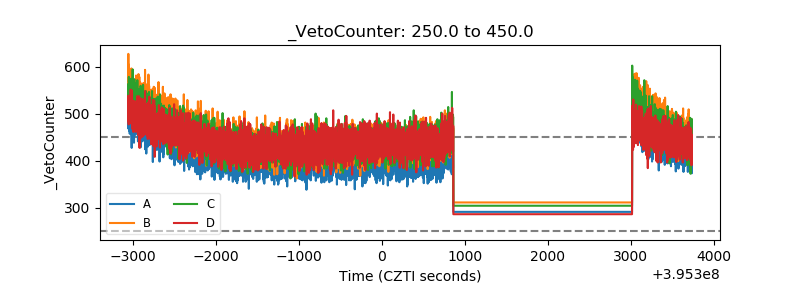 |