| Param | Original file | Final file |
|---|---|---|
| Filename | modeM0/AS1C07_001T09_9000005236_36697cztM0_level2.evt | modeM0/AS1C07_001T09_9000005236_36697cztM0_level2_quad_clean.evt |
| Size (bytes) | 382,677,120 | 96,701,760 |
| Size | 364.9 MB | 92.2 MB |
| Events in quadrant A | 2,465,811 | 660,918 |
| Events in quadrant B | 2,487,739 | 668,107 |
| Events in quadrant C | 3,091,953 | 639,033 |
| Events in quadrant D | 3,208,398 | 614,589 |
| Mode SS | |||
|---|---|---|---|
| Quadrant | BADHDUFLAG | Total packets | Discarded packets |
| A | 0 | 102 | 0 |
| B | 0 | 102 | 0 |
| C | 0 | 102 | 0 |
| D | 0 | 102 | 0 |
| Mode M9 | |||
|---|---|---|---|
| Quadrant | BADHDUFLAG | Total packets | Discarded packets |
| A | 0 | 21 | 0 |
| B | 0 | 21 | 0 |
| C | 0 | 21 | 0 |
| D | 0 | 22 | 0 |
| Mode M0 | |||
|---|---|---|---|
| Quadrant | BADHDUFLAG | Total packets | Discarded packets |
| A | 0 | 10279 | 3 |
| B | 0 | 10485 | 2 |
| C | 0 | 12075 | 2 |
| D | 0 | 12713 | 2 |
| Quadrant | Total seconds | Saturated seconds | Saturation percentage |
|---|---|---|---|
| A | 4925 | 8 | 0.162437% |
| B | 4925 | 34 | 0.690355% |
| C | 4925 | 160 | 3.248731% |
| D | 4925 | 144 | 2.923858% |
Noise dominated data is calculated using 1-second bins in cleaned event files. If a bin has >2000 counts, and if more than 50% of those come from <1% of pixels, then it is considered to be noise-dominated and hence unusable.
| Quadrant | # 1 sec bins | Bins with >0 counts | Bins with >2000 counts | High rate bins dominated by noise | Noise dominated (total time) | Noise dominated (detector-on time) | Marked lightcurve |
|---|---|---|---|---|---|---|---|
| A | 7048 | 4926 | 1 | 1 | 0.01% | 0.02% | 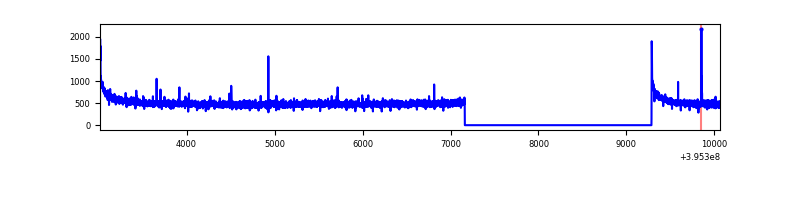 |
| B | 7048 | 4926 | 11 | 11 | 0.16% | 0.22% | 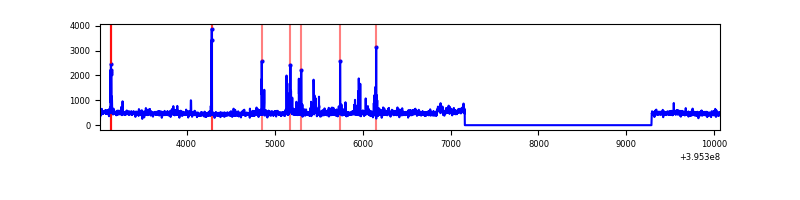 |
| C | 7048 | 4926 | 136 | 136 | 1.93% | 2.76% | 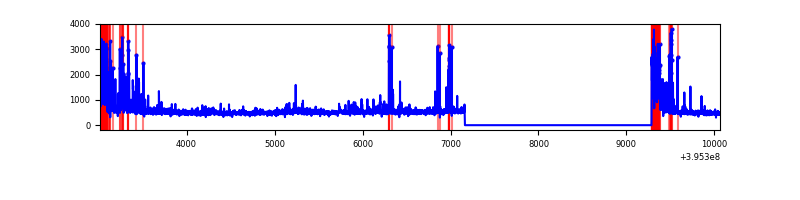 |
| D | 7048 | 4926 | 111 | 111 | 1.57% | 2.25% | 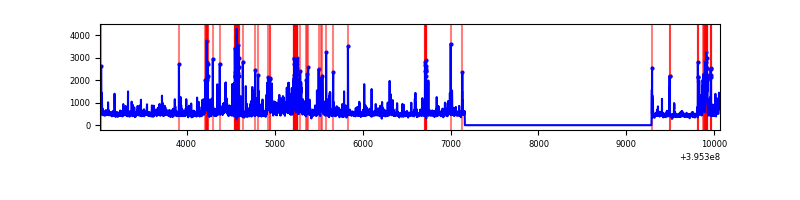 |
Top three noisy pixels from each quadrant. If the there are fewer than three noisy pixels in the level2.evt file, extra rows are filled as -1
| Pixel properties | Quadrant properties | ||||||
|---|---|---|---|---|---|---|---|
| Quadrant | DetID | PixID | Counts | Sigma | Mean | Median | Sigma |
| A | 10 | 83 | 207126 | 1784.84 | 577 | 567 | 115.7 |
| A | 9 | 143 | 10420 | 85.14 | 577 | 567 | 115.7 |
| A | 13 | 254 | 7732 | 61.91 | 577 | 567 | 115.7 |
| B | 5 | 255 | 91102 | 845.48 | 570 | 558 | 107.1 |
| B | 0 | 190 | 36694 | 337.43 | 570 | 558 | 107.1 |
| B | 0 | 189 | 26012 | 237.68 | 570 | 558 | 107.1 |
| C | 0 | 10 | 426642 | 3415.49 | 546 | 551 | 124.8 |
| C | 14 | 254 | 254031 | 2031.86 | 546 | 551 | 124.8 |
| C | 15 | 214 | 224160 | 1792.42 | 546 | 551 | 124.8 |
| D | 2 | 153 | 498173 | 3694.32 | 554 | 538 | 134.7 |
| D | 12 | 233 | 123625 | 913.77 | 554 | 538 | 134.7 |
| D | 2 | 137 | 97338 | 718.62 | 554 | 538 | 134.7 |
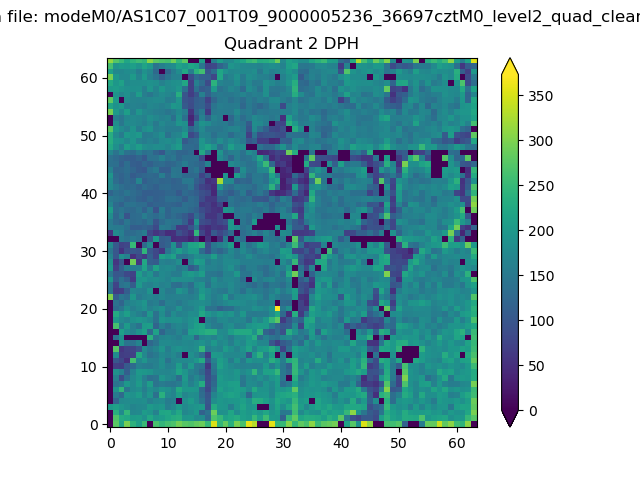
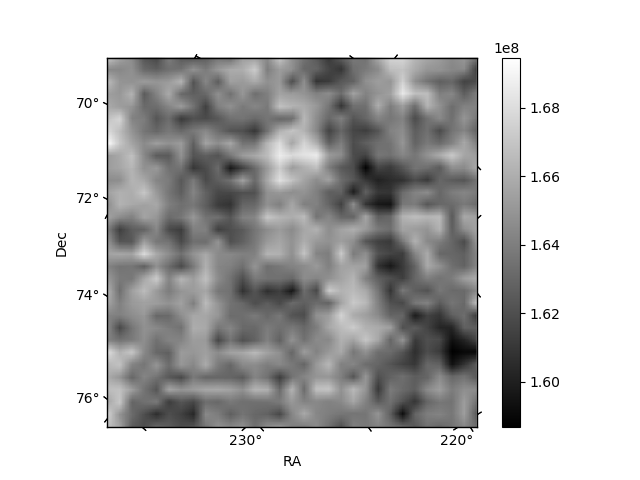
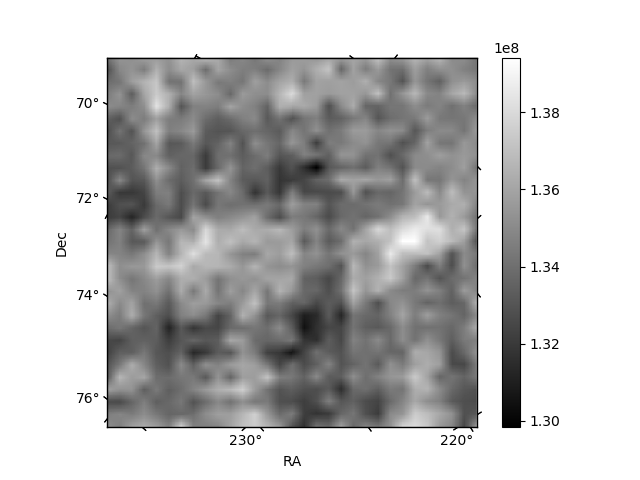
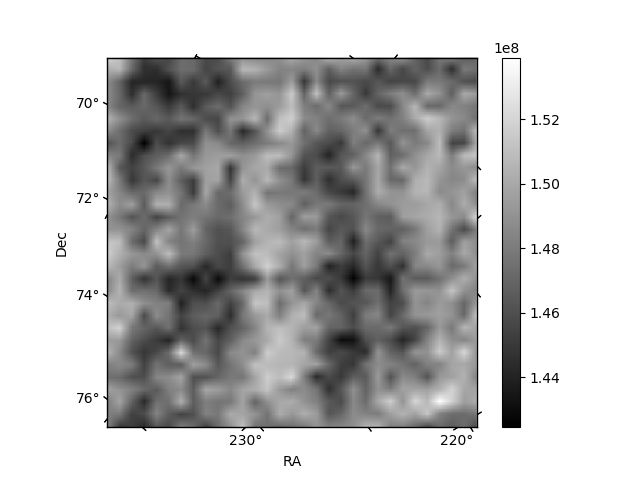
Histogram calculated using DETX and DETY for each event in the final _common_clean file
| Quadrant A | 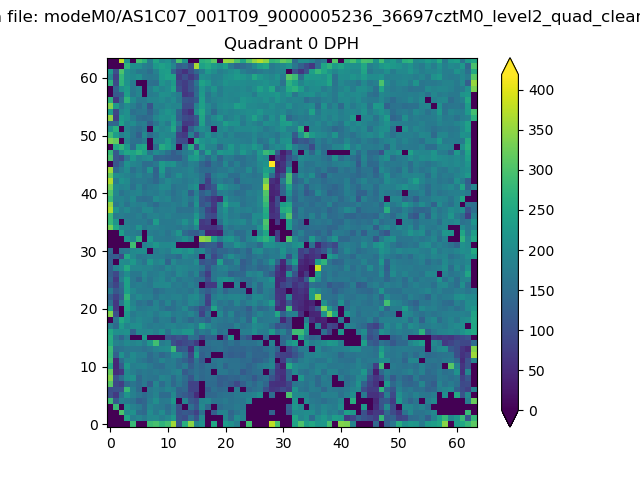 |
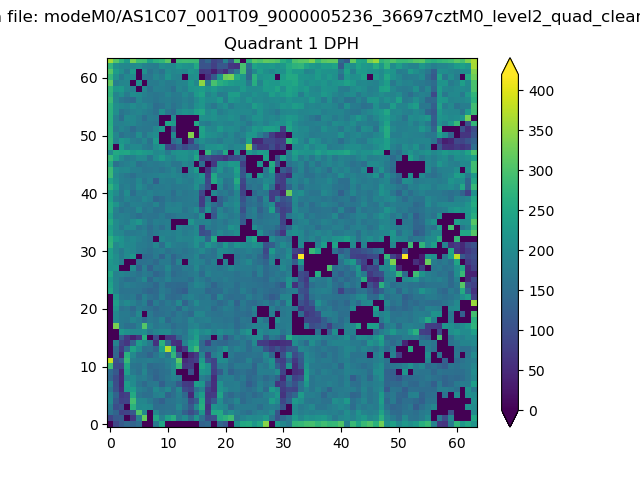 |
Quadrant B |
|---|---|---|---|
| Quadrant D | 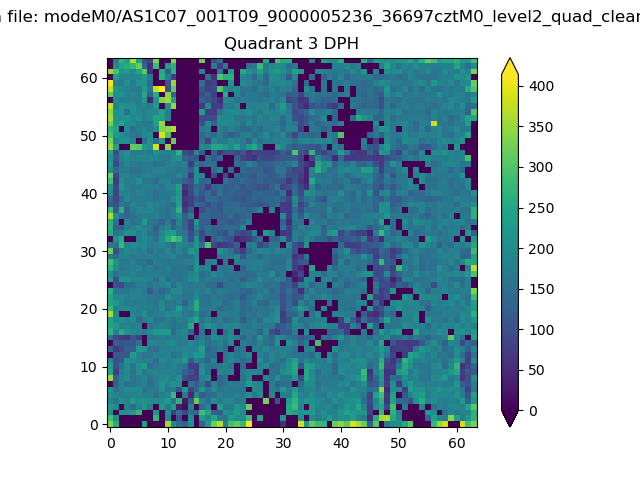 |
 |
Quadrant C |
| Plot type | Count rate plots | Images |
|---|---|---|
| Comparison with Poisson distribution Blue bars denote a histogram of data divided into 1 sec bins. Red curve is a Poisson curve with rate = median count rate of data. |
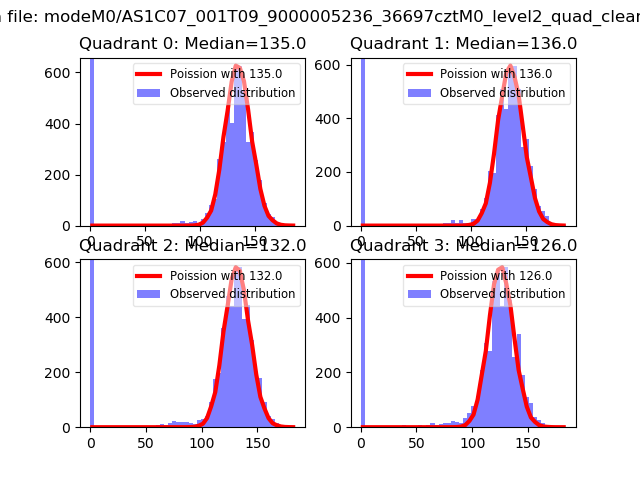 |
 |
| Quadrant-wise count rates Data is divided into 100 sec bins |
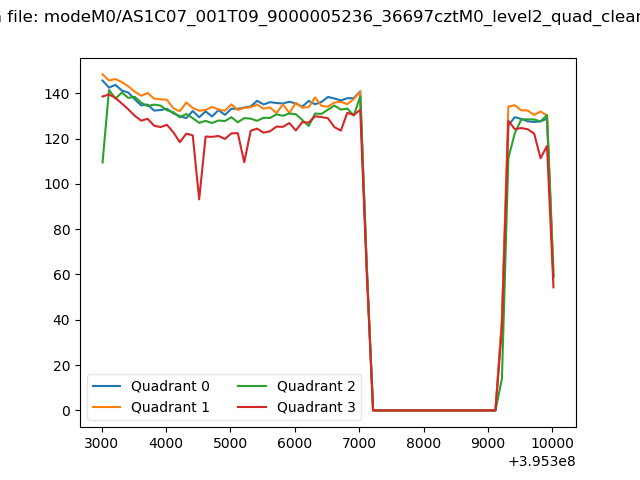 |
|
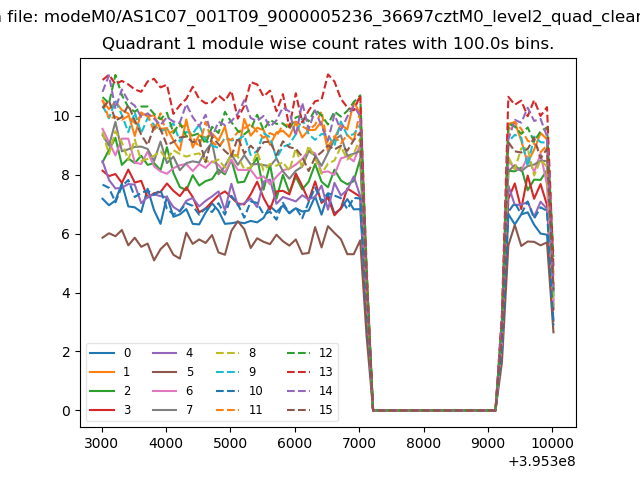
| Module-wise count rates for Quadrant A Data is divided into 100 sec bins |
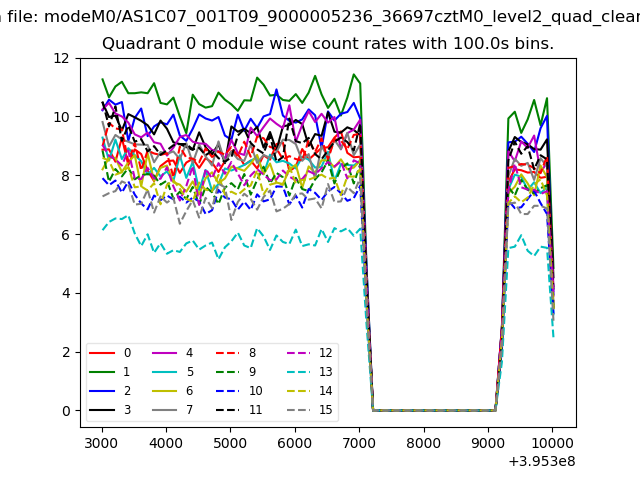 |
 |
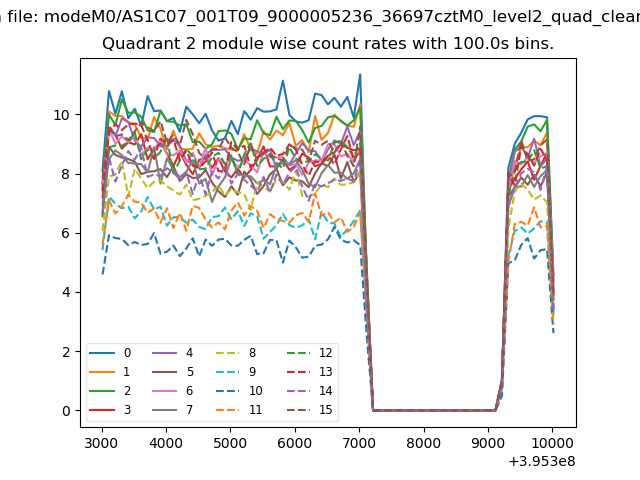
| Module-wise count rates for Quadrant B Data is divided into 100 sec bins |
 |
 |
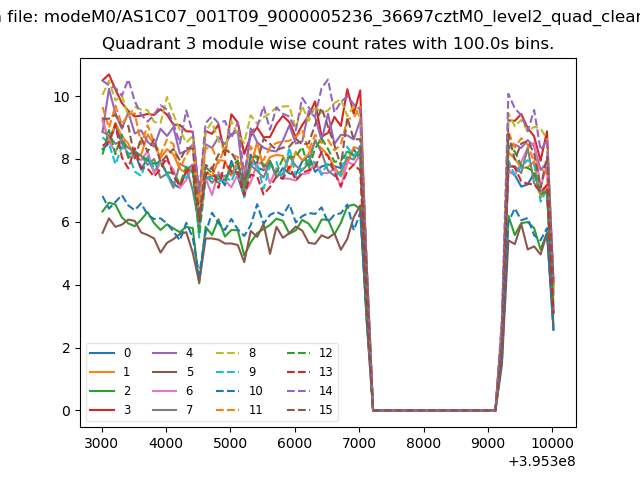
| Module-wise count rates for Quadrant C Data is divided into 100 sec bins |
 |
 |
| Module-wise count rates for Quadrant D Data is divided into 100 sec bins |
 |
 |
| Parameter | Plot |
|---|---|
| CZT HV Monitor | 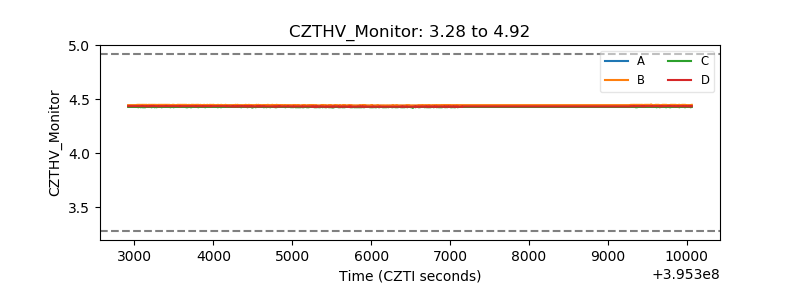 |
| D_VDD | 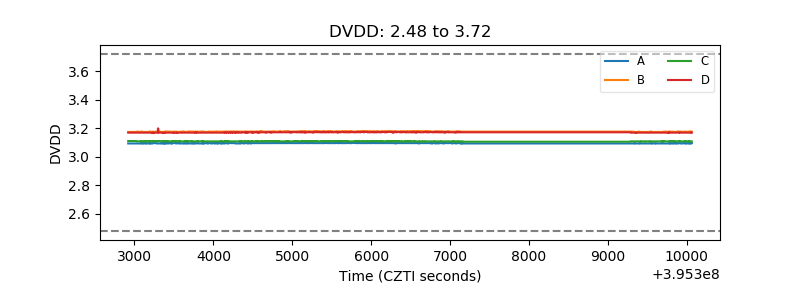 |
| Temperature 1 | 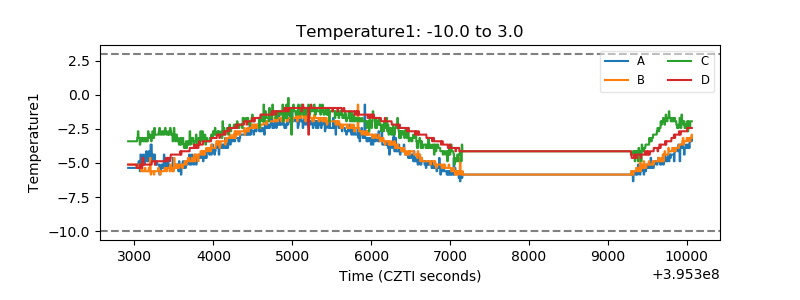 |
| Veto HV Monitor | 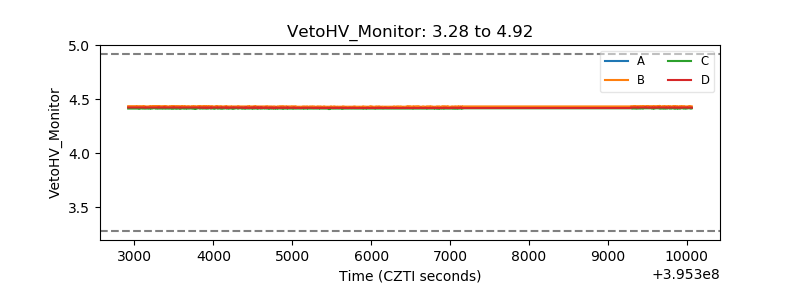 |
| Veto LLD | 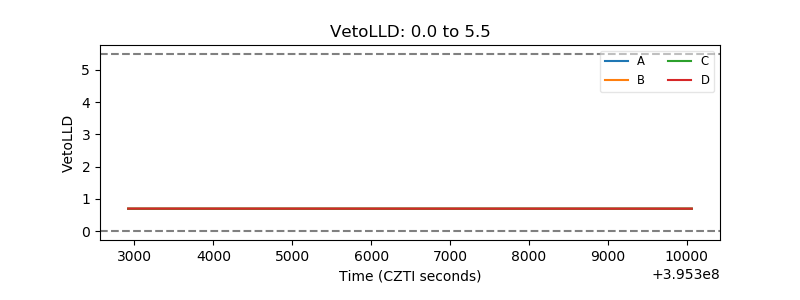 |
| Alpha Counter |  |
| _CPM_Rate | 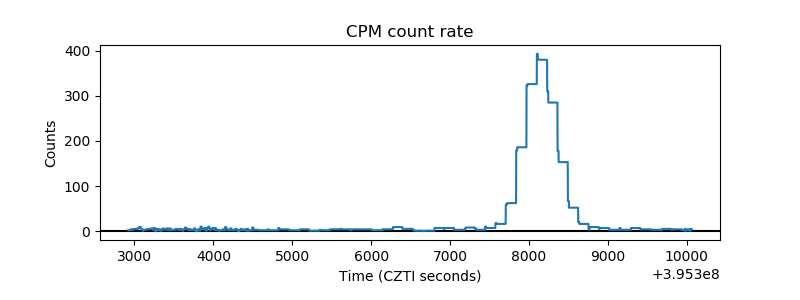 |
| CZT Counter |  |
| +2.5 Volts monitor |  |
| +5 Volts monitor |  |
| _ROLL_ROT | 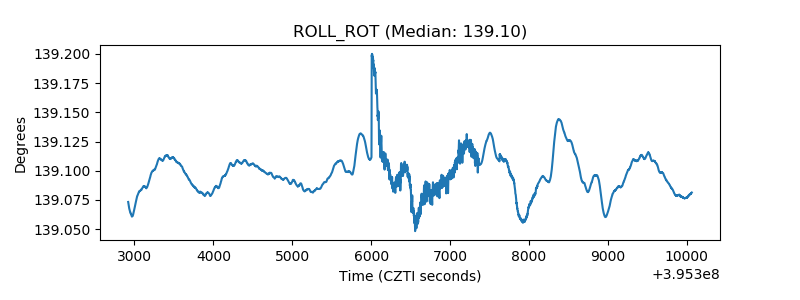 |
| _Roll_DEC | 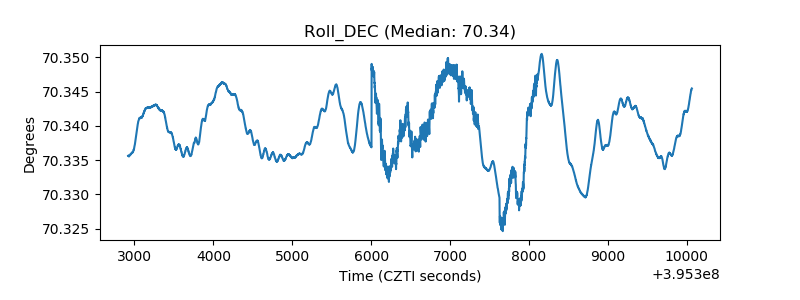 |
| _Roll_RA |  |
| Veto Counter | 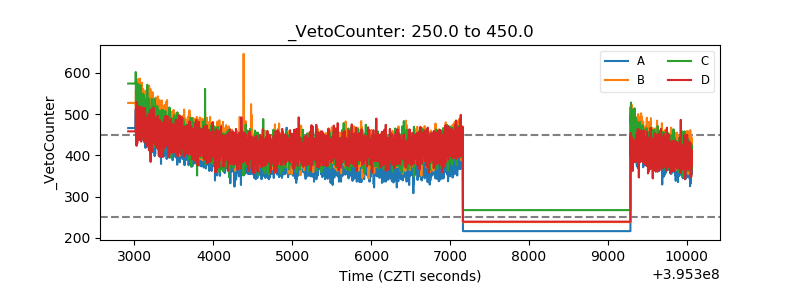 |