| Param | Original file | Final file |
|---|---|---|
| Filename | modeM0/AS1C07_001T09_9000005236_36699cztM0_level2.evt | modeM0/AS1C07_001T09_9000005236_36699cztM0_level2_quad_clean.evt |
| Size (bytes) | 401,224,320 | 100,961,280 |
| Size | 382.6 MB | 96.3 MB |
| Events in quadrant A | 2,626,545 | 682,211 |
| Events in quadrant B | 2,878,539 | 682,711 |
| Events in quadrant C | 3,303,206 | 660,942 |
| Events in quadrant D | 2,967,534 | 645,680 |
| Mode SS | |||
|---|---|---|---|
| Quadrant | BADHDUFLAG | Total packets | Discarded packets |
| A | 0 | 112 | 0 |
| B | 0 | 112 | 0 |
| C | 0 | 112 | 0 |
| D | 0 | 112 | 0 |
| Mode M9 | |||
|---|---|---|---|
| Quadrant | BADHDUFLAG | Total packets | Discarded packets |
| A | 0 | 20 | 0 |
| B | 0 | 20 | 0 |
| C | 0 | 20 | 0 |
| D | 0 | 21 | 0 |
| Mode M0 | |||
|---|---|---|---|
| Quadrant | BADHDUFLAG | Total packets | Discarded packets |
| A | 0 | 11423 | 3 |
| B | 0 | 12178 | 2 |
| C | 0 | 13207 | 2 |
| D | 0 | 12520 | 2 |
| Quadrant | Total seconds | Saturated seconds | Saturation percentage |
|---|---|---|---|
| A | 5518 | 8 | 0.144980% |
| B | 5518 | 42 | 0.761145% |
| C | 5518 | 170 | 3.080826% |
| D | 5518 | 54 | 0.978615% |
Noise dominated data is calculated using 1-second bins in cleaned event files. If a bin has >2000 counts, and if more than 50% of those come from <1% of pixels, then it is considered to be noise-dominated and hence unusable.
| Quadrant | # 1 sec bins | Bins with >0 counts | Bins with >2000 counts | High rate bins dominated by noise | Noise dominated (total time) | Noise dominated (detector-on time) | Marked lightcurve |
|---|---|---|---|---|---|---|---|
| A | 7101 | 5519 | 1 | 1 | 0.01% | 0.02% | 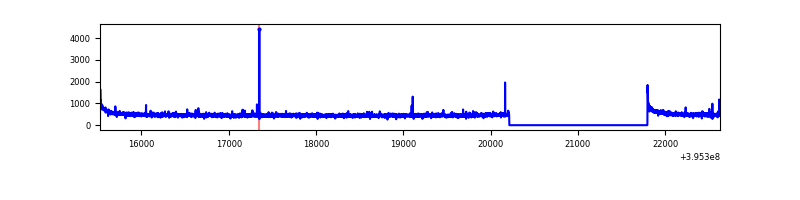 |
| B | 7101 | 5519 | 28 | 28 | 0.39% | 0.51% | 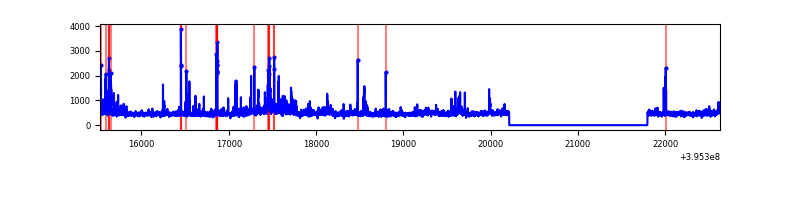 |
| C | 7101 | 5519 | 135 | 135 | 1.90% | 2.45% | 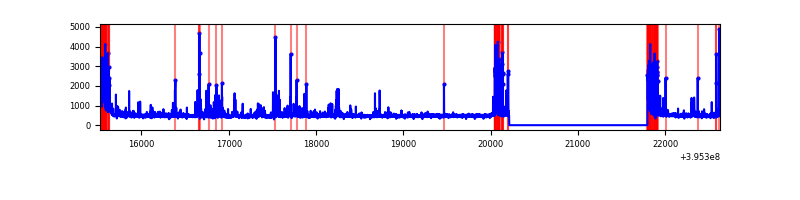 |
| D | 7101 | 5519 | 37 | 37 | 0.52% | 0.67% | 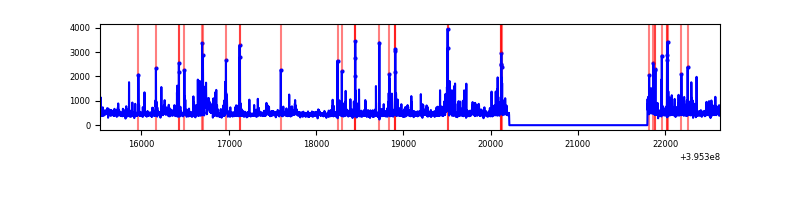 |
Top three noisy pixels from each quadrant. If the there are fewer than three noisy pixels in the level2.evt file, extra rows are filled as -1
| Pixel properties | Quadrant properties | ||||||
|---|---|---|---|---|---|---|---|
| Quadrant | DetID | PixID | Counts | Sigma | Mean | Median | Sigma |
| A | 10 | 83 | 226571 | 1848.86 | 611 | 598 | 122.2 |
| A | 9 | 143 | 11792 | 91.59 | 611 | 598 | 122.2 |
| A | 13 | 6 | 11578 | 89.84 | 611 | 598 | 122.2 |
| B | 5 | 255 | 149910 | 1316.52 | 605 | 592 | 113.4 |
| B | 0 | 197 | 75098 | 656.91 | 605 | 592 | 113.4 |
| B | 5 | 200 | 55696 | 485.84 | 605 | 592 | 113.4 |
| C | 0 | 10 | 407831 | 3007.64 | 586 | 588 | 135.4 |
| C | 14 | 254 | 326680 | 2408.31 | 586 | 588 | 135.4 |
| C | 15 | 214 | 251131 | 1850.35 | 586 | 588 | 135.4 |
| D | 13 | 171 | 111657 | 760.58 | 595 | 578 | 146.0 |
| D | 2 | 153 | 103001 | 701.31 | 595 | 578 | 146.0 |
| D | 2 | 249 | 87241 | 593.4 | 595 | 578 | 146.0 |
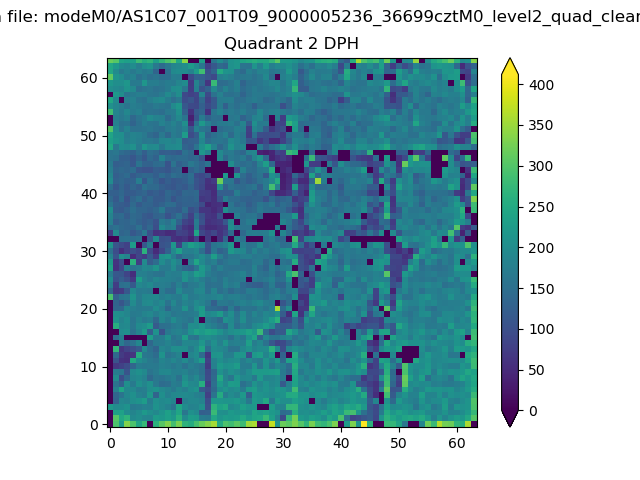
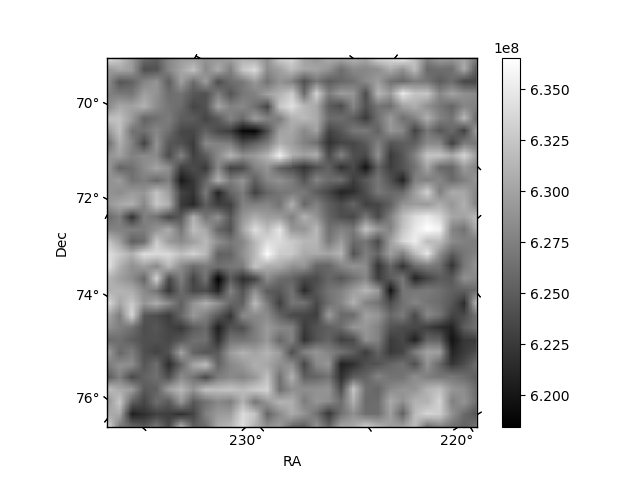
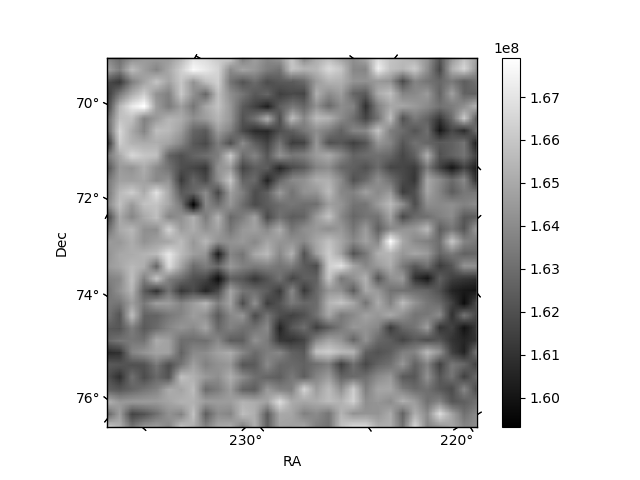
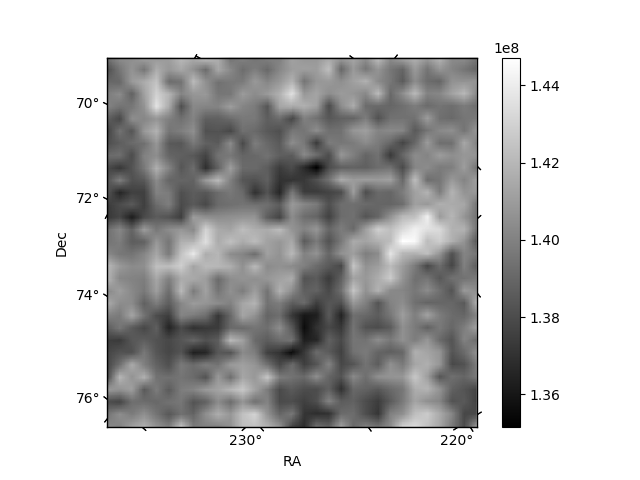
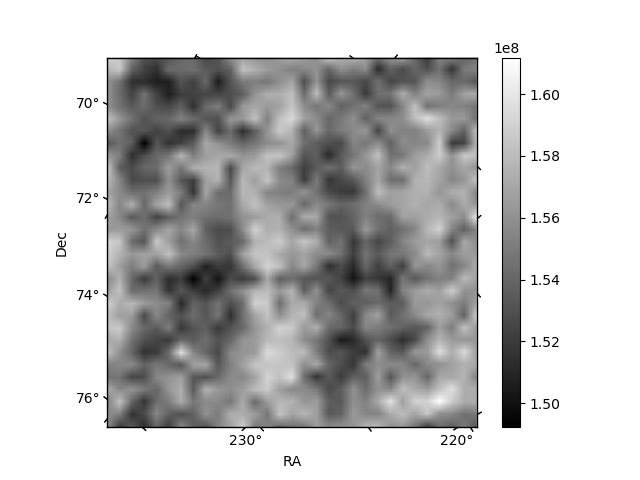
Histogram calculated using DETX and DETY for each event in the final _common_clean file
| Quadrant A | 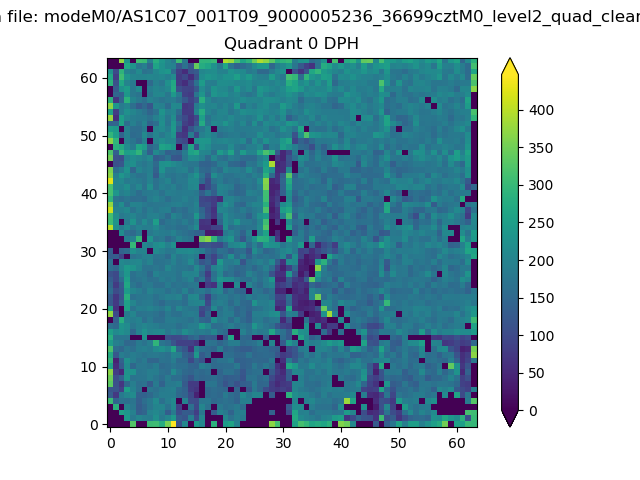 |
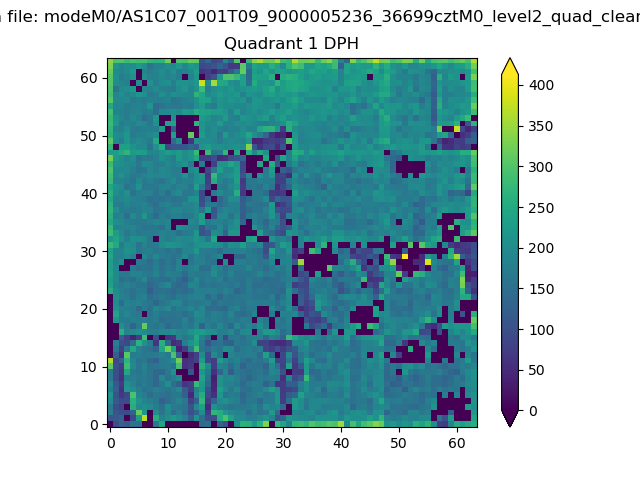 |
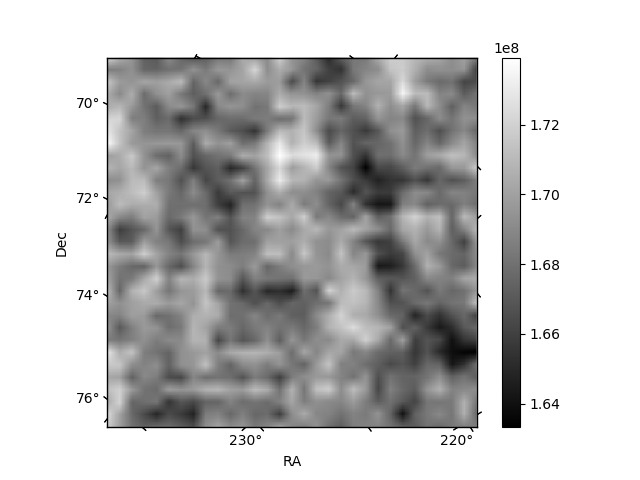
Quadrant B |
|---|---|---|---|
| Quadrant D | 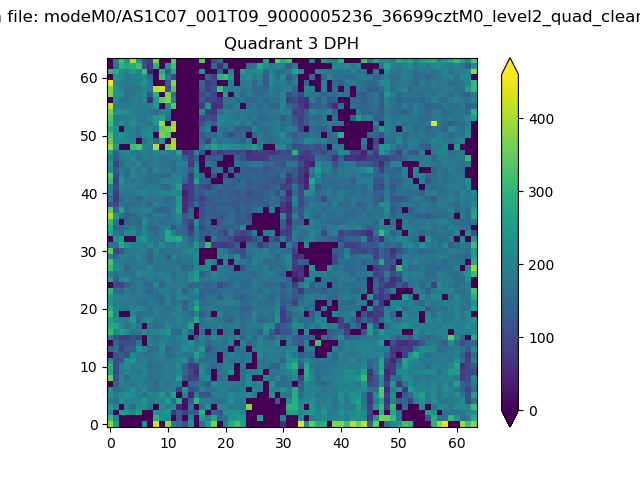 |
 |
Quadrant C |
| Plot type | Count rate plots | Images |
|---|---|---|
| Comparison with Poisson distribution Blue bars denote a histogram of data divided into 1 sec bins. Red curve is a Poisson curve with rate = median count rate of data. |
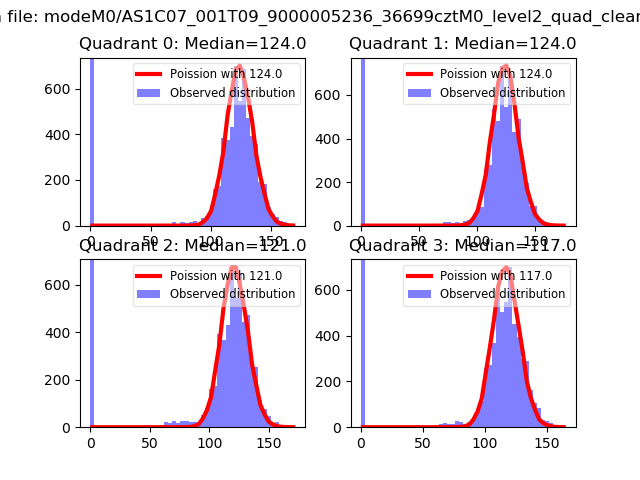 |
 |
| Quadrant-wise count rates Data is divided into 100 sec bins |
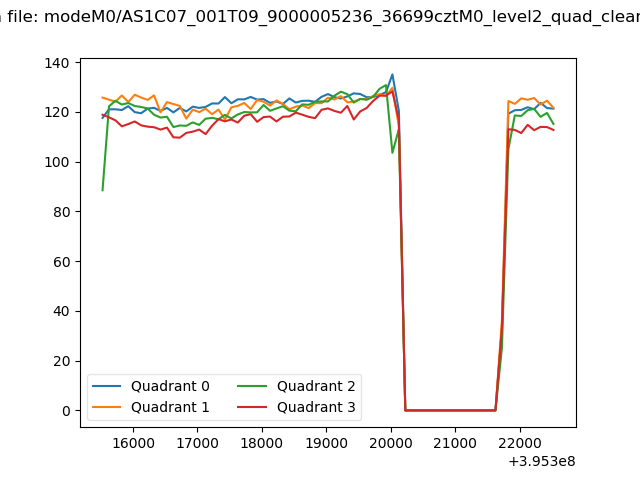 |
|
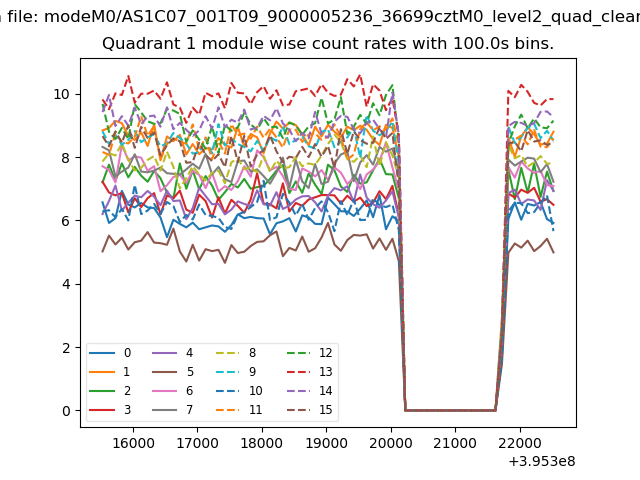
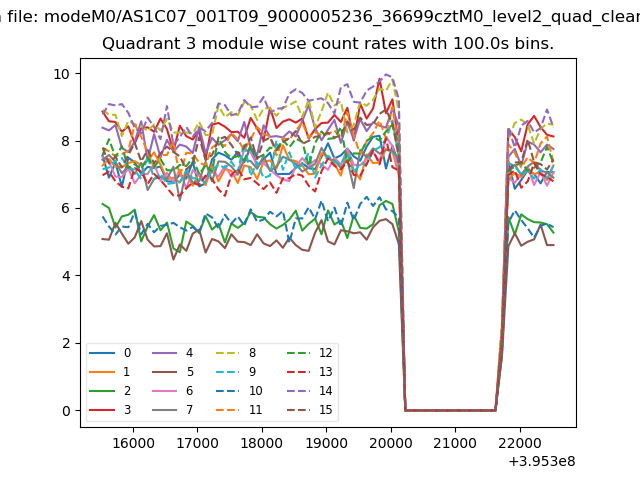
| Module-wise count rates for Quadrant A Data is divided into 100 sec bins |
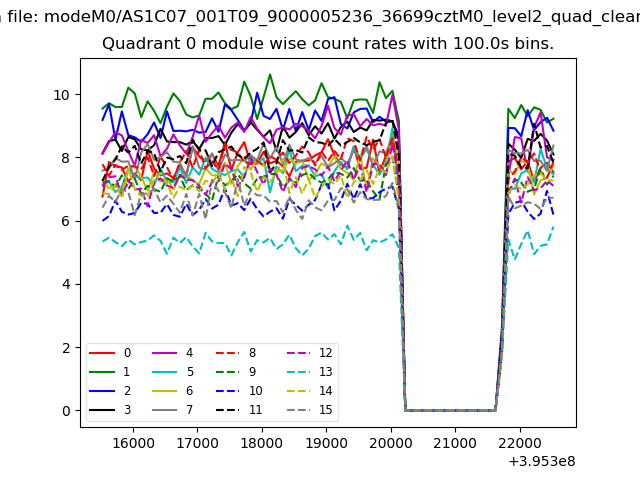 |
 |
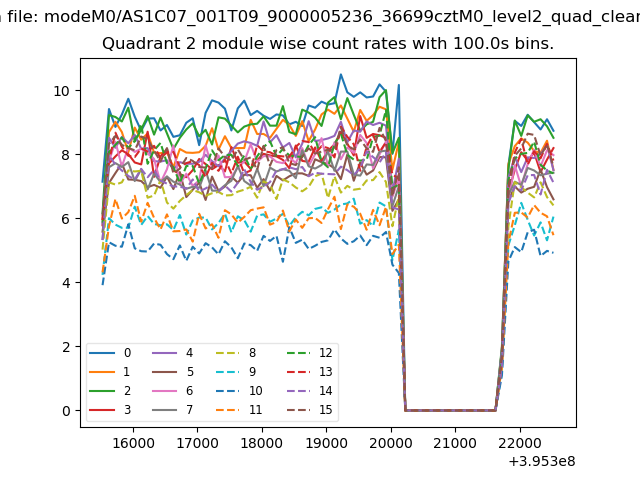
| Module-wise count rates for Quadrant B Data is divided into 100 sec bins |
 |
 |
| Module-wise count rates for Quadrant C Data is divided into 100 sec bins |
 |
 |
| Module-wise count rates for Quadrant D Data is divided into 100 sec bins |
 |
 |
| Parameter | Plot |
|---|---|
| CZT HV Monitor | 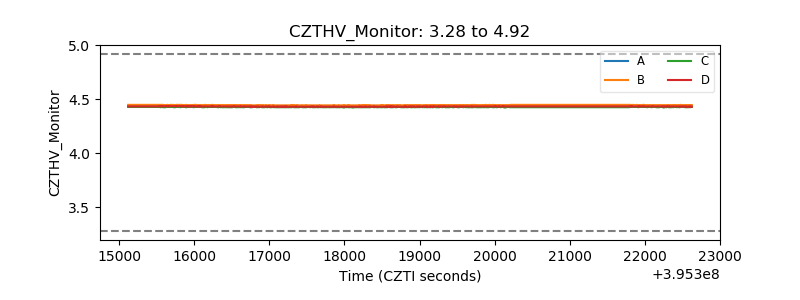 |
| D_VDD | 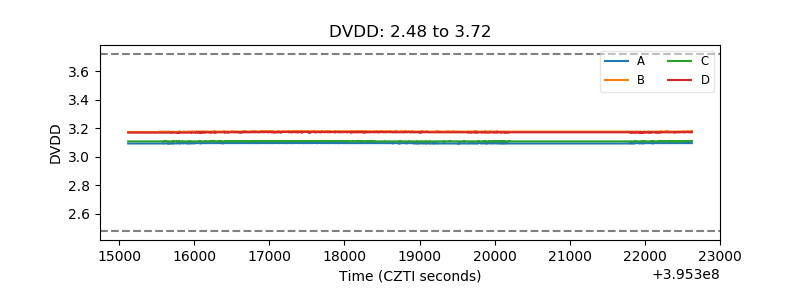 |
| Temperature 1 | 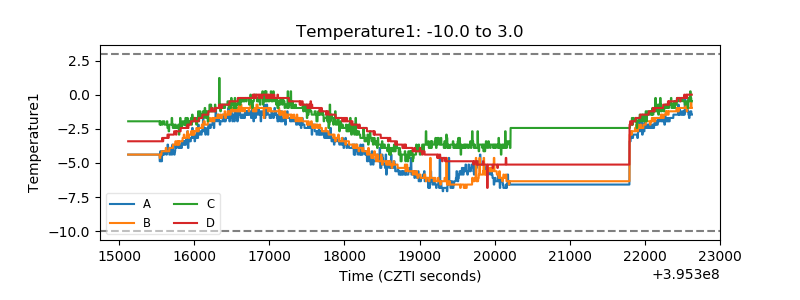 |
| Veto HV Monitor | 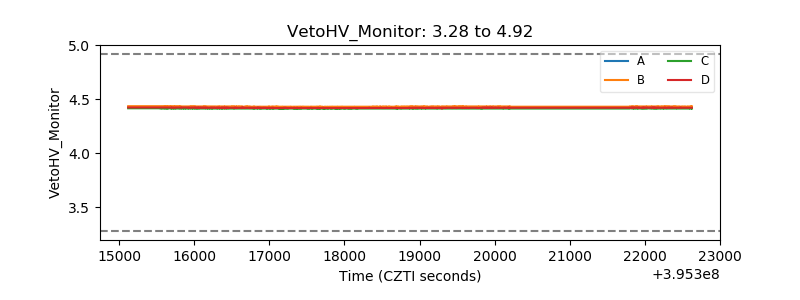 |
| Veto LLD | 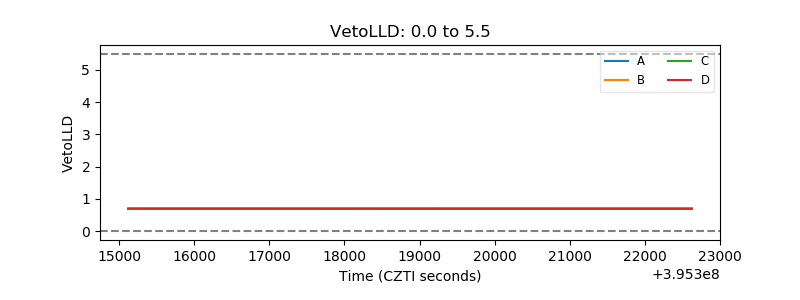 |
| Alpha Counter | 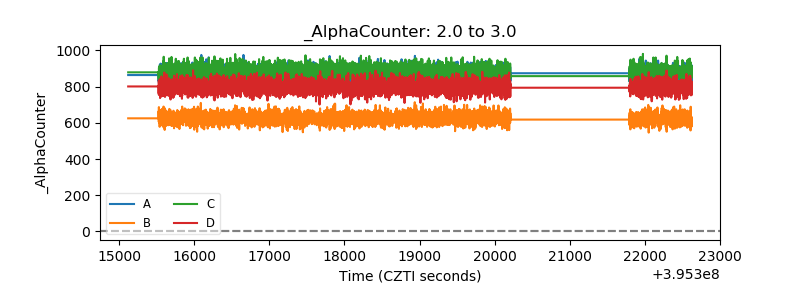 |
| _CPM_Rate | 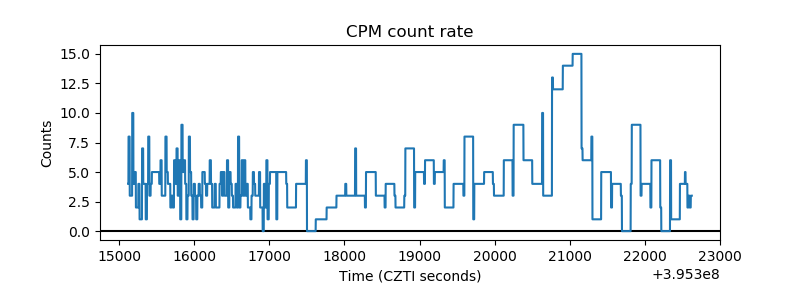 |
| CZT Counter | 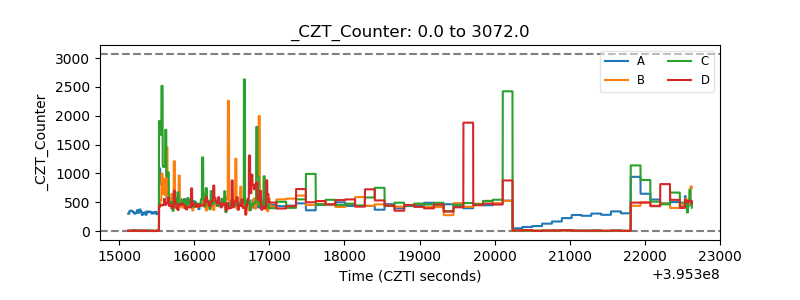 |
| +2.5 Volts monitor | 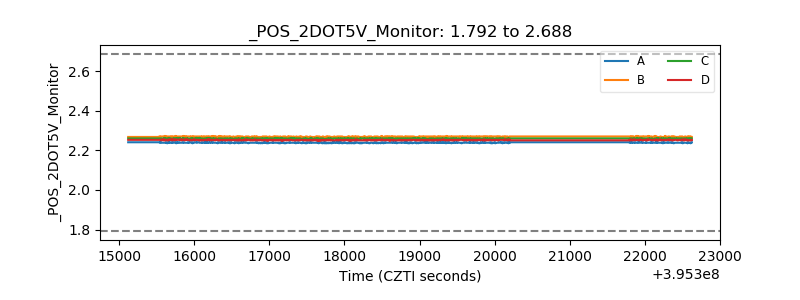 |
| +5 Volts monitor |  |
| _ROLL_ROT | 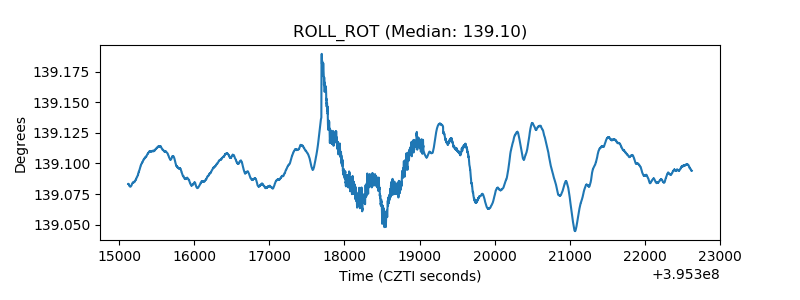 |
| _Roll_DEC | 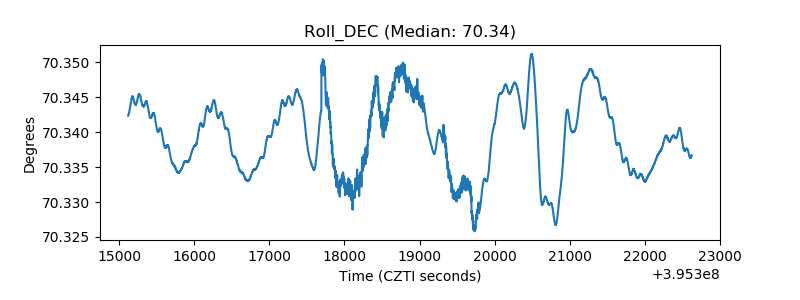 |
| _Roll_RA | 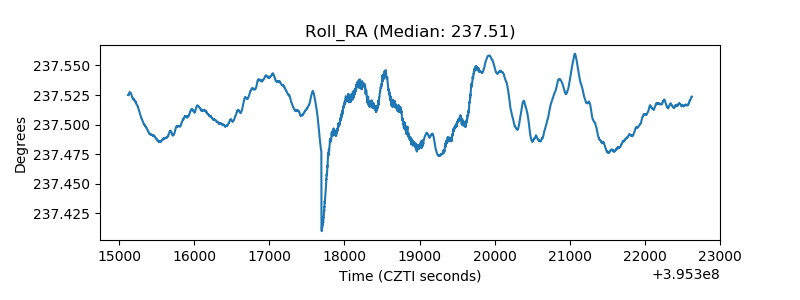 |
| Veto Counter | 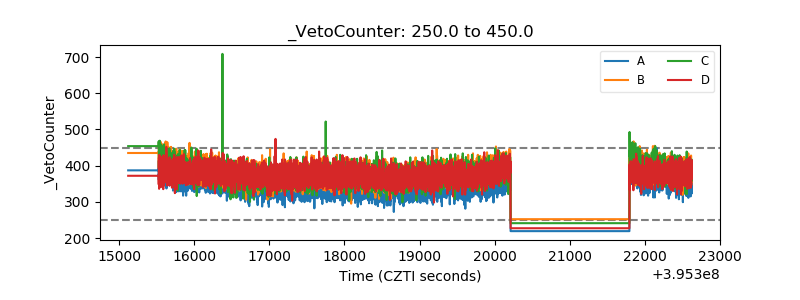 |